Estimated zip code population in 2022: 25,661 Zip code population in 2010: 25,223 Zip code population in 2000: 25,509
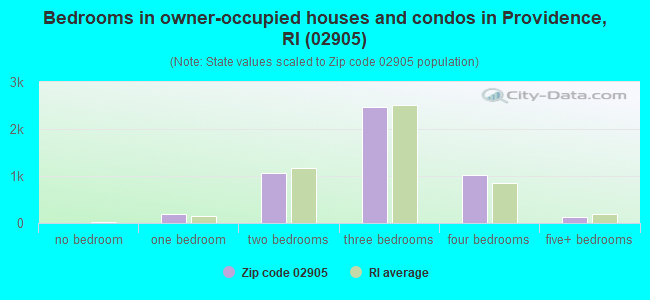
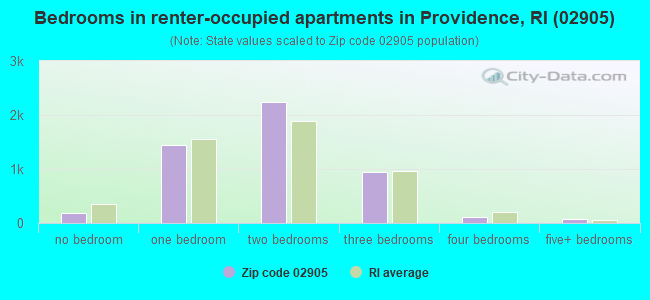
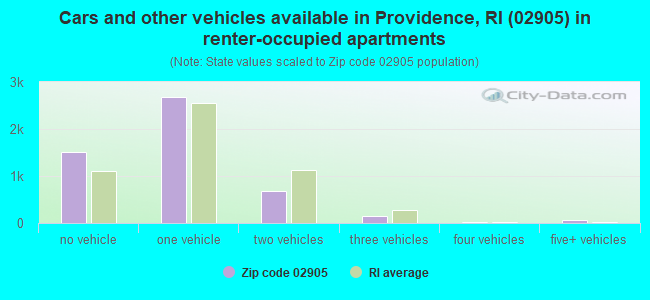
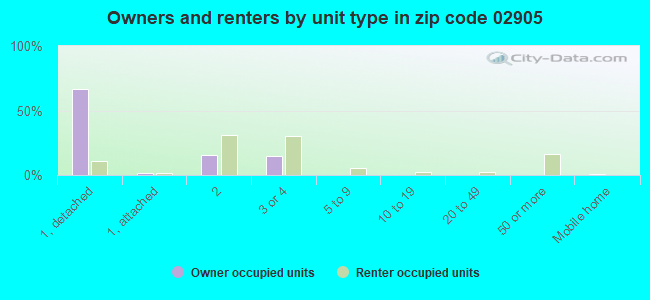
Houses and condos: 10,513 Renter-occupied apartments: 5,048
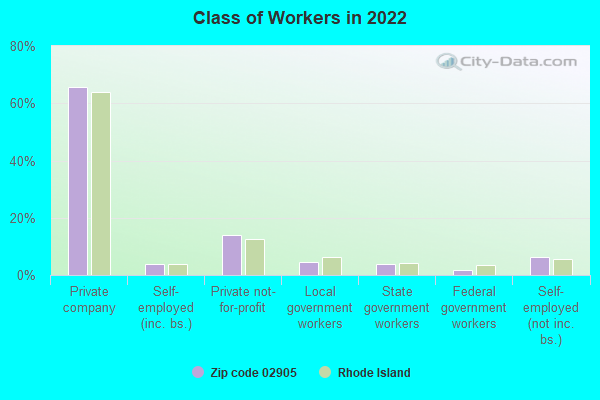
% of renters here:
51%
State:
37%
March 2022 cost of living index in zip code 02905: 92.9 (less than average, U.S. average is 100)
Land area: 3.7 sq. mi. Water area: 1.8 sq. mi.
Population density: 6,847 people per square mile
(high).
OSM Map
Google Map
MSN Map
OSM Map
General Map
Google Map
MSN Map
OSM Map
Google Map
MSN Map
OSM Map
Google Map
MSN Map
Please wait while loading the map...
Real estate property taxes paid for housing units in 2022:
This zip code:
1.4% ($4,540)
Rhode Island:
1.2% ($4,726)
Median real estate property taxes paid for housing units with mortgages in 2022: $4,721 (1.4%) Median real estate property taxes paid for housing units with no mortgage in 2022: $4,177 (1.4%)
Averages for the 2020 tax year for zip code 02905, filed in 2021:
Average Adjusted Gross Income (AGI) in 2020: $47,137 (Individual Income Tax Returns)
Here:
$47,137
State:
$74,300
Salary/wage: $43,299 (reported on 78.6% of returns)
Here:
$43,299
State:
$60,330
(% of AGI for various income ranges: 1065.0% for AGIs below $25k, 3359.3% for AGIs $25k-50k, 6502.3% for AGIs $50k-75k, 9988.4% for AGIs $75k-100k, 20504.7% for AGIs $100k-200k, 88737.0% for AGIs over 200k)
Taxable interest for individuals: $808 (reported on 22.1% of returns)
This zip code:
$808
Rhode Island:
$1,971
(% of AGI for various income ranges: 4.5% for AGIs below $25k, 4.9% for AGIs $25k-50k, 20.2% for AGIs $50k-75k, 31.8% for AGIs $75k-100k, 140.4% for AGIs $100k-200k, 1092.0% for AGIs over 200k)
Ordinary dividends: $6,201 (reported on 8.9% of returns)
Here:
$6,201
State:
$7,621
(% of AGI for various income ranges: 8.0% for AGIs below $25k, 10.0% for AGIs $25k-50k, 49.7% for AGIs $50k-75k, 152.0% for AGIs $75k-100k, 399.6% for AGIs $100k-200k, 3821.0% for AGIs over 200k)
Net capital gain/loss in AGI: +$28,652 (reported on 8.5% of returns)
Here:
+$28,652
State:
+$26,041
(% of AGI for various income ranges: 3.0% for AGIs below $25k, 16.6% for AGIs $25k-50k, 41.3% for AGIs $50k-75k, 206.4% for AGIs $75k-100k, 799.6% for AGIs $100k-200k, 28658.0% for AGIs over 200k)
Profit/loss from business: +$10,359 (reported on 16.0% of returns)
Here:
+$10,359
State:
+$15,775
(% of AGI for various income ranges: 141.6% for AGIs below $25k, 141.1% for AGIs $25k-50k, 178.6% for AGIs $50k-75k, 336.7% for AGIs $75k-100k, 948.0% for AGIs $100k-200k, 4454.0% for AGIs over 200k)
Taxable individual retirement arrangement distribution: $16,019 (reported on 3.7% of returns)
02905:
$16,019
Rhode Island:
$18,801
(% of AGI for various income ranges: 17.1% for AGIs below $25k, 28.1% for AGIs $25k-50k, 69.7% for AGIs $50k-75k, 220.0% for AGIs $75k-100k, 550.4% for AGIs $100k-200k, 2010.0% for AGIs over 200k)
Self-employed (Keogh) retirement plans: $22,050 (reported on 0.3% of returns)
02905:
$22,050
Rhode Island:
$23,424
(% of AGI for various income ranges: 39.6% for AGIs $75k-100k, 664.0% for AGIs over 200k)
Total itemized deductions: $24,432 (reported on 5.0% of returns)
Here:
$24,432
State:
$29,550
(% of AGI for various income ranges: 21.2% for AGIs below $25k, 56.2% for AGIs $25k-50k, 233.4% for AGIs $50k-75k, 482.0% for AGIs $75k-100k, 869.2% for AGIs $100k-200k, 4799.0% for AGIs over 200k)
Charity contributions: $6,589 (reported on 3.8% of returns)
Here:
$6,589
State:
$7,826
(% of AGI for various income ranges: 8.1% for AGIs $25k-50k, 33.9% for AGIs $50k-75k, 63.8% for AGIs $75k-100k, 184.3% for AGIs $100k-200k, 1639.0% for AGIs over 200k)
Taxes paid: $7,904 (reported on 4.9% of returns)
02905:
$7,904
State:
$8,398
(% of AGI for various income ranges: 3.8% for AGIs below $25k, 13.2% for AGIs $25k-50k, 77.2% for AGIs $50k-75k, 187.8% for AGIs $75k-100k, 335.7% for AGIs $100k-200k, 1306.0% for AGIs over 200k)
Earned income credit: $2,311 (reported on 22.5% of returns)
Here:
$2,311
State:
$2,059
(% of AGI for various income ranges: 113.4% for AGIs below $25k, 85.9% for AGIs $25k-50k, 0.8% for AGIs $50k-75k)
Percentage of individuals using paid preparers for their 2020 taxes: 95.5%
Here:
95%
State:
94%
(% for various income ranges: 95.2% for AGIs below $25k, 96.7% for AGIs $25k-50k, 95.4% for AGIs $50k-75k, 93.9% for AGIs $75k-100k, 93.8% for AGIs $100k-200k, 94.1% for AGIs over 200k)
Averages for the 2012 tax year for zip code 02905, filed in 2013:
Average Adjusted Gross Income (AGI) in 2012: $39,159 (Individual Income Tax Returns)
Here:
$39,159
State:
$60,628
Salary/wage: $35,662 (reported on 86.2% of returns)
Here:
$35,662
State:
$50,029
(% of AGI for various income ranges: 75.2% for AGIs below $25k, 86.9% for AGIs $25k-50k, 82.3% for AGIs $50k-75k, 81.5% for AGIs $75k-100k, 78.0% for AGIs $100k-200k, 64.5% for AGIs over 200k)
Taxable interest for individuals: $1,028 (reported on 19.3% of returns)
This zip code:
$1,028
Rhode Island:
$1,640
(% of AGI for various income ranges: 0.4% for AGIs below $25k, 0.4% for AGIs $25k-50k, 0.5% for AGIs $50k-75k, 0.4% for AGIs $75k-100k, 0.8% for AGIs $100k-200k, 0.5% for AGIs over 200k)
Ordinary dividends: $4,158 (reported on 9.8% of returns)
Here:
$4,158
State:
$6,396
(% of AGI for various income ranges: 0.5% for AGIs below $25k, 0.5% for AGIs $25k-50k, 0.9% for AGIs $50k-75k, 1.0% for AGIs $75k-100k, 1.8% for AGIs $100k-200k, 1.8% for AGIs over 200k)
Net capital gain/loss in AGI: +$9,711 (reported on 7.4% of returns)
Here:
+$9,711
State:
+$15,680
(% of AGI for various income ranges: 0.3% for AGIs $25k-50k, 0.4% for AGIs $50k-75k, 0.5% for AGIs $75k-100k, 1.4% for AGIs $100k-200k, 9.1% for AGIs over 200k)
Profit/loss from business: +$11,751 (reported on 15.9% of returns)
Here:
+$11,751
State:
+$15,678
(% of AGI for various income ranges: 13.4% for AGIs below $25k, 3.0% for AGIs $25k-50k, 2.3% for AGIs $50k-75k, 2.4% for AGIs $75k-100k, 3.6% for AGIs $100k-200k, 3.5% for AGIs over 200k)
Taxable individual retirement arrangement distribution: $11,233 (reported on 5.0% of returns)
02905:
$11,233
Rhode Island:
$14,081
(% of AGI for various income ranges: 1.0% for AGIs below $25k, 1.1% for AGIs $25k-50k, 1.6% for AGIs $50k-75k, 2.0% for AGIs $75k-100k, 2.1% for AGIs $100k-200k, 0.9% for AGIs over 200k)
Self-employment retirement plans: $16,100 (reported on 0.4% of returns)
02905:
$16,100
Rhode Island:
$18,642
Total itemized deductions: $20,275 (22% of AGI, reported on 22.1% of returns)
Here:
$20,275
State:
$24,445
Here:
21.6% of AGI
State:
20.5% of AGI
(% of AGI for various income ranges: 4.2% for AGIs below $25k, 9.1% for AGIs $25k-50k, 13.2% for AGIs $50k-75k, 14.3% for AGIs $75k-100k, 16.1% for AGIs $100k-200k, 13.4% for AGIs over 200k)
Charity contributions: $2,460 (reported on 17.5% of returns)
Here:
$2,460
State:
$2,961
(% of AGI for various income ranges: 0.3% for AGIs below $25k, 0.7% for AGIs $25k-50k, 1.1% for AGIs $50k-75k, 1.3% for AGIs $75k-100k, 1.9% for AGIs $100k-200k, 1.5% for AGIs over 200k)
Taxes paid: $9,108 (reported on 22.0% of returns)
02905:
$9,108
State:
$11,235
(% of AGI for various income ranges: 1.2% for AGIs below $25k, 2.7% for AGIs $25k-50k, 5.2% for AGIs $50k-75k, 7.0% for AGIs $75k-100k, 8.1% for AGIs $100k-200k, 7.9% for AGIs over 200k)
Earned income credit: $2,541 (reported on 34.0% of returns)
Here:
$2,541
State:
$2,170
(% of AGI for various income ranges: 10.9% for AGIs below $25k, 1.5% for AGIs $25k-50k)
Percentage of individuals using paid preparers for their 2012 taxes: 65.1%
Here:
65%
State:
60%
(% for various income ranges: 65.5% for AGIs below $25k, 64.7% for AGIs $25k-50k, 61.4% for AGIs $50k-75k, 63.8% for AGIs $75k-100k, 66.1% for AGIs $100k-200k, 78.9% for AGIs over 200k)
Averages for the 2004 tax year for zip code 02905, filed in 2005:
Average Adjusted Gross Income (AGI) in 2004: $34,686 (Individual Income Tax Returns)
Here:
$34,686
State:
$51,090
Salary/wage: $31,174 (reported on 88.8% of returns)
Here:
$31,174
State:
$43,690
(% of AGI for various income ranges: 91.5% for AGIs below $10k, 84.8% for AGIs $10k-25k, 89.3% for AGIs $25k-50k, 86.4% for AGIs $50k-75k, 81.9% for AGIs $75k-100k, 62.6% for AGIs over 100k)
Taxable interest for individuals: $1,103 (reported on 33.3% of returns)
This zip code:
$1,103
Rhode Island:
$1,567
(% of AGI for various income ranges: 2.2% for AGIs below $10k, 0.9% for AGIs $10k-25k, 0.7% for AGIs $25k-50k, 1.0% for AGIs $50k-75k, 1.1% for AGIs $75k-100k, 1.4% for AGIs over 100k)
Taxable dividends: $2,928 (reported on 13.6% of returns)
Here:
$2,928
State:
$3,896
(% of AGI for various income ranges: 1.7% for AGIs below $10k, 0.5% for AGIs $10k-25k, 0.6% for AGIs $25k-50k, 0.7% for AGIs $50k-75k, 1.5% for AGIs $75k-100k, 2.0% for AGIs over 100k)
Net capital gain/loss: +$13,970 (reported on 10.6% of returns)
Here:
+$13,970
State:
+$15,829
(% of AGI for various income ranges: -0.7% for AGIs below $10k, 0.1% for AGIs $10k-25k, 0.4% for AGIs $25k-50k, 1.5% for AGIs $50k-75k, 1.6% for AGIs $75k-100k, 13.4% for AGIs over 100k)
Profit/loss from business: +$11,592 (reported on 13.5% of returns)
Here:
+$11,592
State:
+$15,557
(% of AGI for various income ranges: 15.2% for AGIs below $10k, 7.0% for AGIs $10k-25k, 2.9% for AGIs $25k-50k, 1.9% for AGIs $50k-75k, 3.6% for AGIs $75k-100k, 5.3% for AGIs over 100k)
IRA payment deduction: $2,863 (reported on 1.7% of returns)
02905:
$2,863
Rhode Island:
$3,092
(% of AGI for various income ranges: 0.1% for AGIs $10k-25k, 0.2% for AGIs $25k-50k, 0.2% for AGIs $50k-75k, 0.1% for AGIs $75k-100k, 0.1% for AGIs over 100k)
Self-employed pension: $14,806 (reported on 0.6% of returns)
Here:
$14,806
Rhode Island:
$14,597
Total itemized deductions: $18,156 (24% of AGI, reported on 25.5% of returns)
Here:
$18,156
State:
$20,228
Here:
24.2% of AGI
State:
21.1% of AGI
(% of AGI for various income ranges: 5.4% for AGIs below $10k, 7.3% for AGIs $10k-25k, 11.2% for AGIs $25k-50k, 15.5% for AGIs $50k-75k, 18.3% for AGIs $75k-100k, 16.0% for AGIs over 100k)
Charity contributions deductions: $2,425 (3% of AGI, reported on 22.0% of returns)
Here:
$2,425
State:
$2,620
Here:
3.0% of AGI
State:
2.6% of AGI
(% of AGI for various income ranges: 0.2% for AGIs below $10k, 0.4% for AGIs $10k-25k, 1.0% for AGIs $25k-50k, 1.5% for AGIs $50k-75k, 2.1% for AGIs $75k-100k, 2.6% for AGIs over 100k)
Total tax: $5,297 (reported on 65.7% of returns)
02905:
$5,297
State:
$8,437
(% of AGI for various income ranges: 3.1% for AGIs below $10k, 3.6% for AGIs $10k-25k, 6.5% for AGIs $25k-50k, 9.2% for AGIs $50k-75k, 10.8% for AGIs $75k-100k, 17.6% for AGIs over 100k)
Earned income credit: $2,001 (reported on 28.9% of returns)
Here:
$2,001
State:
$1,659
Percentage of individuals using paid preparers for their 2004 taxes: 71.0%
Here:
71%
State:
63%
(% for various income ranges: 69.0% for AGIs below $10k, 76.8% for AGIs $10k-25k, 68.1% for AGIs $25k-50k, 64.1% for AGIs $50k-75k, 67.4% for AGIs $75k-100k, 74.1% for AGIs over 100k)
Household received Food Stamps/SNAP in the past 12 months: 2,690 Household did not receive Food Stamps/SNAP in the past 12 months: 7,222
Women who had a birth in the past 12 months: 171 (63 now married, 107 unmarried) Women who did not have a birth in the past 12 months: 6,449 (2,178 now married, 4,266 unmarried)
Housing units in zip code 02905 with a mortgage: 3,501 (345 second mortgage, 265 both second mortgage and home equity loan) Houses without a mortgage: 249
Median monthly owner costs for units with a mortgage: $1,899 Median monthly owner costs for units without a mortgage: $802
Residents with income below the poverty level in 2022:
This zip code:
20.5%
Whole state:
10.8%
Residents with income below 50% of the poverty level in 2022:
This zip code:
8.2%
Whole state:
5.6%
Median number of rooms in houses and condos:
Here:
6.5
State:
6.2
Median number of rooms in apartments:
Here:
4.3
State:
4.1
Notable locations in this zip code not listed on our city pages
Notable locations in zip code 02905: Fuller Rock Light (A), Edgewood Yacht Club (B), Pawtuxet Yacht Club (C), Narragansett Yacht Club (D), Pawtuxet Reservation (E), Columbia Park (F), Rhode Island Yacht Club (G), Museum of Natural History Library (H), Museum of Natural History and Planetarium (I), John Waterman Arnold House (J), Culinary Archive and Museum (K), Providence Fire Department Allens Avenue Station (L), Tides Family Services Center (M), Roger Williams Day Care Center (N), Cranston Fire Department Station 1 (O), Carter Day Nursery (P), Carriage House Day Care Center (Q), Bright Horizons Family Center (R), William H Hall Free Library (S), Washington Park Branch Providence Public Library (T). Display/hide their locations on the map
Churches in zip code 02905 include: Trinity Episcopal Church (A), Universal Christian Assembly Church (B), Unification Church of Rhode Island (C), Church of the Transfiguration (D), Kingdom Hall of Jehovahs Witnesses (E), Pentecostal Church of God (F), Washington Park United Methodist Church (G), Christ Episcopal Church (H), Centro Evangelist Church (I). Display/hide their locations on the map
Parks in zip code 02905 include: Stillhouse Cove Park (1), Roger Williams Park Zoo (2), Pawtuxet State Park (3), Rogers Williams Park (4), Fay Memorial Field (5), Roger Williams Park (6), Roger Williams Park Historic District (7), Salter Grove State Park (8). Display/hide their locations on the map
2,770 married couples with children.
2,391 single-parent households (720 men, 1,671 women).
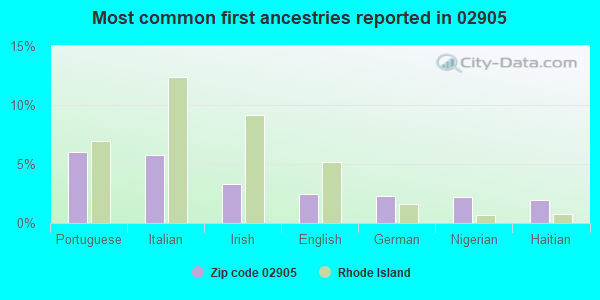
52.3% of residents of 02905 zip code speak English at home.
38.5% of residents speak Spanish at home (47% very well, 20% well, 13% not well, 21% not at all).
5.4% of residents speak other Indo-European language at home (70% very well, 17% well, 13% not well).
2.3% of residents speak Asian or Pacific Island language at home (72% very well, 27% well, 1% not well).
2.6% of residents speak other language at home (88% very well, 12% well).
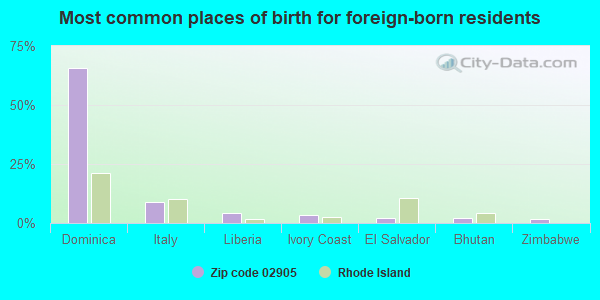
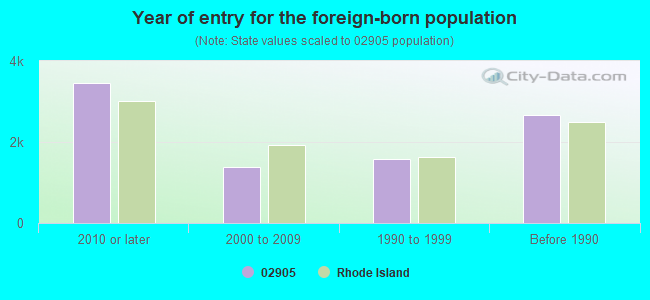
Foreign born population: 8,104 (31.6%) (56.9% of them are naturalized citizens)
Major facilities with environmental interests located in this zip code:
NBC FIELDS POINT (2 ERNEST STREET in PROVIDENCE, RI)
AIR SYNTHETIC MINOR (AIRS/AFS) ENFORCEMENT/COMPLIANCE ACTIVITY (Integrated Compliance Information System) (Integrated Compliance Information System) - ICIS-01-1995-0026, FORMAL ENFORCEMENT ACTION, ICIS-01-1977-0001, ICIS-01-1977-0007, ICIS-01-1983-0001, ICIS-01-1983-0006, COMPLIANCE ACTIVITY (Tracking inspections of insecticide, fungicide, and rodenticide, and toxic substances) CRITERIA AND HAZARDOUS AIR POLLUTANT INVENTORY (Inventory of air pollution sources) National Pollutant Discharge Elimination System MAJOR (Tracking pollutant discharge elimination systems) - permit - ICIS-, ENFORCEMENT/COMPLIANCE ACTIVITY National Pollutant Discharge Elimination System NON-MAJOR (Tracking pollutant discharge elimination systems) - permit Small Quantity Generators, between 100 kg and 1000 kg of hazardous waste/month (Resource Conservation and Recovery Act (tracking hazardous waste)) - notification Business SIC classification: SEWERAGE SYSTEMS Business NAICS classification: SEWAGE TREATMENT FACILITIES.; ALL OTHER MISCELLANEOUS WASTE MANAGEMENT SERVICES. Organizations: NBC - FIELD'S POINT WWTF (CONTACT/OPERATOR)
, FIELD'S POINT WWTF (CONTACT/OPERATOR)
, NARRAGANSETT BAY COMMISSION (CONTACT/OWNER)
, OWNERNAME (CONTACT/OWNER)
Alternative names: NARRAGANSETT BAY COMM-FIELDS, NARRAGANSETT BAY COMMISSION, NARRAGANSETT BAY COMMISSION FIELDS POINT, NARRAGANSETT BAY COMMISSION FLDS PT FACL, NARRANGANSETT BAY COMM-INCINER, NBC - FIELDS' POINT WWTF
ALLENS MANUFACTURING (89 SHIPYARD ST. in PROVIDENCE, RI)
AIR MINOR (AIRS/AFS) (Integrated Compliance Information System) - ICIS-01-1994-0004, FORMAL ENFORCEMENT ACTION, ICIS-01-1989-0018, ICIS-01-1994-0010, COMPLIANCE ACTIVITY (Tracking inspections of insecticide, fungicide, and rodenticide, and toxic substances) National Pollutant Discharge Elimination System NON-MAJOR (Tracking pollutant discharge elimination systems) - permit HAZARDOUS WASTE BIENNIAL REPORTER (Resource Conservation and Recovery Act (tracking hazardous waste)) (Resource Conservation and Recovery Act (tracking hazardous waste)) TRI REPORTER (Tracking of toxic chemicals releasing facilities) Business SIC classification: BOOT AND SHOE CUT STOCK AND FINDINGS; METAL STAMPINGS; FASTENERS, BUTTONS, NEEDLES, AND PINS Organizations: RICHARD SQUIZZERO (CONTACT/OWNER)
NATIONAL PLATING L L C (946 EDDY ST. in PROVIDENCE, RI)
AIR MINOR (AIRS/AFS) (Integrated Compliance Information System) - ICIS-01-1985-0005, FORMAL ENFORCEMENT ACTION CRITERIA AND HAZARDOUS AIR POLLUTANT INVENTORY (Inventory of air pollution sources) HAZARDOUS WASTE BIENNIAL REPORTER (Resource Conservation and Recovery Act (tracking hazardous waste)) Large Quantity Generators, more that 1000 kg of hazardous waste/month (Resource Conservation and Recovery Act (tracking hazardous waste)) - notification TRI REPORTER (Tracking of toxic chemicals releasing facilities) Business SIC and NAICS classification: ELECTROPLATING, PLATING, POLISHING, ANODIZING, AND COLORING Organizations: MAUREEN CONLON, NORMA RICCI (CONTACT/OWNER)
Alternative names: NATIONAL PLATING LLC
IRA GREEN INCORPORATED (177 GEORGIA AVE. in PROVIDENCE, RI)
AIR MINOR (AIRS/AFS) (Integrated Compliance Information System) - ICIS-01-1998-0082, FORMAL ENFORCEMENT ACTION COMPLIANCE ACTIVITY (Tracking inspections of insecticide, fungicide, and rodenticide, and toxic substances) CRITERIA AND HAZARDOUS AIR POLLUTANT INVENTORY (Inventory of air pollution sources) HAZARDOUS WASTE BIENNIAL REPORTER (Resource Conservation and Recovery Act (tracking hazardous waste)) Large Quantity Generators, more that 1000 kg of hazardous waste/month (Resource Conservation and Recovery Act (tracking hazardous waste)) - notification TRI REPORTER (Tracking of toxic chemicals releasing facilities) Business SIC classification: METAL STAMPINGS; COSTUME JEWELRY AND COSTUME NOVELTIES, EXCEPT PRECIOUS METAL; MANUFACTURING INDUSTRIES; NONDURABLE GOODS; NONCLASSIFIABLE ESTABLISHMENTS Business NAICS classification: ELECTROPLATING, PLATING, POLISHING, ANODIZING, AND COLORING. Alternative names: GREEN IRA
MOTIVA PROVIDENCE TERMINAL (520 ALLENS AVENUE in PROVIDENCE, RI)
AIR MAJOR (AIRS/AFS) CRITERIA AND HAZARDOUS AIR POLLUTANT INVENTORY (Inventory of air pollution sources) National Pollutant Discharge Elimination System NON-MAJOR (Tracking pollutant discharge elimination systems) - permit HAZARDOUS WASTE BIENNIAL REPORTER (Resource Conservation and Recovery Act (tracking hazardous waste)) Small Quantity Generators, between 100 kg and 1000 kg of hazardous waste/month (Resource Conservation and Recovery Act (tracking hazardous waste)) TRI REPORTER (Tracking of toxic chemicals releasing facilities) Business SIC classification: PETROLEUM BULK STATIONS AND TERMINALS Organizations: MOTIVA ENTERPRISES, LLC (CONTACT/OPERATOR)
, TEXACO U.S.A. (CONTACT/OPERATOR)
, MOTIVA ENTERPRISES LLC (CONTACT/OWNER)
Alternative names: MOTIVA ENT. (FKA STAR ENT. & TEXACO), MOTIVA ENTERPRISES LLC, STAR ENT.(TEXACO), STAR ENTERPRISE
NORTHLAND ENVIRONMENTAL INCORPORATED (275 ALLENS AVENUE in PROVIDENCE, RI)
COMPLIANCE ACTIVITY (Tracking inspections of insecticide, fungicide, and rodenticide, and toxic substances) National Pollutant Discharge Elimination System NON-MAJOR (Tracking pollutant discharge elimination systems) - permit HAZARDOUS WASTE BIENNIAL REPORTER (Resource Conservation and Recovery Act (tracking hazardous waste)) Large Quantity Generators, more that 1000 kg of hazardous waste/month (Resource Conservation and Recovery Act (tracking hazardous waste)) - notification TRANSPORTER (Resource Conservation and Recovery Act (tracking hazardous waste)) TSD (Resource Conservation and Recovery Act (tracking hazardous waste)) - notification Business SIC classification: REFUSE SYSTEMS Organizations: NORTHLAND ENVIRONMENTAL INC. (CONTACT/OPERATOR)
, NORTHLAND ENVIRONMENTAL, INC. (CONTACT/OWNER)
, PSC ENVIRONMENTAL SERVICES, INC. (CONTACT/OWNER)
FERGUSON PERFORATING & WIRE CO . INC. (130-140 ERNEST ST in PROVIDENCE, RI)
AIR MINOR (AIRS/AFS) CRITERIA AND HAZARDOUS AIR POLLUTANT INVENTORY (Inventory of air pollution sources) National Pollutant Discharge Elimination System NON-MAJOR (Tracking pollutant discharge elimination systems) - permit Small Quantity Generators, between 100 kg and 1000 kg of hazardous waste/month (Resource Conservation and Recovery Act (tracking hazardous waste)) - notification TRI REPORTER (Tracking of toxic chemicals releasing facilities) Business SIC classification: METAL STAMPINGS Business NAICS classification: METAL STAMPING. Organizations: FERGUSON PERFORATING & WIRE CO INC (CONTACT/OWNER)
BOLIDEN METECH, INC. (434 ALLENS AVENUE in PROVIDENCE, RI)
(Integrated Compliance Information System) - ICIS-01-1989-0019, FORMAL ENFORCEMENT ACTION COMPLIANCE ACTIVITY (Tracking inspections of insecticide, fungicide, and rodenticide, and toxic substances) Business SIC classification: SCRAP AND WASTE MATERIALS
JEWELERS REFINING SERVICE INC. (85 ELLENFIELD STREET in PROVIDENCE, RI)
AIR MINOR (AIRS/AFS) CRITERIA AND HAZARDOUS AIR POLLUTANT INVENTORY (Inventory of air pollution sources) Small Quantity Generators, between 100 kg and 1000 kg of hazardous waste/month (Resource Conservation and Recovery Act (tracking hazardous waste)) - notification (Resource Conservation and Recovery Act (tracking hazardous waste)) TRI REPORTER (Tracking of toxic chemicals releasing facilities) Business SIC classification: PRIMARY SMELTING AND REFINING OF NONFERROUS METALS, EXCEPT COPPER AND ALUMINUM; SECONDARY SMELTING AND REFINING OF NONFERROUS METALS Business NAICS classification: PRIMARY SMELTING AND REFINING OF NONFERROUS METAL (EXCEPT COPPER AND ALUMINUM). Organizations: JOSEPH RUGGIERO (CONTACT/OWNER)
, JEFFERY SITKIN (CONTACT/OWNER)
Alternative names: REFINING ONE INC
EDMUND W. FLYNN SCHOOL (220 BLACKSTONE STREET in PROVIDENCE, RI)
(Geographic Names Information System) (National Center for Education Statistics) - STATE ID-28158 Organizations: PROVIDENCE SCH DIST (SCHOOL DISTRICT)
146 CORPORATION (1325 CRANSTON ST in CRANSTON, RI)
(Integrated Compliance Information System) - ICIS-01-2004-7012, FORMAL ENFORCEMENT ACTION COMPLIANCE ACTIVITY (Tracking inspections of insecticide, fungicide, and rodenticide, and toxic substances)
MARY E. FOGARTY SCHOOL (199 OXFORD STREET in PROVIDENCE, RI)
(National Center for Education Statistics) - STATE ID-28160 Organizations: PROVIDENCE SCH DIST (SCHOOL DISTRICT)
ALAN SHAWN FEINSTEIN E. SCHOOL (1450 BROAD STREET in PROVIDENCE, RI)
(National Center for Education Statistics) - STATE ID-28116 Organizations: PROVIDENCE SCH DIST (SCHOOL DISTRICT)
Housing units lacking complete plumbing facilities: 1.8% Housing units lacking complete kitchen facilities: 1.9%
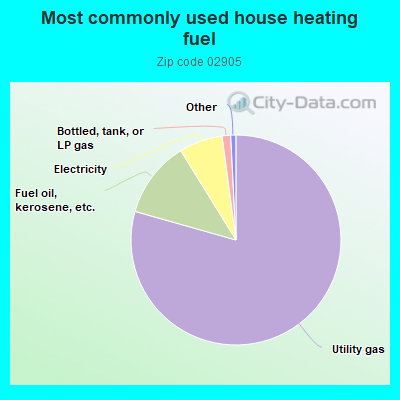
79.4%Utility gas
11.8%Fuel oil, kerosene, etc.
6.7%Electricity
1.3%Bottled, tank, or LP gas
Population in 1990: 24,885. Population change in the 1990s: +624 (+2.5%).
Place of birth for U.S.-born residents:
This state: 9,206
Northeast: 5,408
Midwest: 665
South: 1,128
West: 462
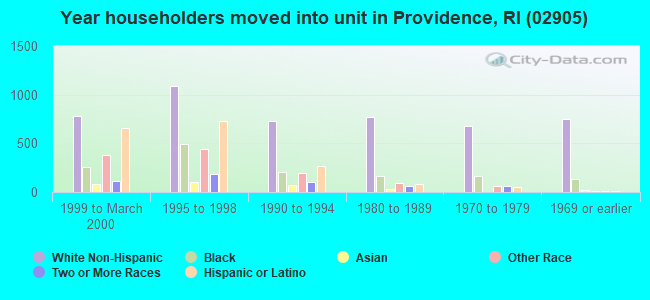
61% of the 02905 zip code residents lived in the same house 5 years ago. Out of people who lived in different houses, 67% lived in this county. Out of people who lived in different counties, 50% lived in Rhode Island.
90% of the 02905 zip code residents lived in the same house 1 year ago. Out of people who lived in different houses, 58% moved from this county. Out of people who lived in different houses, 3% moved from different county within same state. Out of people who lived in different houses, 26% moved from different state. Out of people who lived in different houses, 13% moved from abroad.
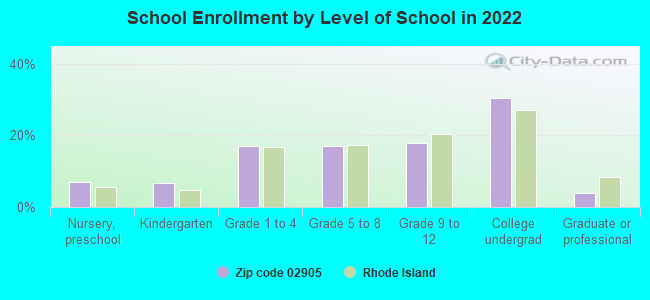
Private vs. public school enrollment:
Students in private schools in grades 1 to 8 (elementary and middle school): 287
Here:
12.2%
Rhode Island:
12.2%
Students in private schools in grades 9 to 12 (high school): 124
Here:
10.3%
Rhode Island:
11.6%
Students in private undergraduate colleges: 1,194
Here:
58.4%
Rhode Island:
41.1%
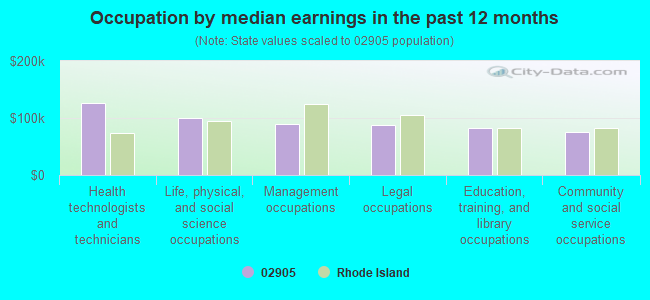
Occupation by median earnings in the past 12 months ($)
126,047Health technologists and technicians
99,426Life, physical, and social science occupations
89,740Management occupations
87,538Legal occupations
82,088Education, training, and library occupations
75,605Community and social service occupations
Companies with biggest federal contracts located in this zip code:
IRA GREEN, INC (177 GEORGIA AVENUE in PROVIDENCE, RI; small business) : $17,399,246 in 366 contractsfrom 1999 to 2006
Contracts for Badges and Insignia, Miscellaneous Items, Clothing, Special Purpose, Flags and Pennants, and moreby Defense Logistics Agency, Army, Air Force, U.S. Coast Guard, and others Signed by year:2000: $906,636; 2001: $2,591,759; 2002: $3,833,960; 2003: $981,239; 2004: $5,343,007; 2005: $2,067,839; 2006: $1,615,607.
Biggest contracts:
$866,250 with Defense Logistics Agency for Badges and Insignia. Signed on 2002-07-19. Completion date: 2003-07-20.
$690,409, same as above.Signed on 2001-06-15. Completion date: 2002-10-23.
$686,400, same as above.Signed on 2004-06-08. Completion date: 2005-01-12.
$544,680, same as above.Signed on 2004-07-14. Completion date: 2005-10-30.
MAHR FEDERAL INC (1144 EDDY ST in PROVIDENCE, RI; small business) : $2,746,024 in 38 contractsfrom 2000 to 2006
Contracts for Combination and Miscellaneous Instruments, Physical Properties Testing and Inspection, Miscellaneous Maintenance and Repair Shop Specialized Equipment, Electrical and Electronic Properties Measuring and Testing Instruments, and moreby Air Force, Army, NASA, Navy, and others Signed by year:2000: $218,745; 2001: $297,214; 2002: $319,466; 2003: $371,986; 2004: $557,985; 2005: $377,606; 2006: $603,022.
Biggest contracts:
$447,500 with Air Force for Combination and Miscellaneous Instruments. Signed on 2006-06-13. Completion date: 2008-09-30.
$346,775 with Air Force for Physical Properties Testing and Inspection. Signed on 2003-08-14. Completion date: 2006-02-04.
$318,140, same as above.Signed on 2004-06-23. Completion date: 2006-12-11.
$252,829 with Army for Miscellaneous Maintenance and Repair Shop Specialized Equipment. Signed on 2005-08-18. Completion date: 2005-12-28.
SIEGMUND & ASSOCIATES INC (49 PAVILION AVE in PROVIDENCE, RI; small business) : $646,125 in 17 contractsfrom 2000 to 2004
Contracts for Architect - Engineer Services (including landscaping, interior layout, and designing), Other Buildings, Maintenance, Repair and Rebuilding of Equipment -- Water Purification and Sewage Treatment Equipment, Highways, Roads, Streets, Bridges, and Railways by Navy Signed by year:2000: $173,926; 2001: $19,168; 2002: $363,409; 2003: $54,787; 2004: $34,835; 2005: $0; 2006: $0.
Biggest contracts:
$345,332 with Navy for Architect - Engineer Services (including landscaping, interior layout, and designing). Signed on 2002-01-24. Completion date: 2002-12-30.
$140,231, same as above.Signed on 2000-10-01. Completion date: 2000-11-28.
$33,695, same as above.Signed on 2000-11-30. Completion date: 2001-03-30.
$33,485, same as above.Signed on 2004-02-23. Completion date: 2004-06-23.
E R PICKETT CO INC (836 EDDY ST in PROVIDENCE, RI; small business) : $250,725 in 13 contractsfrom 2000 to 2005
Contracts for Maintenance, Repair or Alteration of Real Property -- Fuel Supply Facilities, Maintenance, Repair or Alteration of Real Property -- Other Non-Building Facilities, Construction of Structures and Facilities -- Other Utilities, Maintenance, Repair and Rebuilding of Equipment -- Special Industry Machinery, and moreby Navy, Army Signed by year:2000: $44,412; 2001: $0; 2002: $5,103; 2003: $47,684; 2004: $29,285; 2005: $124,241; 2006: $0.
Biggest contracts:
$78,603 with Navy for Maintenance, Repair or Alteration of Real Property -- Fuel Supply Facilities. Signed on 2005-06-02. Completion date: 2005-06-30.
$53,420 with Navy for Maintenance, Repair or Alteration of Real Property -- Other Non-Building Facilities. Signed on 2005-02-25. Completion date: 2006-01-09.
$44,412 with Navy for Construction of Structures and Facilities -- Other Utilities. Signed on 2000-11-22. Completion date: 2001-01-10.
$21,342 with Navy for Maintenance, Repair and Rebuilding of Equipment -- Special Industry Machinery. Signed on 2003-11-03. Completion date: 2004-03-31.
SIEGMUND ENVIRONMENTAL SERVICE (49 PAVILION AVENUE in PROVIDENCE, RI; small business) : $244,326 in 9 contractsfrom 2001 to 2004
Contracts for Maintenance, Repair and Rebuilding of Equipment -- Water Purification and Sewage Treatment Equipment, Maintenance, Repair and Rebuilding of Equipment -- Pumps and Compressors by Army, Navy Signed by year:2000: $0; 2001: $29,200; 2002: $77,400; 2003: $89,526; 2004: $48,200; 2005: $0; 2006: $0.
Biggest contracts:
$48,200 with Army for Maintenance, Repair and Rebuilding of Equipment -- Water Purification and Sewage Treatment Equipment. Taking place in NY. Signed on 2004-10-25. Completion date: 2003-09-30.
$48,200, same as above.Signed on 2003-10-30. Completion date: 2003-09-30.
$48,200, same as above.Signed on 2002-11-07. Completion date: 2003-09-30.
$29,200 with Army for Maintenance, Repair and Rebuilding of Equipment -- Pumps and Compressors. Taking place in NY. Signed on 2003-10-29. Completion date: 2003-09-30.
CLEAN HARBORS ENVIRONMENTAL SE (1 TERMINAL RD in PROVIDENCE, RI) : $109,481 in 60 contractsfrom 2001 to 2005
Contracts for Custodial Janitorial Services, Hazardous Substance Removal, Cleanup, and Disposal Services and Operational Support by Navy Signed by year:2000: $0; 2001: $38,654; 2002: $34,569; 2003: $18,379; 2004: $6,177; 2005: $11,702; 2006: $0.
Biggest contracts:
$38,654 with Navy for Custodial Janitorial Services. Signed on 2001-11-30. Completion date: 2002-09-30.
$4,635 with Navy for Hazardous Substance Removal, Cleanup, and Disposal Services and Operational Support. Signed on 2002-04-12. Completion date: 2002-04-15.
$4,056, same as above.Signed on 2002-03-22. Completion date: 2002-03-29.
$2,480, same as above.Signed on 2004-06-02. Completion date: 2004-06-04.
FERGUSON PERFORATING & WIRE CO (130 ERNEST ST in PROVIDENCE, RI; small business) : $98,425 in 7 contractsfrom 2004 to 2006
Contracts for Plate, Sheet, Strip, and Foil; Nonferrous Base Metal by Defense Logistics Agency Signed by year:2000: $0; 2001: $0; 2002: $0; 2003: $0; 2004: $44,500; 2005: $38,925; 2006: $15,000.
Biggest contracts:
$20,000 with Defense Logistics Agency for Plate, Sheet, Strip, and Foil; Nonferrous Base Metal. Signed on 2004-10-08. Completion date: 2004-11-23.
$17,600, same as above.Signed on 2005-06-24. Completion date: 2005-07-22.
$16,000, same as above.Signed on 2004-10-28. Completion date: 2004-12-13.
$15,000, same as above.Signed on 2006-01-27. Completion date: 2006-02-18.
GRINNELL CORPORATION (167 MILL ST in CRANSTON, RI; small business) : $82,072 in 3 contractsfrom 2004 to 2005
$36,225 with Defense Logistics Agency for Valves, Nonpowered. Signed on 2004-02-09. Completion date: 2004-08-23.
$34,935, same as above.Signed on 2004-03-02. Completion date: 2004-08-17.
$10,912, same as above.Signed on 2005-05-11. Completion date: 2005-06-23.
MARCELLO'S SAUSAGE CO (850 EDDY ST in PROVIDENCE, RI) : $38,293 in 7 contractsfrom 2004 to 2005
Contracts for Food Items For Resale, Meat, Poultry, and Fish by Defense Commissary Agency, Bureau of Prisoners/Federal Prison System Signed by year:2000: $0; 2001: $0; 2002: $0; 2003: $0; 2004: $23,526; 2005: $14,767; 2006: $0.
Biggest contracts:
$16,899 with Defense Commissary Agency for Food Items For Resale. Signed on 2004-10-01. Completion date: 2005-03-31.
$6,627 with Bureau of Prisoners/Federal Prison System for Meat, Poultry, and Fish. Taking place in WA. Signed on 2004-11-02. Completion date: 2004-12-02.
$4,844 with Defense Commissary Agency for Food Items For Resale. Signed on 2005-10-01. Completion date: 2005-12-31.
$3,564, same as above.Signed on 2005-04-01. Completion date: 2005-05-31.
NORTHLAND ENVIRONMENTAL INC (275 ALLENS AVE in PROVIDENCE, RI; small business) : $35,754 in 2 contractsin 2002
$24,367 with Navy for Trash/Garbage Collection Services - Including Portable Sanitation Services. Taking place in NH. Signed on 2002-07-03. Completion date: 2002-09-30.
$11,387 with Navy for Trash/Garbage Collection Services - Including Portable Sanitation Services. Taking place in ME. Signed on 2002-12-02. Completion date: 2003-01-01.
Top industries in this zip code by the number of employees in 2005:
Health Care and Social Assistance: Specialty (except Psychiatric and Substance Abuse) Hospitals (over 1000 employees: 1 establishment)
Health Care and Social Assistance: Offices of Physicians (except Mental Health Specialists) (100-249: 1, 50-99: 1, 20-49: 6, 10-19: 3, 5-9: 9, 1-4: 43)
Health Care and Social Assistance: Child and Youth Services (100-249: 1, 20-49: 1, 10-19: 1)
2004 - 2018 National Fire Incident Reporting System (NFIRS) incidents
According to the data from the years 2004 - 2018 the average number of fire incidents per year is 29. The highest number of fire incidents - 56 took place in 2007, and the least - 0 in 2005. The data has a declining trend.
When looking into fire subcategories, the most reports belonged to: Structure Fires (44.1%), and Outside Fires (36.2%).
Fire incident types reported to NFIRS in Zip Code 02905


 Nearest zip codes: 02907, 02903, 02888, 02910, 02912, 02914.


 According to the data from the years 2004 - 2018 the average number of fire incidents per year is 29. The highest number of fire incidents - 56 took place in 2007, and the least - 0 in 2005. The data has a declining trend.
 When looking into fire subcategories, the most reports belonged to: Structure Fires (44.1%), and Outside Fires (36.2%).