Estimated zip code population in 2022: 42,608 Zip code population in 2010: 43,540 Zip code population in 2000: 40,951
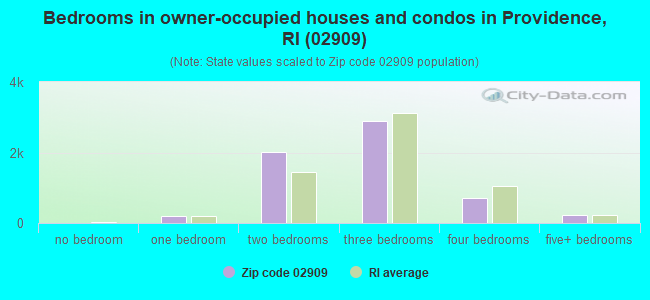
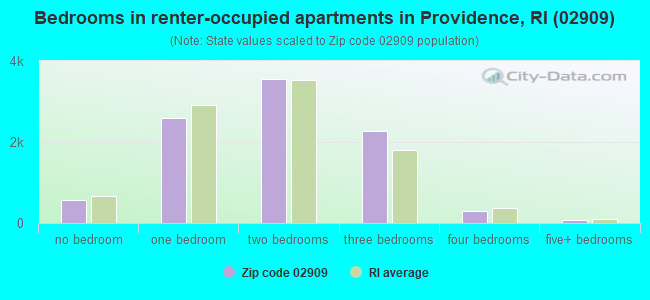
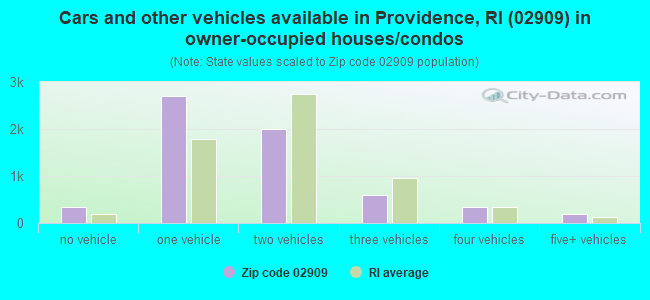
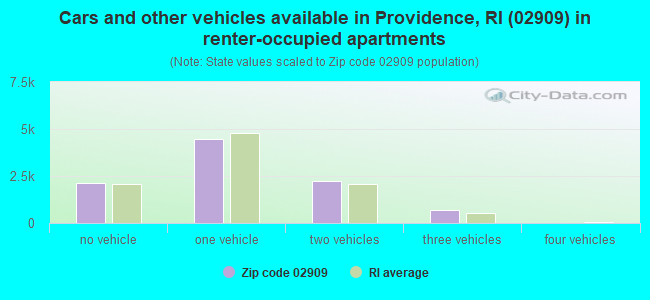
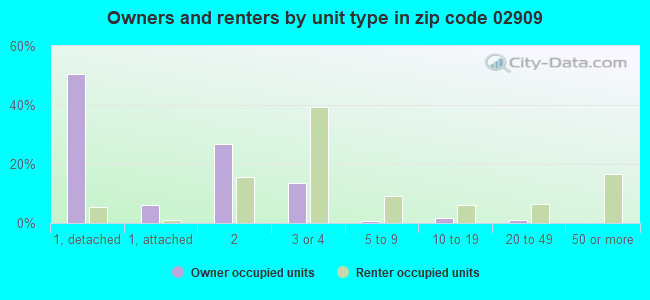
Houses and condos: 18,516 Renter-occupied apartments: 9,460
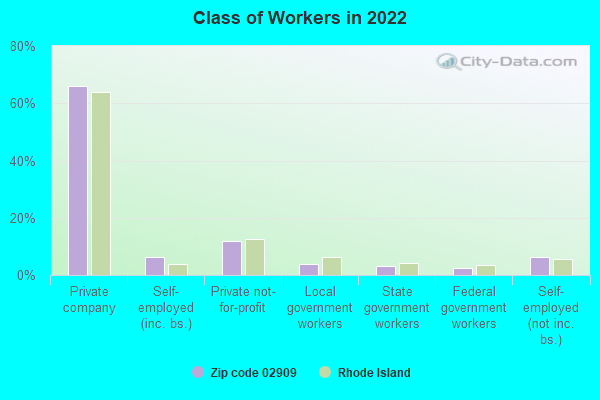
% of renters here:
61%
State:
37%
March 2022 cost of living index in zip code 02909: 90.4 (less than average, U.S. average is 100)
Land area: 3.5 sq. mi. Water area: 0.0 sq. mi.
Population density: 12,323 people per square mile
(very high).
OSM Map
Google Map
MSN Map
OSM Map
General Map
Google Map
MSN Map
OSM Map
Google Map
MSN Map
OSM Map
Google Map
MSN Map
Please wait while loading the map...
Real estate property taxes paid for housing units in 2022:
This zip code:
1.5% ($4,099)
Rhode Island:
1.2% ($4,726)
Median real estate property taxes paid for housing units with mortgages in 2022: $3,935 (1.4%) Median real estate property taxes paid for housing units with no mortgage in 2022: $4,761 (1.7%)
Averages for the 2020 tax year for zip code 02909, filed in 2021:
Average Adjusted Gross Income (AGI) in 2020: $35,748 (Individual Income Tax Returns)
Here:
$35,748
State:
$74,300
Salary/wage: $32,541 (reported on 87.9% of returns)
Here:
$32,541
State:
$60,330
(% of AGI for various income ranges: 1172.1% for AGIs below $25k, 3523.1% for AGIs $25k-50k, 6721.9% for AGIs $50k-75k, 9822.3% for AGIs $75k-100k, 18648.5% for AGIs $100k-200k, 95655.0% for AGIs over 200k)
Taxable interest for individuals: $699 (reported on 9.2% of returns)
This zip code:
$699
Rhode Island:
$1,971
(% of AGI for various income ranges: 2.1% for AGIs below $25k, 3.4% for AGIs $25k-50k, 8.6% for AGIs $50k-75k, 29.9% for AGIs $75k-100k, 64.6% for AGIs $100k-200k, 1880.0% for AGIs over 200k)
Ordinary dividends: $2,559 (reported on 4.5% of returns)
Here:
$2,559
State:
$7,621
(% of AGI for various income ranges: 2.9% for AGIs below $25k, 4.0% for AGIs $25k-50k, 20.9% for AGIs $50k-75k, 45.4% for AGIs $75k-100k, 194.6% for AGIs $100k-200k, 2315.0% for AGIs over 200k)
Net capital gain/loss in AGI: +$8,894 (reported on 4.8% of returns)
Here:
+$8,894
State:
+$26,041
(% of AGI for various income ranges: 4.4% for AGIs below $25k, 9.0% for AGIs $25k-50k, 54.3% for AGIs $50k-75k, 149.6% for AGIs $75k-100k, 552.4% for AGIs $100k-200k, 19585.0% for AGIs over 200k)
Profit/loss from business: +$8,677 (reported on 15.6% of returns)
Here:
+$8,677
State:
+$15,775
(% of AGI for various income ranges: 143.6% for AGIs below $25k, 132.7% for AGIs $25k-50k, 203.3% for AGIs $50k-75k, 345.8% for AGIs $75k-100k, 463.9% for AGIs $100k-200k, 8530.0% for AGIs over 200k)
Taxable individual retirement arrangement distribution: $10,706 (reported on 1.4% of returns)
02909:
$10,706
Rhode Island:
$18,801
(% of AGI for various income ranges: 7.0% for AGIs below $25k, 10.5% for AGIs $25k-50k, 21.5% for AGIs $50k-75k, 71.7% for AGIs $75k-100k, 276.3% for AGIs $100k-200k)
Total itemized deductions: $22,306 (reported on 2.2% of returns)
Here:
$22,306
State:
$29,550
(% of AGI for various income ranges: 5.8% for AGIs below $25k, 30.1% for AGIs $25k-50k, 99.1% for AGIs $50k-75k, 222.3% for AGIs $75k-100k, 811.7% for AGIs $100k-200k, 7355.0% for AGIs over 200k)
Charity contributions: $7,169 (reported on 1.5% of returns)
Here:
$7,169
State:
$7,826
(% of AGI for various income ranges: 5.8% for AGIs $25k-50k, 19.5% for AGIs $50k-75k, 40.0% for AGIs $75k-100k, 173.2% for AGIs $100k-200k, 2470.0% for AGIs over 200k)
Taxes paid: $7,092 (reported on 2.2% of returns)
02909:
$7,092
State:
$8,398
(% of AGI for various income ranges: 1.4% for AGIs below $25k, 9.5% for AGIs $25k-50k, 30.0% for AGIs $50k-75k, 85.1% for AGIs $75k-100k, 302.4% for AGIs $100k-200k, 1245.0% for AGIs over 200k)
Earned income credit: $2,451 (reported on 28.6% of returns)
Here:
$2,451
State:
$2,059
(% of AGI for various income ranges: 126.2% for AGIs below $25k, 93.1% for AGIs $25k-50k, 1.4% for AGIs $50k-75k)
Percentage of individuals using paid preparers for their 2020 taxes: 94.7%
Here:
95%
State:
94%
(% for various income ranges: 93.6% for AGIs below $25k, 95.6% for AGIs $25k-50k, 96.4% for AGIs $50k-75k, 94.9% for AGIs $75k-100k, 93.1% for AGIs $100k-200k, 100.0% for AGIs over 200k)
Averages for the 2012 tax year for zip code 02909, filed in 2013:
Average Adjusted Gross Income (AGI) in 2012: $26,806 (Individual Income Tax Returns)
Here:
$26,806
State:
$60,628
Salary/wage: $26,085 (reported on 88.4% of returns)
Here:
$26,085
State:
$50,029
(% of AGI for various income ranges: 80.3% for AGIs below $25k, 92.5% for AGIs $25k-50k, 88.9% for AGIs $50k-75k, 87.5% for AGIs $75k-100k, 80.6% for AGIs $100k-200k, 52.1% for AGIs over 200k)
Taxable interest for individuals: $635 (reported on 11.1% of returns)
This zip code:
$635
Rhode Island:
$1,640
(% of AGI for various income ranges: 0.3% for AGIs below $25k, 0.2% for AGIs $25k-50k, 0.3% for AGIs $50k-75k, 0.1% for AGIs $75k-100k, 0.8% for AGIs $100k-200k, 0.3% for AGIs over 200k)
Ordinary dividends: $3,601 (reported on 4.1% of returns)
Here:
$3,601
State:
$6,396
(% of AGI for various income ranges: 0.2% for AGIs below $25k, 0.2% for AGIs $25k-50k, 0.5% for AGIs $50k-75k, 0.1% for AGIs $75k-100k, 4.1% for AGIs $100k-200k)
Net capital gain/loss in AGI: +$2,737 (reported on 2.8% of returns)
Here:
+$2,737
State:
+$15,680
(% of AGI for various income ranges: 0.3% for AGIs $50k-75k, 0.3% for AGIs $75k-100k, 2.4% for AGIs $100k-200k)
Profit/loss from business: +$9,572 (reported on 14.4% of returns)
Here:
+$9,572
State:
+$15,678
(% of AGI for various income ranges: 12.2% for AGIs below $25k, 2.5% for AGIs $25k-50k, 2.0% for AGIs $50k-75k, 1.2% for AGIs $75k-100k, 3.1% for AGIs $100k-200k)
Taxable individual retirement arrangement distribution: $8,916 (reported on 2.0% of returns)
02909:
$8,916
Rhode Island:
$14,081
(% of AGI for various income ranges: 0.4% for AGIs below $25k, 0.4% for AGIs $25k-50k, 0.9% for AGIs $50k-75k, 1.4% for AGIs $75k-100k, 1.9% for AGIs $100k-200k)
Total itemized deductions: $15,834 (26% of AGI, reported on 11.4% of returns)
Here:
$15,834
State:
$24,445
Here:
26.2% of AGI
State:
20.5% of AGI
(% of AGI for various income ranges: 2.4% for AGIs below $25k, 6.0% for AGIs $25k-50k, 9.7% for AGIs $50k-75k, 12.3% for AGIs $75k-100k, 11.9% for AGIs $100k-200k, 12.7% for AGIs over 200k)
Charity contributions: $1,963 (reported on 7.8% of returns)
Here:
$1,963
State:
$2,961
(% of AGI for various income ranges: 0.1% for AGIs below $25k, 0.5% for AGIs $25k-50k, 0.9% for AGIs $50k-75k, 1.1% for AGIs $75k-100k, 1.0% for AGIs $100k-200k, 2.0% for AGIs over 200k)
Taxes paid: $5,425 (reported on 11.3% of returns)
02909:
$5,425
State:
$11,235
(% of AGI for various income ranges: 0.6% for AGIs below $25k, 1.6% for AGIs $25k-50k, 3.4% for AGIs $50k-75k, 4.7% for AGIs $75k-100k, 5.4% for AGIs $100k-200k, 6.3% for AGIs over 200k)
Earned income credit: $2,652 (reported on 37.6% of returns)
Here:
$2,652
State:
$2,170
(% of AGI for various income ranges: 10.7% for AGIs below $25k, 1.7% for AGIs $25k-50k)
Percentage of individuals using paid preparers for their 2012 taxes: 69.9%
Here:
70%
State:
60%
(% for various income ranges: 71.0% for AGIs below $25k, 69.1% for AGIs $25k-50k, 65.4% for AGIs $50k-75k, 65.2% for AGIs $75k-100k, 68.8% for AGIs $100k-200k, 66.7% for AGIs over 200k)
Averages for the 2004 tax year for zip code 02909, filed in 2005:
Average Adjusted Gross Income (AGI) in 2004: $24,496 (Individual Income Tax Returns)
Here:
$24,496
State:
$51,090
Salary/wage: $23,716 (reported on 90.9% of returns)
Here:
$23,716
State:
$43,690
(% of AGI for various income ranges: 92.1% for AGIs below $10k, 89.7% for AGIs $10k-25k, 93.7% for AGIs $25k-50k, 89.3% for AGIs $50k-75k, 86.2% for AGIs $75k-100k, 54.0% for AGIs over 100k)
Taxable interest for individuals: $863 (reported on 22.5% of returns)
This zip code:
$863
Rhode Island:
$1,567
(% of AGI for various income ranges: 1.7% for AGIs below $10k, 0.6% for AGIs $10k-25k, 0.5% for AGIs $25k-50k, 0.8% for AGIs $50k-75k, 0.6% for AGIs $75k-100k, 2.4% for AGIs over 100k)
Taxable dividends: $1,396 (reported on 6.0% of returns)
Here:
$1,396
State:
$3,896
(% of AGI for various income ranges: 0.5% for AGIs below $10k, 0.2% for AGIs $10k-25k, 0.2% for AGIs $25k-50k, 0.4% for AGIs $50k-75k, 0.2% for AGIs $75k-100k, 1.5% for AGIs over 100k)
Net capital gain/loss: +$9,168 (reported on 4.7% of returns)
Here:
+$9,168
State:
+$15,829
(% of AGI for various income ranges: -0.1% for AGIs below $10k, 0.1% for AGIs $10k-25k, 0.4% for AGIs $25k-50k, 1.2% for AGIs $50k-75k, 2.3% for AGIs $75k-100k, 14.4% for AGIs over 100k)
Profit/loss from business: +$9,345 (reported on 11.0% of returns)
Here:
+$9,345
State:
+$15,557
(% of AGI for various income ranges: 13.2% for AGIs below $10k, 5.9% for AGIs $10k-25k, 2.8% for AGIs $25k-50k, 1.8% for AGIs $50k-75k, 2.7% for AGIs $75k-100k, 5.4% for AGIs over 100k)
IRA payment deduction: $2,130 (reported on 1.0% of returns)
02909:
$2,130
Rhode Island:
$3,092
(% of AGI for various income ranges: 0.1% for AGIs $10k-25k, 0.1% for AGIs $25k-50k, 0.1% for AGIs $50k-75k, 0.2% for AGIs $75k-100k)
Self-employed pension: $7,769 (reported on 0.1% of returns)
Here:
$7,769
Rhode Island:
$14,597
Total itemized deductions: $14,211 (28% of AGI, reported on 15.1% of returns)
Here:
$14,211
State:
$20,228
Here:
28.2% of AGI
State:
21.1% of AGI
(% of AGI for various income ranges: 4.3% for AGIs below $10k, 4.5% for AGIs $10k-25k, 8.8% for AGIs $25k-50k, 12.8% for AGIs $50k-75k, 15.1% for AGIs $75k-100k, 12.4% for AGIs over 100k)
Charity contributions deductions: $1,740 (3% of AGI, reported on 11.6% of returns)
Here:
$1,740
State:
$2,620
Here:
3.1% of AGI
State:
2.6% of AGI
(% of AGI for various income ranges: 0.2% for AGIs below $10k, 0.3% for AGIs $10k-25k, 0.8% for AGIs $25k-50k, 1.4% for AGIs $50k-75k, 1.7% for AGIs $75k-100k, 1.2% for AGIs over 100k)
Total tax: $2,826 (reported on 58.4% of returns)
02909:
$2,826
State:
$8,437
(% of AGI for various income ranges: 2.8% for AGIs below $10k, 3.3% for AGIs $10k-25k, 6.1% for AGIs $25k-50k, 9.0% for AGIs $50k-75k, 11.1% for AGIs $75k-100k, 15.1% for AGIs over 100k)
Earned income credit: $1,980 (reported on 35.1% of returns)
Here:
$1,980
State:
$1,659
Percentage of individuals using paid preparers for their 2004 taxes: 74.2%
Here:
74%
State:
63%
(% for various income ranges: 72.5% for AGIs below $10k, 78.3% for AGIs $10k-25k, 70.8% for AGIs $25k-50k, 69.0% for AGIs $50k-75k, 72.5% for AGIs $75k-100k, 77.1% for AGIs over 100k)
Likely homosexual households (counted as self-reported same-sex unmarried-partner households)
Lesbian couples: 0.7% of all households
Gay men: 0.3% of all households
Household received Food Stamps/SNAP in the past 12 months: 4,670 Household did not receive Food Stamps/SNAP in the past 12 months: 10,813
Women who had a birth in the past 12 months: 492 (342 now married, 150 unmarried) Women who did not have a birth in the past 12 months: 11,572 (3,249 now married, 8,295 unmarried)
Housing units in zip code 02909 with a mortgage: 4,521 (312 second mortgage, 257 both second mortgage and home equity loan) Houses without a mortgage: 165
Median monthly owner costs for units with a mortgage: $1,683 Median monthly owner costs for units without a mortgage: $825
Residents with income below the poverty level in 2022:
This zip code:
22.9%
Whole state:
10.8%
Residents with income below 50% of the poverty level in 2022:
This zip code:
12.3%
Whole state:
5.6%
Median number of rooms in houses and condos:
Here:
5.4
State:
6.2
Median number of rooms in apartments:
Here:
4.2
State:
4.1
Notable locations in this zip code not listed on our city pages
Notable locations in zip code 02909: Broadway-Armory Historic District (A), Olneyville Branch Providence Public Library (B), Providence Fire Department Hartford Avenue Station (C), Providence Fire Department Messer Street Station (D), Providence Fire Department Atwells Avenue Station (E), Silver Lake Community Center (F), Olneyville Center (G), Nickerson Community Center (H), Federal Hill House Association Early Learning Center (I). Display/hide their locations on the map
Churches in zip code 02909 include: Shalom Ministries (A), Armenian Apostolic Vartanantz Church (B), Franciscan Convent (C), Saint Bartholomews Church (D), Armenian Apostolic STS Church (E), Saint Anthonys Church (F), Marantha Tabernacle Church (G), Kingdom Hall of Jehovahs Witnesses (H), United Pentecostal Church (I). Display/hide their locations on the map
Parks in zip code 02909 include: DePasquale Plaza (1), Neutaconkanut Hill Park (2), Ebenezer Knight Dexter Statue (3), Trigg Memorial Park (4), Merino Park (5), Lonigan Memorial Park (6), Conlan Junior Memorial Park (7), Forys Playground (8). Display/hide their locations on the map
4,969 married couples with children.
5,024 single-parent households (1,822 men, 3,202 women).
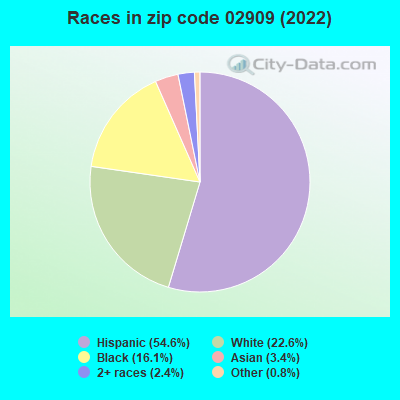
46.2% of residents of 02909 zip code speak English at home.
46.6% of residents speak Spanish at home (42% very well, 26% well, 21% not well, 11% not at all).
2.5% of residents speak other Indo-European language at home (77% very well, 18% well, 5% not well).
2.7% of residents speak Asian or Pacific Island language at home (66% very well, 24% well, 10% not well, 1% not at all).
2.8% of residents speak other language at home (76% very well, 11% well, 13% not well).
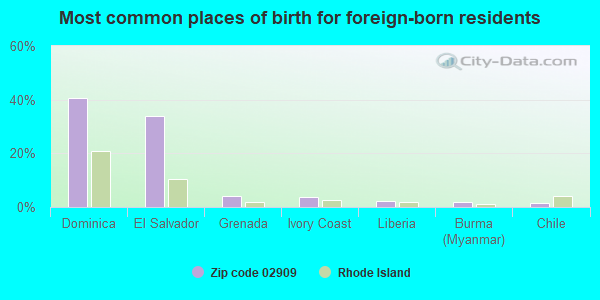
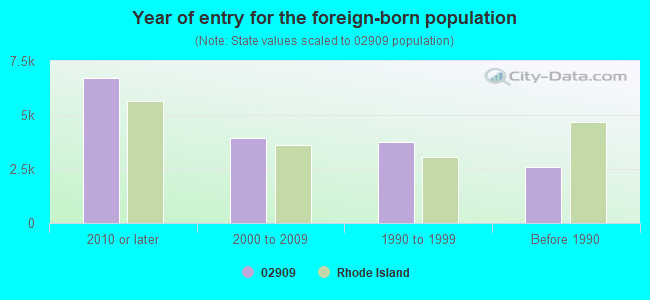
Foreign born population: 14,077 (33.0%) (41.8% of them are naturalized citizens)
Major facilities with environmental interests located in this zip code:
MARINUCCI PETER (178 WALLACE ST in PROVIDENCE, RI)
(Integrated Compliance Information System) - ICIS-01-2006-7006, ENFORCEMENT/COMPLIANCE ACTIVITY FORMAL ENFORCEMENT ACTION (Integrated Compliance Information System) - ICIS-01-2006-7006, ENFORCEMENT/COMPLIANCE ACTIVITY
ANTONELLI PLATING CO (50 VALLEY ST. in PROVIDENCE, RI)
AIR MINOR (AIRS/AFS) COMPLIANCE ACTIVITY (Tracking inspections of insecticide, fungicide, and rodenticide, and toxic substances) CRITERIA AND HAZARDOUS AIR POLLUTANT INVENTORY (Inventory of air pollution sources) National Pollutant Discharge Elimination System NON-MAJOR (Tracking pollutant discharge elimination systems) - permit Small Quantity Generators, between 100 kg and 1000 kg of hazardous waste/month (Resource Conservation and Recovery Act (tracking hazardous waste)) - notification TRI REPORTER (Tracking of toxic chemicals releasing facilities) Business SIC classification: ELECTROPLATING, PLATING, POLISHING, ANODIZING, AND COLORING Organizations: CHRISTOPHE C ANTONELL (CONTACT/OWNER)
CATHEDRAL ART METAL CO. INC. (25 MANTON AVENUE in PROVIDENCE, RI)
AIR MINOR (AIRS/AFS) CRITERIA AND HAZARDOUS AIR POLLUTANT INVENTORY (Inventory of air pollution sources) HAZARDOUS WASTE BIENNIAL REPORTER (Resource Conservation and Recovery Act (tracking hazardous waste)) Small Quantity Generators, between 100 kg and 1000 kg of hazardous waste/month (Resource Conservation and Recovery Act (tracking hazardous waste)) TRI REPORTER (Tracking of toxic chemicals releasing facilities) Business SIC classification: METAL STAMPINGS; JEWELRY, PRECIOUS METAL; COSTUME JEWELRY AND COSTUME NOVELTIES, EXCEPT PRECIOUS METAL Business NAICS classification: ALL OTHER MISCELLANEOUS MANUFACTURING. Organizations: WILLIAM TRACEY (CONTACT/OPERATOR)
, CATHEDRAL ART METAL CO., INC. (CONTACT/OWNER)
Alternative names: IMPERIAL PEARL
LAUREL HILL AVENUE SCHOOL (85 LAUREL HILL AVENUE in PROVIDENCE, RI)
(Geographic Names Information System) (National Center for Education Statistics) - STATE ID-28134 Organizations: PROVIDENCE SCH DIST (SCHOOL DISTRICT)
LAUREL HILL ANNEX (240 LABAN STREET in PROVIDENCE, RI)
(Geographic Names Information System) (National Center for Education Statistics) - STATE ID-28106 Organizations: PROVIDENCE SCH DIST (SCHOOL DISTRICT)
ARCONIUM SPECIALTY ALLOYS (400 HARRIS AVENUE in PROVIDENCE, RI)
AIR MINOR (AIRS/AFS) (Resource Conservation and Recovery Act (tracking hazardous waste)) TRI REPORTER (Tracking of toxic chemicals releasing facilities) Business SIC classification: INDUSTRIAL INORGANIC CHEMICALS; SECONDARY SMELTING AND REFINING OF NONFERROUS METALS; ROLLING, DRAWING, AND EXTRUDING OF NONFERROUS METALS, EXCEPT COPPER AND ALUMINUM Business NAICS classification: OTHER COMMUNICATION AND ENERGY WIRE MANUFACTURING. Organizations: OPERNAME (CONTACT/OPERATOR)
, ALPHA METALS INC (CONTACT/OWNER)
ASA MESSER ANNEX (245 ALTHEA STREET in PROVIDENCE, RI)
(Geographic Names Information System) (National Center for Education Statistics) - STATE ID-28159 Organizations: PROVIDENCE SCH DIST (SCHOOL DISTRICT)
ASA MESSER SCHOOL (158 MESSER STREET in PROVIDENCE, RI)
(Geographic Names Information System) (National Center for Education Statistics) - STATE ID-28115 Organizations: PROVIDENCE SCH DIST (SCHOOL DISTRICT)
GENERAL ELECTRIC PROVIDENCE BASE PLANT (586 ATWELLS AVE. in PROVIDENCE, RI)
AIR MINOR (AIRS/AFS) CRITERIA AND HAZARDOUS AIR POLLUTANT INVENTORY (Inventory of air pollution sources) HAZARDOUS WASTE BIENNIAL REPORTER (Resource Conservation and Recovery Act (tracking hazardous waste)) (Resource Conservation and Recovery Act (tracking hazardous waste)) TRI REPORTER (Tracking of toxic chemicals releasing facilities) Business SIC classification: RESIDENTIAL ELECTRIC LIGHTING FIXTURES; ELECTRICAL MACHINERY, EQUIPMENT, AND SUPPLIES Alternative names: G.E. PROVIDENCE BASE PLANT, GENERAL ELECTRIC PROVIDENCE PLT
PLEASANT VIEW SCHOOL (50 OBADIAH BROWN ROAD in PROVIDENCE, RI)
(Geographic Names Information System) (National Center for Education Statistics) - STATE ID-28165 Organizations: PROVIDENCE SCH DIST (SCHOOL DISTRICT)
ANTHONY CARNEVALE ELEMENTARY (50 SPRINGFIELD STREET in PROVIDENCE, RI)
(National Center for Education Statistics) - STATE ID-28181 Organizations: PROVIDENCE SCH DIST (SCHOOL DISTRICT)
POLISHING HOUSE INC THE (100 MANTON AVE in PROVIDENCE, RI)
(Resource Conservation and Recovery Act (tracking hazardous waste)) Organizations: RESNIK REALTY (CONTACT/OWNER)
, THE POLISHING HOUSE (CONTACT/OWNER)
PERRY MIDDLE SCHOOL (370 HARTFORD AVENUE in PROVIDENCE, RI)
(National Center for Education Statistics) - STATE ID-28146 Organizations: PROVIDENCE SCH DIST (SCHOOL DISTRICT)
Housing units lacking complete plumbing facilities: 1.0% Housing units lacking complete kitchen facilities: 3.6%
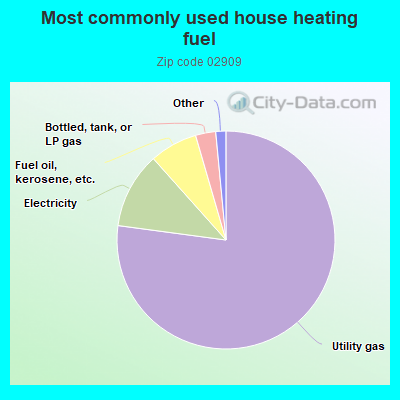
77.2%Utility gas
11.3%Electricity
7.1%Fuel oil, kerosene, etc.
3.0%Bottled, tank, or LP gas
0.7%No fuel used
0.5%Other fuel
Population in 1990: 34,261. Population change in the 1990s: +6,690 (+19.5%).
Place of birth for U.S.-born residents:
This state: 17,547
Northeast: 5,585
Midwest: 659
South: 1,165
West: 941
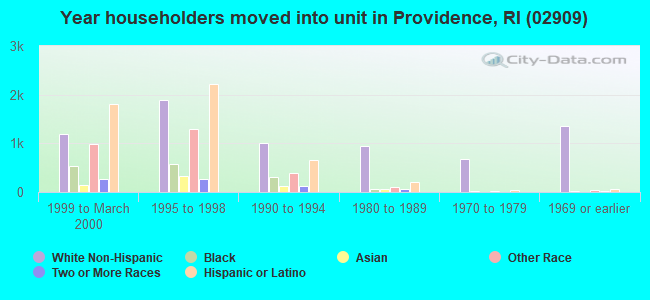
47% of the 02909 zip code residents lived in the same house 5 years ago. Out of people who lived in different houses, 78% lived in this county. Out of people who lived in different counties, 50% lived in Rhode Island.
92% of the 02909 zip code residents lived in the same house 1 year ago. Out of people who lived in different houses, 53% moved from this county. Out of people who lived in different houses, 8% moved from different county within same state. Out of people who lived in different houses, 38% moved from different state. Out of people who lived in different houses, 3% moved from abroad.
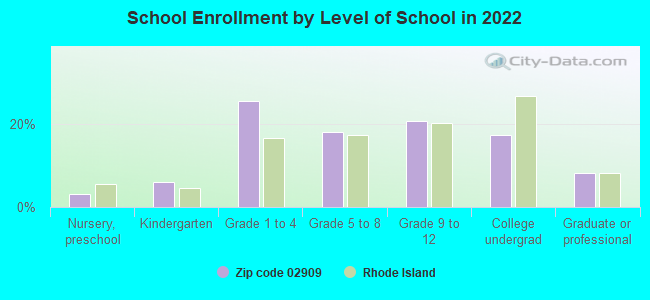
Private vs. public school enrollment:
Students in private schools in grades 1 to 8 (elementary and middle school): 457
Here:
8.8%
Rhode Island:
12.2%
Students in private schools in grades 9 to 12 (high school): 296
Here:
12.2%
Rhode Island:
11.6%
Students in private undergraduate colleges: 728
Here:
35.3%
Rhode Island:
41.1%
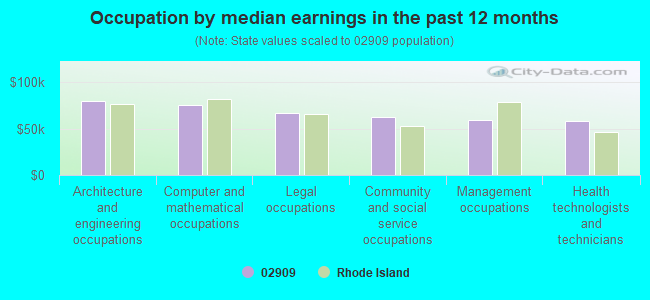
Occupation by median earnings in the past 12 months ($)
79,531Architecture and engineering occupations
74,934Computer and mathematical occupations
66,720Legal occupations
62,946Community and social service occupations
58,794Management occupations
58,496Health technologists and technicians
Companies with federal contracts located in this zip code (PROVIDENCE, RI):
SPECIALTY PRODUCE CORPORATION (136 SILVER LAKE AVE; small business) : $95,056 in 21 contractsfrom 2005 to 2006
Contracts for Fruits and Vegetables by Defense Logistics Agency Signed by year:2000: $0; 2001: $0; 2002: $0; 2003: $0; 2004: $0; 2005: $62,793; 2006: $32,263.
Biggest contracts:
$6,628 with Defense Logistics Agency for Fruits and Vegetables. Signed on 2005-12-02. Completion date: 2005-12-02.
$6,244, same as above.Signed on 2005-09-13. Completion date: 2005-09-13.
$6,006, same as above.Signed on 2005-12-30. Completion date: 2005-12-30.
$5,867, same as above.Signed on 2006-01-17. Completion date: 2006-01-17.
QUALITY TOUCH CONSTRUCTION (230 MAGNOLIA ST; small business)
$35,550 with Army for Hose, Pipe, Tube, Lubrication, and Railing Fittings. Taking place in VA. Signed on 2000-05-26. Completion date: 2000-07-11.
GRECO BROS INC (1 GRECO LN; small business) : $34,065 in 2 contractsfrom 2001 to 2005
$29,250 with Air Force for Aircraft Maintenance and Repair Shop Specialized Equipment. Signed on 2001-06-19. Completion date: 2001-09-07.
$4,815 with Navy for Miscellaneous Secondary Metal Forming and Cutting Machines. Signed on 2005-03-31. Completion date: 2005-05-04.
CUSTOM MOLDED PRODUCTS INC (136 SILVER LAKE AVE; small business)
$3,750 with Army for Packing and Gasket Materials. Signed on 2004-05-25. Completion date: 2004-10-25.
UNIVERSAL SPECIALTY AWARDS (1205 WESTMINSTER ST; small business) : $3,308 in 9 contractsfrom 2003 to 2006
Contracts for Miscellaneous Service and Trade Equipment, Miscellaneous Items, Badges and Insignia, Jewelry, and moreby Army Signed by year:2000: $0; 2001: $0; 2002: $0; 2003: -$25,835; 2004: $7,480; 2005: $19,174; 2006: $2,489.
Biggest contracts:
$8,060 with Army for Miscellaneous Service and Trade Equipment. Signed on 2005-06-15. Completion date: 2005-08-05.
$4,280 with Army for Miscellaneous Items. Taking place in TX. Signed on 2004-10-08. Completion date: 2004-12-01.
$3,594 with Army for Badges and Insignia. Taking place in UT. Signed on 2005-09-20. Completion date: 2005-10-24.
$3,200 with Army for Jewelry. Signed on 2004-12-20. Completion date: 2005-01-20.
CAPITAL RECORDS MANAGEMENT INC (431 HARRIS AVE; small business)
$2,510 with Navy for Other Administrative Support Services. Signed on 2004-10-01. Completion date: 2005-09-30.
Top industries in this zip code by the number of employees in 2005:
Administrative and Support and Waste Management and Remediation Services: Temporary Help Services (250-499 employees: 2 establishments, 50-99 employees: 2 establishments, 20-49 employees: 1 establishment)
Administrative and Support and Waste Management and Remediation Services: Employment Placement Agencies (250-499: 1)
2004 - 2018 National Fire Incident Reporting System (NFIRS) incidents
According to the data from the years 2004 - 2018 the average number of fire incidents per year is 34. The highest number of fire incidents - 72 took place in 2004, and the least - 0 in 2005. The data has a declining trend.
When looking into fire subcategories, the most reports belonged to: Structure Fires (50.8%), and Outside Fires (30.4%).
Fire incident types reported to NFIRS in Zip Code 02909


 Nearest zip codes: 02908, 02907, 02911, 02904, 02903, 02910.
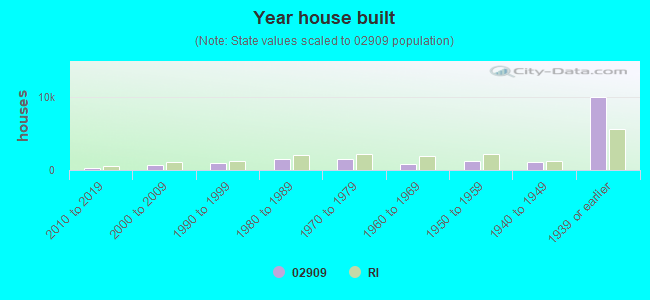


 According to the data from the years 2004 - 2018 the average number of fire incidents per year is 34. The highest number of fire incidents - 72 took place in 2004, and the least - 0 in 2005. The data has a declining trend.
 When looking into fire subcategories, the most reports belonged to: Structure Fires (50.8%), and Outside Fires (30.4%).