Estimated zip code population in 2022: 15,858 Zip code population in 2010: 15,574 Zip code population in 2000: 14,307
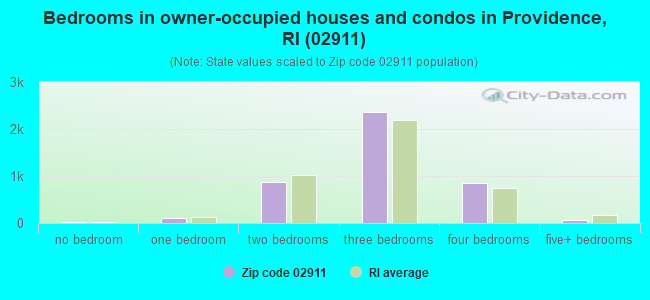
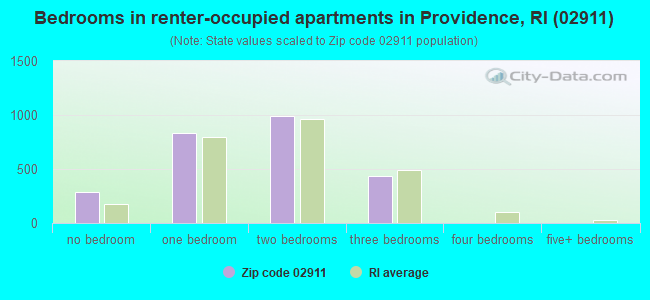
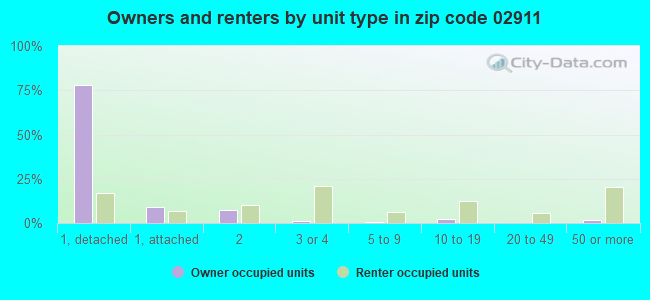
Houses and condos: 6,963 Renter-occupied apartments: 2,552
% of renters here:
37%
State:
37%
March 2022 cost of living index in zip code 02911: 90.3 (less than average, U.S. average is 100)
Land area: 2.5 sq. mi. Water area: 0.0 sq. mi.
Population density: 6,391 people per square mile
(high).
OSM Map
Google Map
MSN Map
OSM Map
General Map
Google Map
MSN Map
OSM Map
Google Map
MSN Map
OSM Map
Google Map
MSN Map
Please wait while loading the map...
Real estate property taxes paid for housing units in 2022:
This zip code:
1.5% ($5,123)
Rhode Island:
1.2% ($4,726)
Median real estate property taxes paid for housing units with mortgages in 2022: $5,135 (1.6%) Median real estate property taxes paid for housing units with no mortgage in 2022: $5,008 (1.4%)
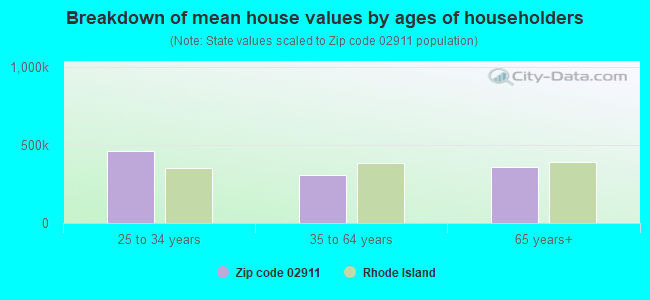
Estimated median house/condo value in 2022: $335,003
02911:
$335,003
Rhode Island:
$383,900
According to our research of Rhode Island and other state lists, there were 10 registered sex offenders living in 02911 zip code as of April 26, 2024. The ratio of all residents to sex offenders in zip code 02911 is 1,606 to 1. The ratio of registered sex offenders to all residents in this zip code is lower than the state average.
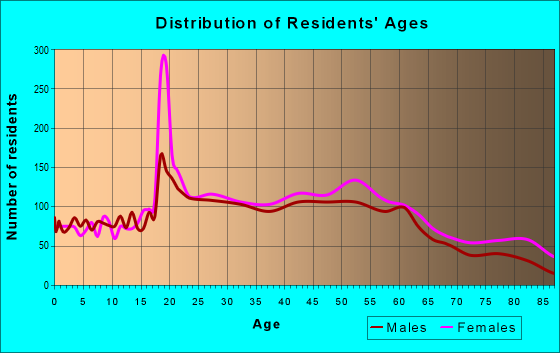
Median resident age:
This zip code:
38.7 years
Rhode Island median age:
40.7 years
Average household size:
This zip code:
2.3 people
Rhode Island:
2.4 people
Averages for the 2020 tax year for zip code 02911, filed in 2021:
Average Adjusted Gross Income (AGI) in 2020: $59,378 (Individual Income Tax Returns)
Here:
$59,378
State:
$74,300
Salary/wage: $52,456 (reported on 84.3% of returns)
Here:
$52,456
State:
$60,330
(% of AGI for various income ranges: 1066.1% for AGIs below $25k, 3574.9% for AGIs $25k-50k, 6456.6% for AGIs $50k-75k, 9501.1% for AGIs $75k-100k, 17806.0% for AGIs $100k-200k, 63178.0% for AGIs over 200k)
Taxable interest for individuals: $956 (reported on 25.4% of returns)
This zip code:
$956
Rhode Island:
$1,971
(% of AGI for various income ranges: 16.3% for AGIs below $25k, 11.4% for AGIs $25k-50k, 25.3% for AGIs $50k-75k, 41.4% for AGIs $75k-100k, 105.1% for AGIs $100k-200k, 548.0% for AGIs over 200k)
Ordinary dividends: $2,866 (reported on 14.0% of returns)
Here:
$2,866
State:
$7,621
(% of AGI for various income ranges: 15.5% for AGIs below $25k, 14.1% for AGIs $25k-50k, 35.2% for AGIs $50k-75k, 73.8% for AGIs $75k-100k, 153.4% for AGIs $100k-200k, 1858.0% for AGIs over 200k)
Net capital gain/loss in AGI: +$11,289 (reported on 12.6% of returns)
Here:
+$11,289
State:
+$26,041
(% of AGI for various income ranges: 5.3% for AGIs below $25k, 20.9% for AGIs $25k-50k, 45.6% for AGIs $50k-75k, 112.2% for AGIs $75k-100k, 414.5% for AGIs $100k-200k, 15094.0% for AGIs over 200k)
Profit/loss from business: +$10,567 (reported on 12.2% of returns)
Here:
+$10,567
State:
+$15,775
(% of AGI for various income ranges: 83.2% for AGIs below $25k, 120.3% for AGIs $25k-50k, 148.2% for AGIs $50k-75k, 182.5% for AGIs $75k-100k, 446.2% for AGIs $100k-200k, 2672.0% for AGIs over 200k)
Taxable individual retirement arrangement distribution: $12,328 (reported on 7.4% of returns)
02911:
$12,328
Rhode Island:
$18,801
(% of AGI for various income ranges: 59.4% for AGIs below $25k, 63.2% for AGIs $25k-50k, 113.2% for AGIs $50k-75k, 204.9% for AGIs $75k-100k, 415.5% for AGIs $100k-200k)
Total itemized deductions: $22,180 (reported on 8.0% of returns)
Here:
$22,180
State:
$29,550
(% of AGI for various income ranges: 23.4% for AGIs below $25k, 95.4% for AGIs $25k-50k, 308.1% for AGIs $50k-75k, 475.1% for AGIs $75k-100k, 693.7% for AGIs $100k-200k, 2766.0% for AGIs over 200k)
Charity contributions: $4,716 (reported on 5.9% of returns)
Here:
$4,716
State:
$7,826
(% of AGI for various income ranges: 11.7% for AGIs $25k-50k, 35.5% for AGIs $50k-75k, 53.0% for AGIs $75k-100k, 141.1% for AGIs $100k-200k, 798.0% for AGIs over 200k)
Taxes paid: $8,062 (reported on 8.0% of returns)
02911:
$8,062
State:
$8,398
(% of AGI for various income ranges: 6.1% for AGIs below $25k, 27.3% for AGIs $25k-50k, 113.2% for AGIs $50k-75k, 192.9% for AGIs $75k-100k, 266.4% for AGIs $100k-200k, 868.0% for AGIs over 200k)
Earned income credit: $1,921 (reported on 12.6% of returns)
Here:
$1,921
State:
$2,059
(% of AGI for various income ranges: 67.3% for AGIs below $25k, 49.5% for AGIs $25k-50k)
Percentage of individuals using paid preparers for their 2020 taxes: 93.3%
Here:
93%
State:
94%
(% for various income ranges: 92.6% for AGIs below $25k, 93.5% for AGIs $25k-50k, 93.8% for AGIs $50k-75k, 93.3% for AGIs $75k-100k, 93.5% for AGIs $100k-200k, 94.1% for AGIs over 200k)
Averages for the 2012 tax year for zip code 02911, filed in 2013:
Average Adjusted Gross Income (AGI) in 2012: $48,786 (Individual Income Tax Returns)
Here:
$48,786
State:
$60,628
Salary/wage: $44,584 (reported on 85.9% of returns)
Here:
$44,584
State:
$50,029
(% of AGI for various income ranges: 73.6% for AGIs below $25k, 81.6% for AGIs $25k-50k, 79.6% for AGIs $50k-75k, 80.8% for AGIs $75k-100k, 79.4% for AGIs $100k-200k, 60.9% for AGIs over 200k)
Taxable interest for individuals: $908 (reported on 34.1% of returns)
This zip code:
$908
Rhode Island:
$1,640
(% of AGI for various income ranges: 1.2% for AGIs below $25k, 0.6% for AGIs $25k-50k, 0.5% for AGIs $50k-75k, 0.4% for AGIs $75k-100k, 0.6% for AGIs $100k-200k, 1.1% for AGIs over 200k)
Ordinary dividends: $1,996 (reported on 16.5% of returns)
Here:
$1,996
State:
$6,396
(% of AGI for various income ranges: 1.3% for AGIs below $25k, 0.4% for AGIs $25k-50k, 0.7% for AGIs $50k-75k, 0.6% for AGIs $75k-100k, 0.6% for AGIs $100k-200k, 1.0% for AGIs over 200k)
Net capital gain/loss in AGI: +$1,663 (reported on 11.3% of returns)
Here:
+$1,663
State:
+$15,680
(% of AGI for various income ranges: 0.2% for AGIs $25k-50k, 0.1% for AGIs $50k-75k, 0.6% for AGIs $75k-100k, 0.8% for AGIs $100k-200k, 0.8% for AGIs over 200k)
Profit/loss from business: +$9,588 (reported on 11.5% of returns)
Here:
+$9,588
State:
+$15,678
(% of AGI for various income ranges: 7.0% for AGIs below $25k, 2.1% for AGIs $25k-50k, 1.9% for AGIs $50k-75k, 1.4% for AGIs $75k-100k, 2.2% for AGIs $100k-200k)
Taxable individual retirement arrangement distribution: $9,729 (reported on 8.9% of returns)
02911:
$9,729
Rhode Island:
$14,081
(% of AGI for various income ranges: 3.0% for AGIs below $25k, 1.5% for AGIs $25k-50k, 1.9% for AGIs $50k-75k, 1.2% for AGIs $75k-100k, 2.3% for AGIs $100k-200k)
Self-employment retirement plans: $11,950 (reported on 0.3% of returns)
02911:
$11,950
Rhode Island:
$18,642
Total itemized deductions: $18,403 (22% of AGI, reported on 35.5% of returns)
Here:
$18,403
State:
$24,445
Here:
22.5% of AGI
State:
20.5% of AGI
(% of AGI for various income ranges: 8.9% for AGIs below $25k, 10.9% for AGIs $25k-50k, 13.9% for AGIs $50k-75k, 15.4% for AGIs $75k-100k, 15.2% for AGIs $100k-200k, 13.3% for AGIs over 200k)
Charity contributions: $1,748 (reported on 29.3% of returns)
Here:
$1,748
State:
$2,961
(% of AGI for various income ranges: 0.5% for AGIs below $25k, 0.7% for AGIs $25k-50k, 1.1% for AGIs $50k-75k, 1.1% for AGIs $75k-100k, 1.4% for AGIs $100k-200k, 1.2% for AGIs over 200k)
Taxes paid: $8,245 (reported on 35.5% of returns)
02911:
$8,245
State:
$11,235
(% of AGI for various income ranges: 2.9% for AGIs below $25k, 3.9% for AGIs $25k-50k, 5.8% for AGIs $50k-75k, 6.9% for AGIs $75k-100k, 7.7% for AGIs $100k-200k, 7.9% for AGIs over 200k)
Earned income credit: $1,971 (reported on 14.7% of returns)
Here:
$1,971
State:
$2,170
(% of AGI for various income ranges: 4.8% for AGIs below $25k, 0.7% for AGIs $25k-50k)
Percentage of individuals using paid preparers for their 2012 taxes: 58.6%
Here:
59%
State:
60%
(% for various income ranges: 53.8% for AGIs below $25k, 56.9% for AGIs $25k-50k, 62.7% for AGIs $50k-75k, 65.4% for AGIs $75k-100k, 64.9% for AGIs $100k-200k, 85.7% for AGIs over 200k)
Averages for the 2004 tax year for zip code 02911, filed in 2005:
Average Adjusted Gross Income (AGI) in 2004: $42,991 (Individual Income Tax Returns)
Here:
$42,991
State:
$51,090
Salary/wage: $39,418 (reported on 85.9% of returns)
Here:
$39,418
State:
$43,690
(% of AGI for various income ranges: 91.6% for AGIs below $10k, 73.6% for AGIs $10k-25k, 83.3% for AGIs $25k-50k, 81.3% for AGIs $50k-75k, 84.8% for AGIs $75k-100k, 68.2% for AGIs over 100k)
Taxable interest for individuals: $1,252 (reported on 53.1% of returns)
This zip code:
$1,252
Rhode Island:
$1,567
(% of AGI for various income ranges: 5.8% for AGIs below $10k, 2.5% for AGIs $10k-25k, 1.7% for AGIs $25k-50k, 1.2% for AGIs $50k-75k, 1.2% for AGIs $75k-100k, 1.4% for AGIs over 100k)
Taxable dividends: $1,329 (reported on 21.9% of returns)
Here:
$1,329
State:
$3,896
(% of AGI for various income ranges: 1.8% for AGIs below $10k, 1.2% for AGIs $10k-25k, 0.6% for AGIs $25k-50k, 0.6% for AGIs $50k-75k, 0.6% for AGIs $75k-100k, 0.6% for AGIs over 100k)
Net capital gain/loss: +$7,334 (reported on 16.5% of returns)
Here:
+$7,334
State:
+$15,829
(% of AGI for various income ranges: -1.1% for AGIs below $10k, 0.0% for AGIs $10k-25k, 0.2% for AGIs $25k-50k, 1.0% for AGIs $50k-75k, 1.9% for AGIs $75k-100k, 9.3% for AGIs over 100k)
Profit/loss from business: +$10,354 (reported on 11.2% of returns)
Here:
+$10,354
State:
+$15,557
(% of AGI for various income ranges: 5.0% for AGIs below $10k, 5.1% for AGIs $10k-25k, 2.6% for AGIs $25k-50k, 2.1% for AGIs $50k-75k, 1.5% for AGIs $75k-100k, 3.2% for AGIs over 100k)
IRA payment deduction: $2,749 (reported on 2.9% of returns)
02911:
$2,749
Rhode Island:
$3,092
(% of AGI for various income ranges: 0.3% for AGIs $10k-25k, 0.2% for AGIs $25k-50k, 0.1% for AGIs $50k-75k, 0.2% for AGIs $75k-100k, 0.1% for AGIs over 100k)
Self-employed pension: $12,424 (reported on 0.4% of returns)
Here:
$12,424
Rhode Island:
$14,597
Total itemized deductions: $16,026 (23% of AGI, reported on 38.5% of returns)
Here:
$16,026
State:
$20,228
Here:
22.9% of AGI
State:
21.1% of AGI
(% of AGI for various income ranges: 10.9% for AGIs below $10k, 9.2% for AGIs $10k-25k, 12.7% for AGIs $25k-50k, 16.3% for AGIs $50k-75k, 16.7% for AGIs $75k-100k, 14.5% for AGIs over 100k)
Charity contributions deductions: $1,701 (2% of AGI, reported on 35.2% of returns)
Here:
$1,701
State:
$2,620
Here:
2.4% of AGI
State:
2.6% of AGI
(% of AGI for various income ranges: 0.5% for AGIs below $10k, 0.8% for AGIs $10k-25k, 1.1% for AGIs $25k-50k, 1.5% for AGIs $50k-75k, 1.6% for AGIs $75k-100k, 1.7% for AGIs over 100k)
Total tax: $5,495 (reported on 80.9% of returns)
02911:
$5,495
State:
$8,437
(% of AGI for various income ranges: 2.4% for AGIs below $10k, 4.6% for AGIs $10k-25k, 7.8% for AGIs $25k-50k, 9.6% for AGIs $50k-75k, 10.5% for AGIs $75k-100k, 16.4% for AGIs over 100k)
Earned income credit: $1,447 (reported on 10.0% of returns)
Here:
$1,447
State:
$1,659
Percentage of individuals using paid preparers for their 2004 taxes: 61.7%
Here:
62%
State:
63%
(% for various income ranges: 53.7% for AGIs below $10k, 59.9% for AGIs $10k-25k, 61.6% for AGIs $25k-50k, 66.1% for AGIs $50k-75k, 67.9% for AGIs $75k-100k, 68.4% for AGIs over 100k)
Likely homosexual households (counted as self-reported same-sex unmarried-partner households)
Lesbian couples: 0.0% of all households
Gay men: 0.2% of all households
Household received Food Stamps/SNAP in the past 12 months: 916 Household did not receive Food Stamps/SNAP in the past 12 months: 5,902
Women who had a birth in the past 12 months: 200 (44 now married, 154 unmarried) Women who did not have a birth in the past 12 months: 4,049 (1,315 now married, 2,729 unmarried)
Housing units in zip code 02911 with a mortgage: 3,042 (263 second mortgage, 225 both second mortgage and home equity loan) Houses without a mortgage: 36
Median monthly owner costs for units with a mortgage: $1,897 Median monthly owner costs for units without a mortgage: $874
Residents with income below the poverty level in 2022:
This zip code:
9.9%
Whole state:
10.8%
Residents with income below 50% of the poverty level in 2022:
This zip code:
5.9%
Whole state:
5.6%
Median number of rooms in houses and condos:
Here:
6.1
State:
6.2
Median number of rooms in apartments:
Here:
3.8
State:
4.1
Notable locations in this zip code not listed on our city pages
Notable locations in zip code 02911: Tri-Town Child Care Center (A), North Providence Town Hall (B), North Providence Fire Department Station 2 (C), Early Years Learning Center (D). Display/hide their locations on the map
Churches in zip code 02911 include: Franciscan Missionaries of Mary (A), Saint Marys Home (B), Allendale Baptist Church (C), People of Gods Love Church (D), Seventh Day Adventist Church (E), Saint Lawrence Parish Center (F), Grace Christian Fellowship Church (G). Display/hide their locations on the map
In group quarters: 452 (-1 institutionalized population)
Size of family households: 1,487 2-persons, 1,400 3-persons, 569 4-persons, 249 5-persons, 166 6-persons, 80 7-or-more-persons
Size of nonfamily households: 2,294 1-person, 525 2-persons, 17 3-persons
1,112 married couples with children.
1,487 single-parent households (515 men, 972 women).
79.6% of residents of 02911 zip code speak English at home.
9.8% of residents speak Spanish at home (60% very well, 25% well, 13% not well, 2% not at all).
3.7% of residents speak other Indo-European language at home (91% very well, 6% well, 3% not well).
5.2% of residents speak Asian or Pacific Island language at home (37% very well, 61% well, 2% not well).
2.1% of residents speak other language at home (73% very well, 27% well).
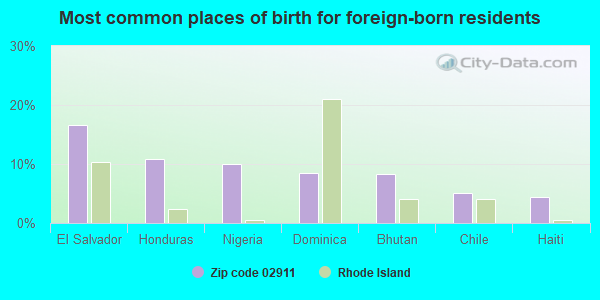
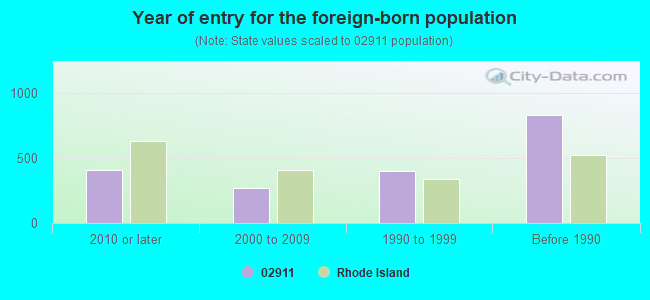
Foreign born population: 1,594 (10.1%) (69.8% of them are naturalized citizens)
This zip code:
10.1%
Whole state:
14.4%
17%El Salvador
11%Honduras
10%Nigeria
9%Dominica
8%Bhutan
5%Chile
4%Haiti
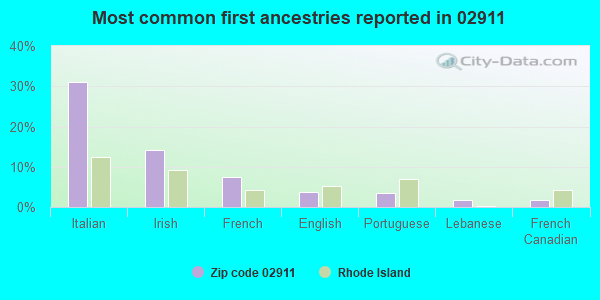
31%Italian
14%Irish
7%French
4%English
3%Portuguese
2%Lebanese
2%French Canadian
Year of entry for the foreign-born population
4082010 or later
2702000 to 2009
3981990 to 1999
832Before 1990
Major facilities with environmental interests located in this zip code:
EVANS PLATING (50 WATERMAN AVENUE in NORTH PROVIDENCE, RI)
AIR MINOR (AIRS/AFS) - ICIS-01-2002-0189, FORMAL ENFORCEMENT ACTION (Integrated Compliance Information System) - ICIS-01-2001-0179, FORMAL ENFORCEMENT ACTION, ICIS-01-2002-0189, ICIS-01-2002-0204, CRITERIA AND HAZARDOUS AIR POLLUTANT INVENTORY (Inventory of air pollution sources) National Pollutant Discharge Elimination System NON-MAJOR (Tracking pollutant discharge elimination systems) - permit HAZARDOUS WASTE BIENNIAL REPORTER (Resource Conservation and Recovery Act (tracking hazardous waste)) - ICIS-01-2002-0189, FORMAL ENFORCEMENT ACTION Small Quantity Generators, between 100 kg and 1000 kg of hazardous waste/month (Resource Conservation and Recovery Act (tracking hazardous waste)) - ICIS-01-2002-0189, FORMAL ENFORCEMENT ACTION TRI REPORTER (Tracking of toxic chemicals releasing facilities) Business SIC and NAICS classification: ELECTROPLATING, PLATING, POLISHING, ANODIZING, AND COLORING Organizations: EVANS PLATING CORPORATION (CONTACT/OWNER)
INDUPLATE INCORPORATED (1 GREYSTONE DR. in NORTH PROVIDENCE, RI)
AIR MINOR (AIRS/AFS) CRITERIA AND HAZARDOUS AIR POLLUTANT INVENTORY (Inventory of air pollution sources) National Pollutant Discharge Elimination System NON-MAJOR (Tracking pollutant discharge elimination systems) - permit HAZARDOUS WASTE BIENNIAL REPORTER (Resource Conservation and Recovery Act (tracking hazardous waste)) Large Quantity Generators, more that 1000 kg of hazardous waste/month (Resource Conservation and Recovery Act (tracking hazardous waste)) - notification (Resource Conservation and Recovery Act (tracking hazardous waste)) TRI REPORTER (Tracking of toxic chemicals releasing facilities) Business SIC and NAICS classification: ELECTROPLATING, PLATING, POLISHING, ANODIZING, AND COLORING Organizations: INDUPLATE, LLC (CONTACT/OPERATOR)
, INDUPLATE LLC. (CONTACT/OPERATOR)
, EVERETT H FERNALD JR (CONTACT/OWNER)
, INDUPLATE, LLC (CONTACT/OWNER)
, EVERETT FERNALD (CONTACT/OWNER)
Alternative names: INDUPLATE, LLC
CENTREDALE MANOR RESTORATION PROJECT (2072 AND 2074 SMITH STREET (ROUTE 44) in N PROVIDENCE, RI)
JAMES L. MCGUIRE SCHOOL (55 CENTRAL AVENUE in NORTH PROVIDENCE, RI)
(Geographic Names Information System) (National Center for Education Statistics) - STATE ID-24107 Organizations: NORTH PROVIDENCE SCH DIST (SCHOOL DISTRICT)
GREYSTONE SCHOOL (100 MORGAN AVENUE in NORTH PROVIDENCE, RI)
(Geographic Names Information System) (National Center for Education Statistics) - STATE ID-24110 Organizations: NORTH PROVIDENCE SCH DIST (SCHOOL DISTRICT)
F RONCI CO INC (1800 SMITH STREET in NORTH PROVIDENCE, RI)
AIR MINOR (AIRS/AFS) (Resource Conservation and Recovery Act (tracking hazardous waste)) TRI REPORTER (Tracking of toxic chemicals releasing facilities) Business SIC classification: JEWELERS' FINDINGS AND MATERIALS, AND LAPIDARY WORK; FASTENERS, BUTTONS, NEEDLES, AND PINS Organizations: OWNERNAME (CONTACT/OWNER)
Alternative names: RONCI F CO INC
CENTREDALE SCHOOL (41 ANGELL AVENUE in NORTH PROVIDENCE, RI)
(National Center for Education Statistics) - STATE ID-24109 Organizations: NORTH PROVIDENCE SCH DIST (SCHOOL DISTRICT)
DR. EDWARD RICCI SCHOOL (55 INTERVALE AVENUE in NORTH PROVIDENCE, RI)
(National Center for Education Statistics) - STATE ID-24111 Organizations: NORTH PROVIDENCE SCH DIST (SCHOOL DISTRICT)
LEE'S MANUFACTURING COMPANY, INC. (1700 SMITH ST in N PROVIDENCE, RI)
AIR MINOR (AIRS/AFS) (Resource Conservation and Recovery Act (tracking hazardous waste)) Business SIC classification: JEWELRY, PRECIOUS METAL Organizations: CHARLES A MORVILLO (CONTACT/OWNER)
BROOK VILLAGE APARTMENTS (2072 AND 2074 SMITH ST in NORTH PROVIDENCE, RI)
FERNANDO ORIGINALS, LTD. DBA F.O. INC (184 WOONASQUATUCKET AVENUE in NORTH PROVIDENCE, RI)
AIR MINOR (AIRS/AFS) CRITERIA AND HAZARDOUS AIR POLLUTANT INVENTORY (Inventory of air pollution sources) Small Quantity Generators, between 100 kg and 1000 kg of hazardous waste/month (Resource Conservation and Recovery Act (tracking hazardous waste)) - notification TRI REPORTER (Tracking of toxic chemicals releasing facilities) Business SIC classification: COSTUME JEWELRY AND COSTUME NOVELTIES, EXCEPT PRECIOUS METAL Business NAICS classification: COSTUME JEWELRY AND NOVELTY MANUFACTURING. Organizations: OWNERNAME (CONTACT/OWNER)
Alternative names: FO\FERNANDO ORIGINALS, LTD.
NEW ANNEX PLATING INC (19 HUMBERT ST. in N PROVIDENCE, RI)
(Resource Conservation and Recovery Act (tracking hazardous waste)) TRI REPORTER (Tracking of toxic chemicals releasing facilities) Business SIC and NAICS classification: ELECTROPLATING, PLATING, POLISHING, ANODIZING, AND COLORING Organizations: ROBERT J SILVERMAN (CONTACT/OWNER)
FRUIT HILL CONDOMINIUMS (127 FRUIT HILL AVENUE in PROVIDENCE, RI)
National Pollutant Discharge Elimination System NON-MAJOR (Tracking pollutant discharge elimination systems) - permit Organizations: SOUTH SHORE UTILITY CONTRACTRS (CONTACT/OPERATOR)
, ARROW HOLDINGS, LLC (CONTACT/OWNER)
Alternative names: ARROW HOLDINGS, LLC
Housing units lacking complete plumbing facilities: 0.1% Housing units lacking complete kitchen facilities: 0.4%
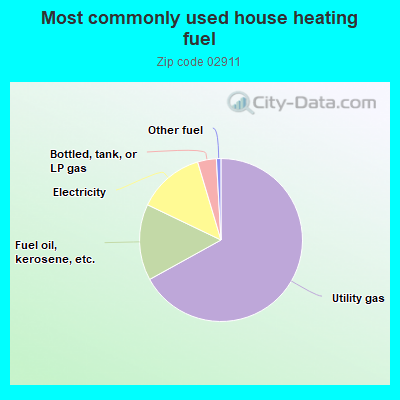
66.7%Utility gas
15.1%Fuel oil, kerosene, etc.
13.2%Electricity
3.7%Bottled, tank, or LP gas
0.9%Other fuel
Population in 1990: 13,858. Population change in the 1990s: +449 (+3.2%).
Place of birth for U.S.-born residents:
This state: 10,428
Northeast: 2,389
Midwest: 50
South: 403
West: 280
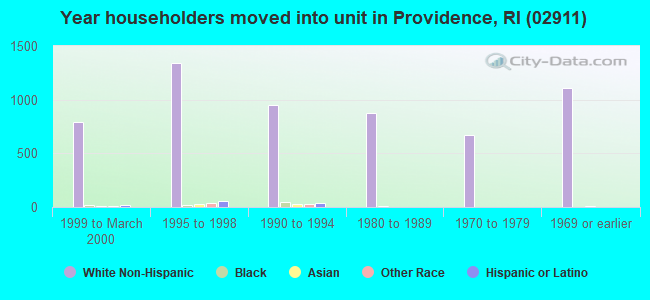
65% of the 02911 zip code residents lived in the same house 5 years ago. Out of people who lived in different houses, 81% lived in this county. Out of people who lived in different counties, 50% lived in Rhode Island.
93% of the 02911 zip code residents lived in the same house 1 year ago. Out of people who lived in different houses, 72% moved from this county. Out of people who lived in different houses, 4% moved from different county within same state. Out of people who lived in different houses, 22% moved from different state. Out of people who lived in different houses, 1% moved from abroad.
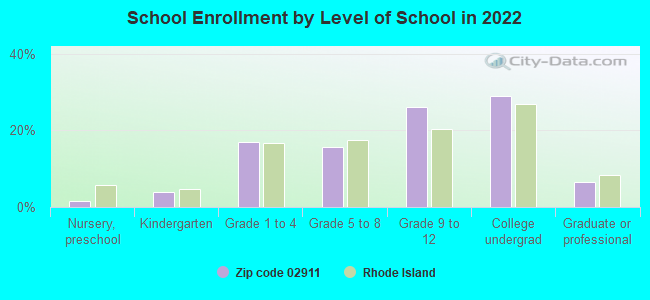
Private vs. public school enrollment:
Students in private schools in grades 1 to 8 (elementary and middle school): 82
Here:
7.5%
Rhode Island:
12.2%
Students in private schools in grades 9 to 12 (high school): 46
Here:
5.2%
Rhode Island:
11.6%
Students in private undergraduate colleges: 179
Here:
17.8%
Rhode Island:
41.1%
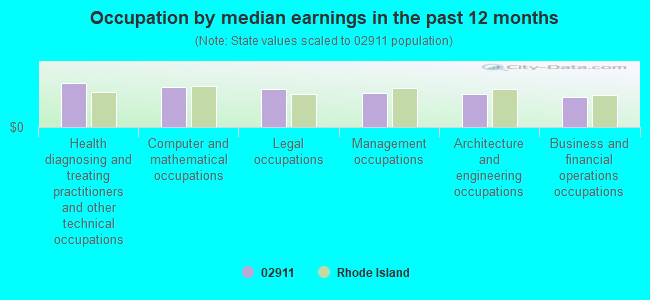
Occupation by median earnings in the past 12 months ($)
111,159Health diagnosing and treating practitioners and other technical occupations
101,645Computer and mathematical occupations
96,060Legal occupations
85,447Management occupations
82,172Architecture and engineering occupations
74,571Business and financial operations occupations
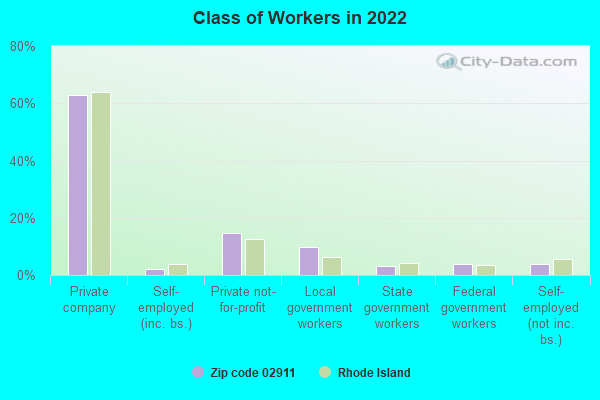
Companies with federal contracts located in this zip code:
GREATER PROVIDENCE CHAPTER R I (220 WOONASQUATUCKET AVE in NORTH PROVIDEN, RI) : $208,745 in 22 contractsfrom 2001 to 2006
Contracts for Custodial Janitorial Services, Landscaping/Groundskeeping Services by Navy, Army Signed by year:2000: $0; 2001: $3,976; 2002: $46,622; 2003: $46,041; 2004: $33,585; 2005: $68,021; 2006: $10,500.
Biggest contracts:
$34,849 with Navy for Custodial Janitorial Services. Signed on 2005-10-01. Completion date: 2006-09-30.
$27,336, same as above.Signed on 2003-11-07. Completion date: 2004-09-30.
$26,744, same as above.Signed on 2002-10-01. Completion date: 2003-09-30.
$19,878, same as above.Signed on 2002-01-25. Completion date: 2002-09-30.
FEELEY''S DIE CUTTING (146 WATERMAN AVE # D in NORTH PROVIDEN, RI; small business)
$4,900 with Army for Badges and Insignia. Taking place in VA. Signed on 2003-02-13. Completion date: 2003-03-10.
Top industries in this zip code by the number of employees in 2005:
Health Care and Social Assistance: Services for the Elderly and Persons with Disabilities (100-249 employees: 1 establishment, 20-49 employees: 1 establishment, 10-19 employees: 1 establishment, 1-4 employees: 1 establishment)
Health Care and Social Assistance: Other Residential Care Facilities (100-249: 1)
Health Care and Social Assistance: Residential Mental Retardation Facilities (20-49: 4, 10-19: 1)
2004 - 2015 National Fire Incident Reporting System (NFIRS) incidents
According to the data from the years 2004 - 2015 the average number of fire incidents per year is 20. The highest number of fire incidents - 80 took place in 2011, and the least - 0 in 2005. The data has a rising trend.
When looking into fire subcategories, the most reports belonged to: Structure Fires (48.3%), and Outside Fires (34.2%).
Fire incident types reported to NFIRS in Zip Code 02911


 Nearest zip codes: 02904, 02909, 02908, 02919, 02865, 02917.
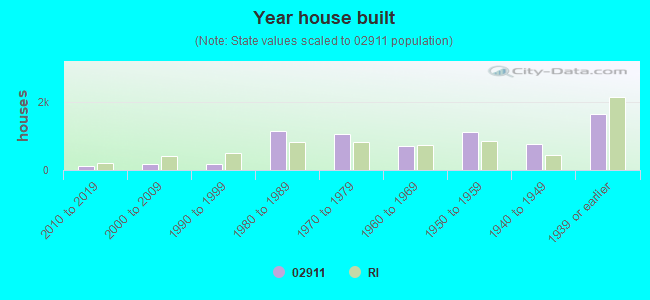


 According to the data from the years 2004 - 2015 the average number of fire incidents per year is 20. The highest number of fire incidents - 80 took place in 2011, and the least - 0 in 2005. The data has a rising trend.
 When looking into fire subcategories, the most reports belonged to: Structure Fires (48.3%), and Outside Fires (34.2%).