Estimated zip code population in 2022: 27,159 Zip code population in 2010: 26,417 Zip code population in 2000: 26,986
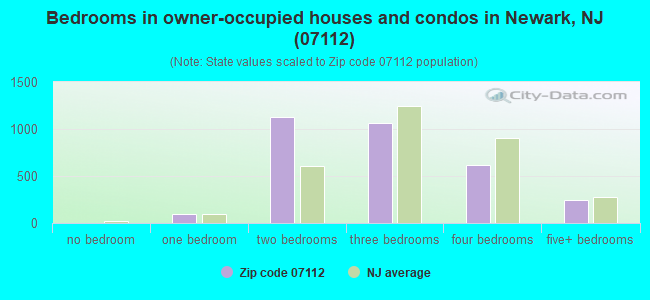
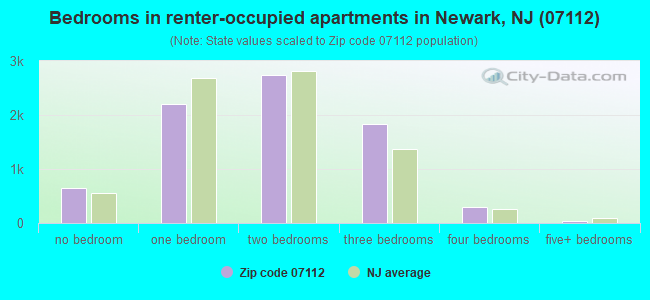
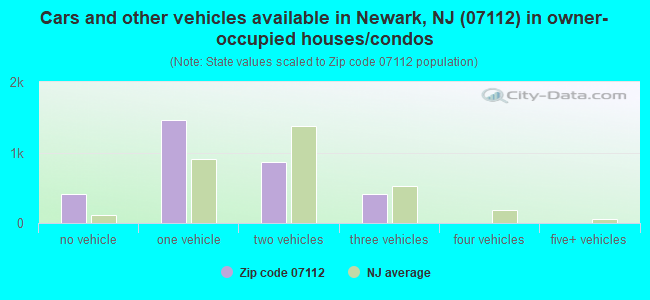
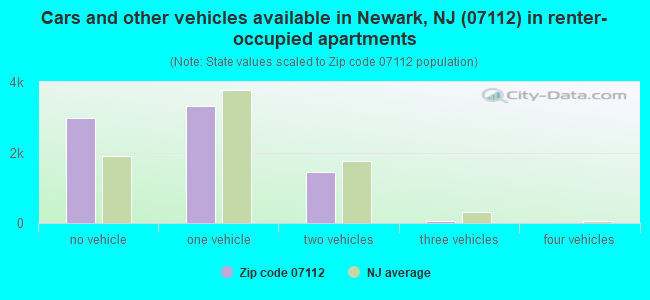
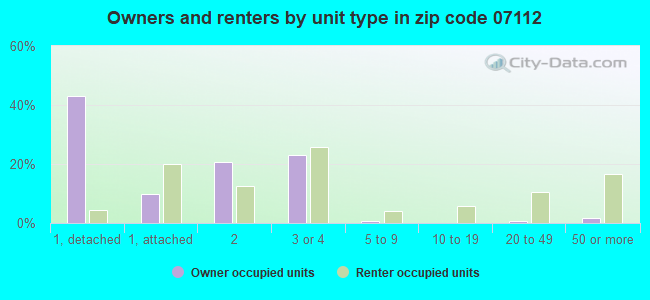
Houses and condos: 12,134 Renter-occupied apartments: 7,804
% of renters here:
71%
State:
35%
March 2022 cost of living index in zip code 07112: 114.9 (more than average, U.S. average is 100)
Land area: 1.8 sq. mi. Water area: 0.0 sq. mi.
Population density: 14,917 people per square mile
(very high).
OSM Map
Google Map
MSN Map
OSM Map
General Map
Google Map
MSN Map
OSM Map
Google Map
MSN Map
OSM Map
Google Map
MSN Map
Please wait while loading the map...
Real estate property taxes paid for housing units in 2022:
This zip code:
2.1% ($6,435)
New Jersey:
2.1% ($8,897)
Median real estate property taxes paid for housing units with mortgages in 2022: $6,524 (2.1%) Median real estate property taxes paid for housing units with no mortgage in 2022: $6,221 (1.9%)
Averages for the 2020 tax year for zip code 07112, filed in 2021:
Average Adjusted Gross Income (AGI) in 2020: $36,845 (Individual Income Tax Returns)
Here:
$36,845
State:
$95,247
Salary/wage: $35,391 (reported on 87.2% of returns)
Here:
$35,391
State:
$80,635
(% of AGI for various income ranges: 1118.5% for AGIs below $25k, 3678.8% for AGIs $25k-50k, 6970.8% for AGIs $50k-75k, 10618.6% for AGIs $75k-100k, 15986.7% for AGIs $100k-200k)
Taxable interest for individuals: $314 (reported on 6.9% of returns)
This zip code:
$314
New Jersey:
$2,414
(% of AGI for various income ranges: 1.7% for AGIs below $25k, 1.3% for AGIs $25k-50k, 5.8% for AGIs $50k-75k, 8.8% for AGIs $75k-100k, 7.8% for AGIs $100k-200k)
Ordinary dividends: $967 (reported on 3.1% of returns)
Here:
$967
State:
$8,057
(% of AGI for various income ranges: 1.2% for AGIs below $25k, 0.8% for AGIs $25k-50k, 10.5% for AGIs $50k-75k, 6.3% for AGIs $75k-100k, 36.7% for AGIs $100k-200k)
Net capital gain/loss in AGI: +$2,554 (reported on 2.9% of returns)
Here:
+$2,554
State:
+$25,022
(% of AGI for various income ranges: 0.2% for AGIs below $25k, 1.1% for AGIs $25k-50k, 17.1% for AGIs $50k-75k, 49.6% for AGIs $75k-100k, 122.8% for AGIs $100k-200k)
Profit/loss from business: +$2,117 (reported on 17.3% of returns)
Here:
+$2,117
State:
+$18,035
(% of AGI for various income ranges: 95.1% for AGIs below $25k, 27.5% for AGIs $50k-75k, 45.1% for AGIs $75k-100k, 106.9% for AGIs $100k-200k)
Taxable individual retirement arrangement distribution: $9,562 (reported on 1.5% of returns)
07112:
$9,562
New Jersey:
$21,558
(% of AGI for various income ranges: 7.5% for AGIs below $25k, 10.8% for AGIs $25k-50k, 55.6% for AGIs $50k-75k, 118.6% for AGIs $100k-200k)
Total itemized deductions: $27,222 (reported on 6.6% of returns)
Here:
$27,222
State:
$32,863
(% of AGI for various income ranges: 31.5% for AGIs below $25k, 159.9% for AGIs $25k-50k, 428.9% for AGIs $50k-75k, 826.1% for AGIs $75k-100k, 1661.9% for AGIs $100k-200k)
Charity contributions: $7,707 (reported on 5.2% of returns)
Here:
$7,707
State:
$7,880
(% of AGI for various income ranges: 3.8% for AGIs below $25k, 24.4% for AGIs $25k-50k, 79.5% for AGIs $50k-75k, 229.8% for AGIs $75k-100k, 533.3% for AGIs $100k-200k)
Taxes paid: $9,569 (reported on 6.6% of returns)
07112:
$9,569
State:
$9,183
(% of AGI for various income ranges: 12.0% for AGIs below $25k, 64.2% for AGIs $25k-50k, 140.6% for AGIs $50k-75k, 296.5% for AGIs $75k-100k, 517.2% for AGIs $100k-200k)
Earned income credit: $2,413 (reported on 31.9% of returns)
Here:
$2,413
State:
$2,148
(% of AGI for various income ranges: 150.8% for AGIs below $25k, 90.2% for AGIs $25k-50k)
Percentage of individuals using paid preparers for their 2020 taxes: 93.1%
Here:
93%
State:
92%
(% for various income ranges: 92.3% for AGIs below $25k, 94.6% for AGIs $25k-50k, 92.6% for AGIs $50k-75k, 93.1% for AGIs $75k-100k, 88.5% for AGIs $100k-200k, 100.0% for AGIs over 200k)
Averages for the 2012 tax year for zip code 07112, filed in 2013:
Average Adjusted Gross Income (AGI) in 2012: $31,428 (Individual Income Tax Returns)
Here:
$31,428
State:
$79,688
Salary/wage: $30,787 (reported on 84.8% of returns)
Here:
$30,787
State:
$68,122
(% of AGI for various income ranges: 71.2% for AGIs below $25k, 88.5% for AGIs $25k-50k, 88.6% for AGIs $50k-75k, 86.0% for AGIs $75k-100k, 82.1% for AGIs $100k-200k, 53.7% for AGIs over 200k)
Taxable interest for individuals: $369 (reported on 9.5% of returns)
This zip code:
$369
New Jersey:
$2,193
(% of AGI for various income ranges: 0.1% for AGIs $75k-100k, 0.2% for AGIs $100k-200k)
Ordinary dividends: $1,051 (reported on 3.8% of returns)
Here:
$1,051
State:
$6,828
(% of AGI for various income ranges: 0.2% for AGIs below $25k, 0.1% for AGIs $50k-75k, 0.3% for AGIs $100k-200k)
Profit/loss from business: +$5,608 (reported on 14.9% of returns)
Here:
+$5,608
State:
+$19,577
(% of AGI for various income ranges: 11.9% for AGIs below $25k, 0.1% for AGIs $25k-50k, 0.2% for AGIs $50k-75k)
Taxable individual retirement arrangement distribution: $9,176 (reported on 2.2% of returns)
07112:
$9,176
New Jersey:
$18,214
(% of AGI for various income ranges: 0.5% for AGIs below $25k, 0.6% for AGIs $25k-50k, 0.7% for AGIs $50k-75k, 0.7% for AGIs $75k-100k, 1.1% for AGIs $100k-200k)
Total itemized deductions: $18,149 (30% of AGI, reported on 19.7% of returns)
Here:
$18,149
State:
$30,827
Here:
30.2% of AGI
State:
21.2% of AGI
(% of AGI for various income ranges: 4.8% for AGIs below $25k, 10.0% for AGIs $25k-50k, 14.3% for AGIs $50k-75k, 16.8% for AGIs $75k-100k, 18.3% for AGIs $100k-200k, 8.8% for AGIs over 200k)
Charity contributions: $4,207 (reported on 15.8% of returns)
Here:
$4,207
State:
$3,451
(% of AGI for various income ranges: 0.5% for AGIs below $25k, 1.8% for AGIs $25k-50k, 2.8% for AGIs $50k-75k, 3.4% for AGIs $75k-100k, 4.0% for AGIs $100k-200k)
Taxes paid: $5,323 (reported on 19.6% of returns)
07112:
$5,323
State:
$15,801
(% of AGI for various income ranges: 1.3% for AGIs below $25k, 2.2% for AGIs $25k-50k, 4.3% for AGIs $50k-75k, 5.5% for AGIs $75k-100k, 6.7% for AGIs $100k-200k, 4.3% for AGIs over 200k)
Earned income credit: $2,541 (reported on 38.9% of returns)
Here:
$2,541
State:
$2,182
(% of AGI for various income ranges: 11.9% for AGIs below $25k, 1.5% for AGIs $25k-50k)
Percentage of individuals using paid preparers for their 2012 taxes: 64.8%
Here:
65%
State:
65%
(% for various income ranges: 64.3% for AGIs below $25k, 63.5% for AGIs $25k-50k, 67.5% for AGIs $50k-75k, 70.0% for AGIs $75k-100k, 71.4% for AGIs $100k-200k, 66.7% for AGIs over 200k)
Averages for the 2004 tax year for zip code 07112, filed in 2005:
Average Adjusted Gross Income (AGI) in 2004: $28,674 (Individual Income Tax Returns)
Here:
$28,674
State:
$64,921
Salary/wage: $28,626 (reported on 90.1% of returns)
Here:
$28,626
State:
$57,755
(% of AGI for various income ranges: 81.4% for AGIs below $10k, 86.3% for AGIs $10k-25k, 94.3% for AGIs $25k-50k, 91.2% for AGIs $50k-75k, 92.1% for AGIs $75k-100k, 74.5% for AGIs over 100k)
Taxable interest for individuals: $475 (reported on 16.2% of returns)
This zip code:
$475
New Jersey:
$2,068
(% of AGI for various income ranges: 0.8% for AGIs below $10k, 0.3% for AGIs $10k-25k, 0.2% for AGIs $25k-50k, 0.3% for AGIs $50k-75k, 0.2% for AGIs $75k-100k, 0.3% for AGIs over 100k)
Taxable dividends: $480 (reported on 5.6% of returns)
Here:
$480
State:
$3,959
(% of AGI for various income ranges: 0.3% for AGIs below $10k, 0.1% for AGIs $10k-25k, 0.1% for AGIs $25k-50k, 0.1% for AGIs $50k-75k, 0.0% for AGIs $75k-100k, 0.3% for AGIs over 100k)
Net capital gain/loss: +$2,525 (reported on 3.0% of returns)
Here:
+$2,525
State:
+$13,591
(% of AGI for various income ranges: -0.2% for AGIs below $10k, 0.0% for AGIs $10k-25k, 0.1% for AGIs $25k-50k, 0.6% for AGIs $50k-75k, -0.0% for AGIs $75k-100k, 1.8% for AGIs over 100k)
Profit/loss from business: +$3,068 (reported on 8.3% of returns)
Here:
+$3,068
State:
+$17,520
(% of AGI for various income ranges: 9.7% for AGIs below $10k, 2.8% for AGIs $10k-25k, 0.2% for AGIs $25k-50k, -0.3% for AGIs $50k-75k, -0.2% for AGIs $75k-100k, -0.2% for AGIs over 100k)
IRA payment deduction: $1,597 (reported on 0.7% of returns)
07112:
$1,597
New Jersey:
$3,270
Total itemized deductions: $16,200 (33% of AGI, reported on 24.1% of returns)
Here:
$16,200
State:
$23,924
Here:
32.8% of AGI
State:
21.1% of AGI
(% of AGI for various income ranges: 7.8% for AGIs below $10k, 7.4% for AGIs $10k-25k, 12.6% for AGIs $25k-50k, 18.1% for AGIs $50k-75k, 20.0% for AGIs $75k-100k, 20.5% for AGIs over 100k)
Charity contributions deductions: $4,254 (8% of AGI, reported on 22.1% of returns)
Here:
$4,254
State:
$3,242
Here:
8.4% of AGI
State:
2.7% of AGI
(% of AGI for various income ranges: 0.7% for AGIs below $10k, 1.3% for AGIs $10k-25k, 3.1% for AGIs $25k-50k, 4.3% for AGIs $50k-75k, 5.0% for AGIs $75k-100k, 6.5% for AGIs over 100k)
Total tax: $3,193 (reported on 57.2% of returns)
07112:
$3,193
State:
$12,321
(% of AGI for various income ranges: 2.2% for AGIs below $10k, 2.2% for AGIs $10k-25k, 4.9% for AGIs $25k-50k, 9.2% for AGIs $50k-75k, 11.2% for AGIs $75k-100k, 15.6% for AGIs over 100k)
Earned income credit: $1,930 (reported on 38.3% of returns)
Here:
$1,930
State:
$1,711
Percentage of individuals using paid preparers for their 2004 taxes: 71.9%
Here:
72%
State:
65%
(% for various income ranges: 68.5% for AGIs below $10k, 74.4% for AGIs $10k-25k, 71.7% for AGIs $25k-50k, 69.3% for AGIs $50k-75k, 73.7% for AGIs $75k-100k, 77.4% for AGIs over 100k)
Household received Food Stamps/SNAP in the past 12 months: 2,342 Household did not receive Food Stamps/SNAP in the past 12 months: 8,889
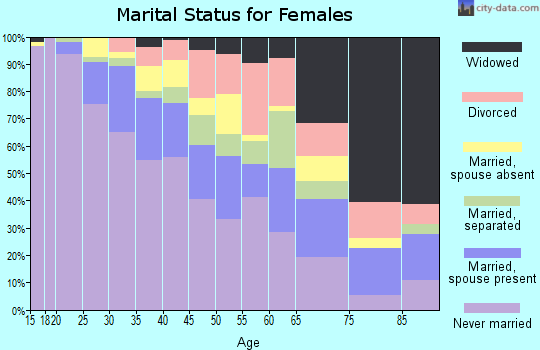
Women who had a birth in the past 12 months: 489 (200 now married, 278 unmarried) Women who did not have a birth in the past 12 months: 7,048 (1,695 now married, 5,378 unmarried)
Housing units in zip code 07112 with a mortgage: 2,230 (294 second mortgage, 274 both second mortgage and home equity loan) Houses without a mortgage: 162
Median monthly owner costs for units with a mortgage: $2,217 Median monthly owner costs for units without a mortgage: $1,032
Residents with income below the poverty level in 2022:
This zip code:
22.2%
Whole state:
9.7%
Residents with income below 50% of the poverty level in 2022:
This zip code:
11.8%
Whole state:
5.2%
Median number of rooms in houses and condos:
Here:
6.0
State:
6.8
Median number of rooms in apartments:
Here:
4.1
State:
3.9
Notable locations in this zip code not listed on our city pages
Churches in zip code 07112 include: Zion Hill Baptist Church (A), Calvary Gospel Church (B), Canaan Baptist Church (C), Elizabeth Avenue Weequahic United Presbyterian Church (D), Franklin-Saint John's United Methodist Church (E), Good Neighbor Baptist Church (F), Morning Star Baptist Church (G), Philemon Baptist Church (H), Union Chapel African Methodist Episcopal Church (I). Display/hide their locations on the map
1,575 married couples with children.
3,446 single-parent households (295 men, 3,151 women).
80.4% of residents of 07112 zip code speak English at home.
7.3% of residents speak Spanish at home (67% very well, 13% well, 11% not well, 9% not at all).
3.7% of residents speak other Indo-European language at home (60% very well, 17% well, 23% not well).
0.4% of residents speak Asian or Pacific Island language at home (44% very well, 22% well, 34% not well).
7.8% of residents speak other language at home (86% very well, 12% well, 2% not well).
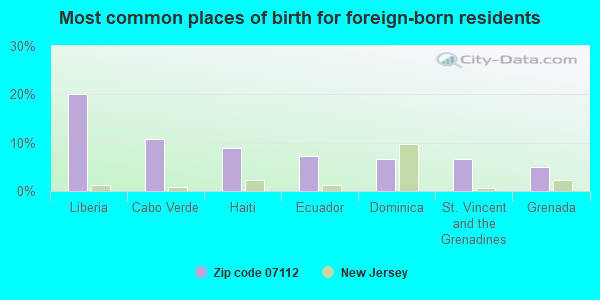
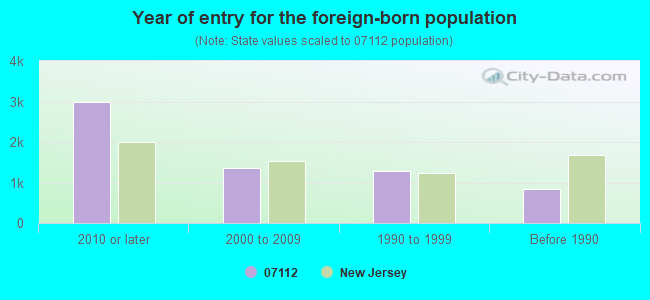
Foreign born population: 5,810 (21.4%) (51.8% of them are naturalized citizens)
Major facilities with environmental interests located in this zip code:
NEWARK BETH ISRAEL MEDICAL CENTER (201 LYONS AVE in NEWARK, NJ)
AIR SYNTHETIC MINOR (AIRS/AFS) ENFORCEMENT/COMPLIANCE ACTIVITY (Integrated Compliance Information System) - ICIS-02-2004-0832, FORMAL ENFORCEMENT ACTION (Integrated Compliance Information System) - ICIS-02-2004-0832, FORMAL ENFORCEMENT ACTION STATE MASTER (New Jersey environmental info) - NJEMS-016873, STATE CLEANUP SITE, NJEMS-05393, AIR PROGRAM, NJEMS-132136, REFUSE DISPOSAL, NJEMS-95763800000, EPCRA, NJEMS-RMW36, REFUSE DISPOSAL Small Quantity Generators, between 100 kg and 1000 kg of hazardous waste/month (Resource Conservation and Recovery Act (tracking hazardous waste)) - notification Business SIC classification: GENERAL MEDICAL AND SURGICAL HOSPITALS Organizations: DEPODESTA MICHAEL, NEWARK BETH ISRAEL MEDICAL CTR (CONTACT/OWNER)
NEWARK CITY BD OF ED MAPLE AVENUE SCHOOL (33 MAPLE AVE in NEWARK, NJ)
(Geographic Names Information System) (National Center for Education Statistics) - STATE ID-510 STATE MASTER (New Jersey environmental info) - NJEMS-014234, STATE CLEANUP SITE (Resource Conservation and Recovery Act (tracking hazardous waste)) Alternative names: MAPLE AVENUE ELEMENTARY SCHOOL, NEWARK PUBLIC SCHOOL MAPLE AVENUE SCHOOL
NEWARK CITY BD OF ED CHANCELLOR AVENUE SCHOOL (321 CHANCELLOR AVE in NEWARK, NJ)
(National Center for Education Statistics) - STATE ID-330 STATE MASTER (New Jersey environmental info) - NJEMS-3570-330-13, PESTICIDES - APPLICATION, NJEMS-014211, STATE CLEANUP SITE, NJEMS-06274, AIR PROGRAM (Resource Conservation and Recovery Act (tracking hazardous waste)) Business SIC classification: NONCLASSIFIABLE ESTABLISHMENTS Alternative names: CHANCELLOR AVENUE ELEM SCHOOL, NEWARK PUBLIC SCHOOLS CHANCELLOR AVE SCH
NEWARK CITY BD OF ED HAWTHORNE AVENUE SCHOOL (428 HAWTHORNE AVE in NEWARK, NJ)
(National Center for Education Statistics) - STATE ID-470 STATE MASTER (New Jersey environmental info) - NJEMS-014226, STATE CLEANUP SITE, NJEMS-06692, AIR PROGRAM (Resource Conservation and Recovery Act (tracking hazardous waste)) Business SIC classification: MANUFACTURING INDUSTRIES; ELEMENTARY AND SECONDARY SCHOOLS Alternative names: HAWTHORNE AVENUE ELEM SCHOOL, NEWARK PUBLIC SCHOOLS HAWTHORNE AVE SCH
NEWARK CITY BD OF ED WEEQUAHIC HIGH SCHOOL (279 CHANCELLOR AVE in NEWARK, NJ)
(National Center for Education Statistics) - STATE ID-070 STATE MASTER (New Jersey environmental info) - NJEMS-014259, STATE CLEANUP SITE, NJEMS-05568, AIR PROGRAM, NJEMS-06417, (Resource Conservation and Recovery Act (tracking hazardous waste)) Business SIC classification: MANUFACTURING INDUSTRIES; ELEMENTARY AND SECONDARY SCHOOLS Organizations: METCO
NEWARK CITY BD OF ED BRAGAW AVENUE SCHOOL (103 BRAGAW AVE in NEWARK, NJ)
(National Center for Education Statistics) - STATE ID-250 STATE MASTER (New Jersey environmental info) - NJEMS-014203, STATE CLEANUP SITE, NJEMS-05079, AIR PROGRAM (Resource Conservation and Recovery Act (tracking hazardous waste)) Business SIC classification: ELEMENTARY AND SECONDARY SCHOOLS Alternative names: BRAGAW AVENUE ELEMENTARY SCHL, NEWARK PUBLIC SCHOOLS BRAGAW AVENUE SCH
NEWARK CITY BD OF ED CHANCELLOR AVENUE ANNEX (255 CHANCELLOR AVE in NEWARK, NJ)
(National Center for Education Statistics) - STATE ID-335 STATE MASTER (New Jersey environmental info) - NJEMS-014212, STATE CLEANUP SITE (Resource Conservation and Recovery Act (tracking hazardous waste)) Alternative names: NEWARK PUBLIC SCH CHANCELLOR AVE ANNEX
NEWARK CITY BD OF ED GEORGE WASHINGTON CARVER SCHOOL (333 CLINTON PL in NEWARK, NJ)
(National Center for Education Statistics) - STATE ID-435 STATE MASTER (New Jersey environmental info) - NJEMS-014213, STATE CLEANUP SITE (Resource Conservation and Recovery Act (tracking hazardous waste)) Alternative names: NEWARK PUBLIC SCHOOL GEORGE W CARVER SCH
BLUE 7 SERVICE STATION (194 CHANCELLOR AVE in NEWARK, NJ)
STATE MASTER (New Jersey environmental info) - NJEMS-42796600000, EPCRA, NJEMS-A0801, AIR PROGRAM, NJEMS-001811, STATE CLEANUP SITE (Resource Conservation and Recovery Act (tracking hazardous waste)) Business SIC classification: GASOLINE SERVICE STATIONS Organizations: CECILIO PO, BLUE SEVEN INC, AMOCO OIL CO (CONTACT/OWNER)
Alternative names: CILMAN AMOCO, CILMAN AMOCO SERVICE STATION
214 WAINWRIGHT STREET APARTMENTS (214 WAINWRIGHT ST in NEWARK, NJ)
AIR MINOR (AIRS/AFS) STATE MASTER (New Jersey environmental info) - NJEMS-017805, STATE CLEANUP SITE, NJEMS-08171, AIR PROGRAM Business SIC classification: OPERATORS OF APARTMENT BUILDINGS Organizations: 214 WAINWRIGHT LLC, LESSA FRANK (CONTACT/OWNER)
Alternative names: 214 WAINWRIGHT ST APARTMENTS, KAPLAN LEWIS
BERGEN STAR DRY CLEANERS (1075 BERGEN ST in NEWARK, NJ)
STATE MASTER (New Jersey environmental info) - NJEMS-00000001034, EPCRA, NJEMS-L0629, AIR PROGRAM (Resource Conservation and Recovery Act (tracking hazardous waste)) Business SIC classification: DRYCLEANING PLANTS, EXCEPT RUG CLEANING Organizations: SON DRY CLEANERS Alternative names: SON DRY CLEANERS
ESSEX CNTY DPW WEEQUAHIC PARK MAINTENANCE GARAGE (ELIZABETH & CHANCELLOR AVE in NEWARK, NJ)
STATE MASTER (New Jersey environmental info) - NJEMS-008234, STATE CLEANUP SITE, NJEMS-07622, AIR PROGRAM, NJEMS-H8662, (Resource Conservation and Recovery Act (tracking hazardous waste)) Organizations: ESSEX CNTY DPW DEPT OF ENGINEERING Alternative names: ESSEX COUNTY OF WEEQUAHIC PARK
225 MEEKER AVENUE APARTMENTS (225 MEEKER AVE in NEWARK, NJ)
AIR MINOR (AIRS/AFS) STATE MASTER (New Jersey environmental info) - NJEMS-07886, AIR PROGRAM, NJEMS-G000062232, STATE CLEANUP SITE Business SIC classification: OPERATORS OF APARTMENT BUILDINGS; NONCLASSIFIABLE ESTABLISHMENTS Organizations: 225 MEEKER AVENUE LLC, 225 MEEKER 2001 LLC Alternative names: CLIFFE CORPORATION
Housing units lacking complete plumbing facilities: 2.5% Housing units lacking complete kitchen facilities: 4.5%
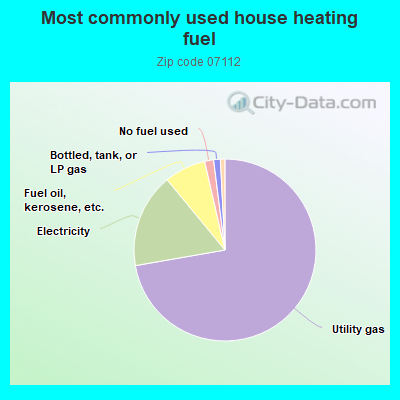
72.4%Utility gas
16.8%Electricity
7.4%Fuel oil, kerosene, etc.
1.6%No fuel used
1.2%Bottled, tank, or LP gas
0.8%Other fuel
Population in 1990: 30,356.
Place of birth for U.S.-born residents:
This state: 15,879
Northeast: 2,085
Midwest: 50
South: 2,568
West: 222
63% of the 07112 zip code residents lived in the same house 5 years ago. Out of people who lived in different houses, 79% lived in this county. Out of people who lived in different counties, 50% lived in New Jersey.
91% of the 07112 zip code residents lived in the same house 1 year ago. Out of people who lived in different houses, 53% moved from this county. Out of people who lived in different houses, 26% moved from different county within same state. Out of people who lived in different houses, 13% moved from different state. Out of people who lived in different houses, 6% moved from abroad.
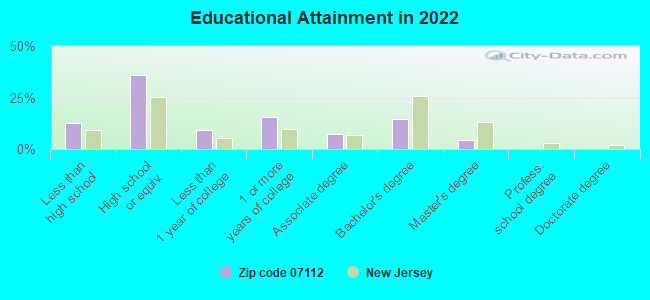
Private vs. public school enrollment:
Students in private schools in grades 1 to 8 (elementary and middle school): 70
Here:
3.8%
New Jersey:
12.3%
Students in private schools in grades 9 to 12 (high school): 214
Here:
11.1%
New Jersey:
13.1%
Students in private undergraduate colleges: 473
Here:
32.6%
New Jersey:
33.2%
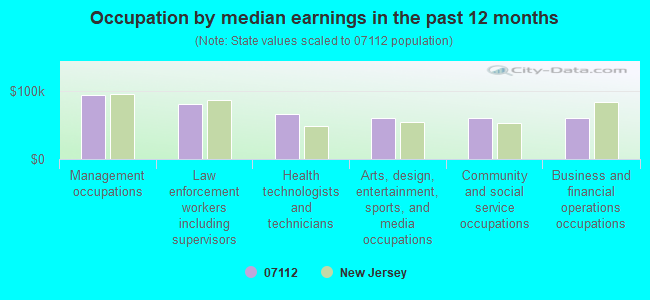
Occupation by median earnings in the past 12 months ($)
94,215Management occupations
80,122Law enforcement workers including supervisors
65,882Health technologists and technicians
60,553Arts, design, entertainment, sports, and media occupations
60,096Community and social service occupations
60,046Business and financial operations occupations
Top industries in this zip code by the number of employees in 2005:
Health Care and Social Assistance: General Medical and Surgical Hospitals (over 1000 employees: 1 establishment)
Health Care and Social Assistance: Child Day Care Services (20-49: 1, 10-19: 5, 5-9: 1, 1-4: 3)
2002 - 2018 National Fire Incident Reporting System (NFIRS) incidents
According to the data from the years 2002 - 2018 the average number of fires per year is 51. The highest number of reported fires - 143 took place in 2017, and the least - 0 in 2003. The data has a growing trend.
When looking into fire subcategories, the most incidents belonged to: Structure Fires (61.0%), and Outside Fires (18.9%).
Fire incident types reported to NFIRS in Zip Code 07112


 Nearest zip codes: 07108, 07205, 07111, 07103, 07106, 07208.
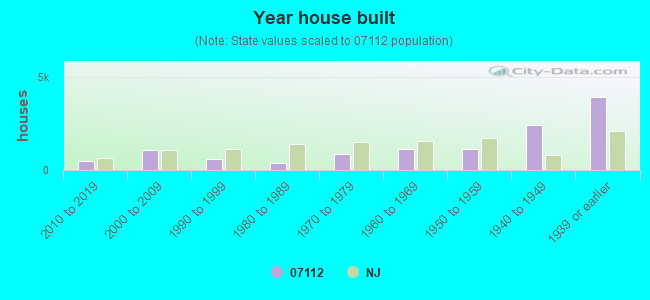


 According to the data from the years 2002 - 2018 the average number of fires per year is 51. The highest number of reported fires - 143 took place in 2017, and the least - 0 in 2003. The data has a growing trend.
 When looking into fire subcategories, the most incidents belonged to: Structure Fires (61.0%), and Outside Fires (18.9%).