Estimated zip code population in 2022: 7,736 Zip code population in 2010: 7,603 Zip code population in 2000: 7,567
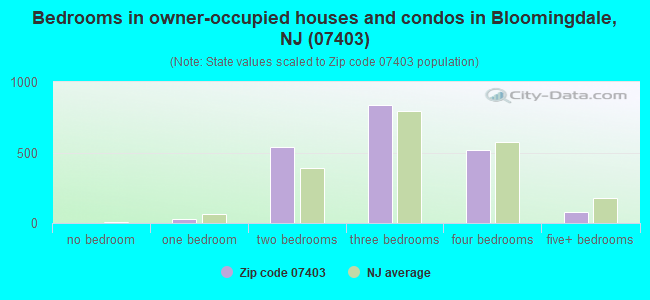
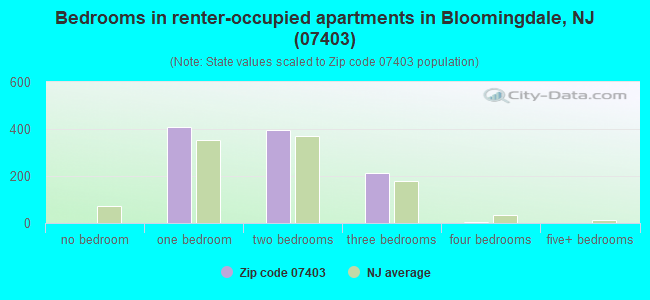
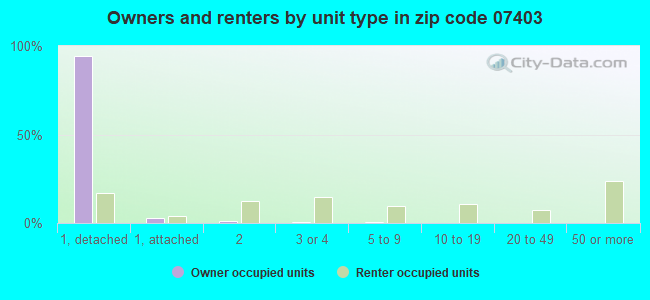
Houses and condos: 3,041 Renter-occupied apartments: 1,015
% of renters here:
34%
State:
35%
March 2022 cost of living index in zip code 07403: 116.0 (more than average, U.S. average is 100)
Land area: 6.4 sq. mi. Water area: 0.4 sq. mi.
Population density: 1,218 people per square mile
(low).
OSM Map
Google Map
MSN Map
OSM Map
General Map
Google Map
MSN Map
OSM Map
Google Map
MSN Map
OSM Map
Google Map
MSN Map
Please wait while loading the map...
Real estate property taxes paid for housing units in 2022:
This zip code:
2.4% ($9,521)
New Jersey:
2.1% ($8,897)
Median real estate property taxes paid for housing units with mortgages in 2022: $9,557 (2.4%) Median real estate property taxes paid for housing units with no mortgage in 2022: $9,483 (2.5%)
Business Search- 14 Million verified businesses
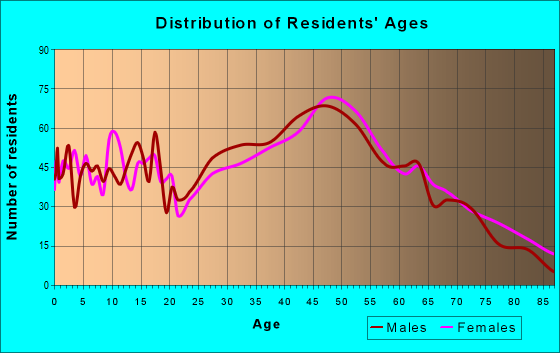
Males: 3,817
(49.3%)
Females: 3,919
(50.7%)
For population 25 years and over in 07403:
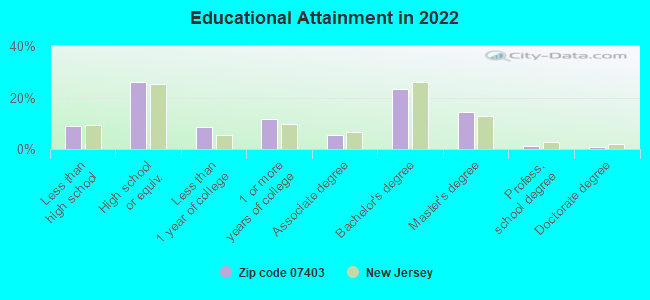
High school or higher: 91.4%
Bachelor's degree or higher: 39.8%
Graduate or professional degree: 16.3%
Unemployed: 3.4%
Mean travel time to work (commute): 29.2 minutes
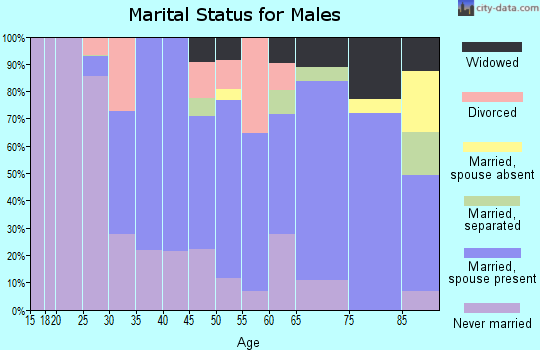
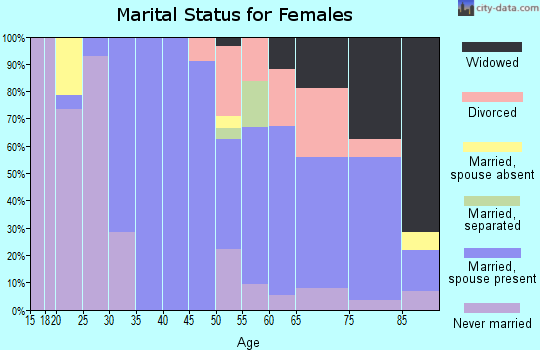
For population 15 years and over in 07403:
Never married: 31.6%
Now married: 52.9%
Separated: 2.1%
Widowed: 6.2%
Divorced: 7.2%
Zip code 07403 compared to state average:
Black race population percentage significantly below state average.
Median age above state average.
Length of stay since moving in significantly below state average.
Averages for the 2020 tax year for zip code 07403, filed in 2021:
Average Adjusted Gross Income (AGI) in 2020: $85,308 (Individual Income Tax Returns)
Here:
$85,308
State:
$95,247
Salary/wage: $75,071 (reported on 83.8% of returns)
Here:
$75,071
State:
$80,635
(% of AGI for various income ranges: 1203.6% for AGIs below $25k, 3692.0% for AGIs $25k-50k, 6894.9% for AGIs $50k-75k, 10342.9% for AGIs $75k-100k, 19226.3% for AGIs $100k-200k, 75033.8% for AGIs over 200k)
Taxable interest for individuals: $1,088 (reported on 33.7% of returns)
This zip code:
$1,088
New Jersey:
$2,414
(% of AGI for various income ranges: 22.0% for AGIs below $25k, 25.4% for AGIs $25k-50k, 36.7% for AGIs $50k-75k, 51.6% for AGIs $75k-100k, 108.0% for AGIs $100k-200k, 385.0% for AGIs over 200k)
Ordinary dividends: $3,474 (reported on 26.9% of returns)
Here:
$3,474
State:
$8,057
(% of AGI for various income ranges: 33.9% for AGIs below $25k, 68.9% for AGIs $25k-50k, 81.4% for AGIs $50k-75k, 101.0% for AGIs $75k-100k, 229.4% for AGIs $100k-200k, 1610.0% for AGIs over 200k)
Net capital gain/loss in AGI: +$10,364 (reported on 22.7% of returns)
Here:
+$10,364
State:
+$25,022
(% of AGI for various income ranges: 12.3% for AGIs below $25k, 39.1% for AGIs $25k-50k, 112.1% for AGIs $50k-75k, 97.1% for AGIs $75k-100k, 414.4% for AGIs $100k-200k, 7662.5% for AGIs over 200k)
Profit/loss from business: +$15,882 (reported on 15.5% of returns)
Here:
+$15,882
State:
+$18,035
(% of AGI for various income ranges: 169.3% for AGIs below $25k, 235.2% for AGIs $25k-50k, 183.7% for AGIs $50k-75k, 232.9% for AGIs $75k-100k, 486.5% for AGIs $100k-200k, 4362.5% for AGIs over 200k)
Taxable individual retirement arrangement distribution: $16,087 (reported on 9.7% of returns)
07403:
$16,087
New Jersey:
$21,558
(% of AGI for various income ranges: 89.3% for AGIs below $25k, 175.9% for AGIs $25k-50k, 179.3% for AGIs $50k-75k, 254.8% for AGIs $75k-100k, 456.1% for AGIs $100k-200k, 1000.0% for AGIs over 200k)
Self-employed (Keogh) retirement plans: $28,550 (reported on 0.5% of returns)
07403:
$28,550
New Jersey:
$30,844
(% of AGI for various income ranges: 105.7% for AGIs $100k-200k)
Total itemized deductions: $26,241 (reported on 15.2% of returns)
Here:
$26,241
State:
$32,863
(% of AGI for various income ranges: 194.3% for AGIs below $25k, 285.4% for AGIs $25k-50k, 520.0% for AGIs $50k-75k, 750.0% for AGIs $75k-100k, 1077.6% for AGIs $100k-200k, 3747.5% for AGIs over 200k)
Charity contributions: $4,092 (reported on 12.5% of returns)
Here:
$4,092
State:
$7,880
(% of AGI for various income ranges: 4.8% for AGIs below $25k, 22.6% for AGIs $25k-50k, 41.4% for AGIs $50k-75k, 80.6% for AGIs $75k-100k, 164.8% for AGIs $100k-200k, 723.8% for AGIs over 200k)
Taxes paid: $9,559 (reported on 15.2% of returns)
07403:
$9,559
State:
$9,183
(% of AGI for various income ranges: 56.8% for AGIs below $25k, 115.9% for AGIs $25k-50k, 216.3% for AGIs $50k-75k, 295.5% for AGIs $75k-100k, 393.7% for AGIs $100k-200k, 1143.8% for AGIs over 200k)
Earned income credit: $1,833 (reported on 6.7% of returns)
Here:
$1,833
State:
$2,148
(% of AGI for various income ranges: 53.4% for AGIs below $25k, 36.3% for AGIs $25k-50k)
Percentage of individuals using paid preparers for their 2020 taxes: 93.8%
Here:
94%
State:
92%
(% for various income ranges: 91.6% for AGIs below $25k, 92.2% for AGIs $25k-50k, 95.2% for AGIs $50k-75k, 95.8% for AGIs $75k-100k, 94.6% for AGIs $100k-200k, 96.2% for AGIs over 200k)
Averages for the 2012 tax year for zip code 07403, filed in 2013:
Average Adjusted Gross Income (AGI) in 2012: $70,078 (Individual Income Tax Returns)
Here:
$70,078
State:
$79,688
Salary/wage: $65,448 (reported on 84.9% of returns)
Here:
$65,448
State:
$68,122
(% of AGI for various income ranges: 69.1% for AGIs below $25k, 73.4% for AGIs $25k-50k, 75.3% for AGIs $50k-75k, 81.5% for AGIs $75k-100k, 84.5% for AGIs $100k-200k, 75.1% for AGIs over 200k)
Taxable interest for individuals: $877 (reported on 42.7% of returns)
This zip code:
$877
New Jersey:
$2,193
(% of AGI for various income ranges: 1.6% for AGIs below $25k, 0.6% for AGIs $25k-50k, 0.7% for AGIs $50k-75k, 0.6% for AGIs $75k-100k, 0.3% for AGIs $100k-200k, 0.5% for AGIs over 200k)
Ordinary dividends: $2,546 (reported on 29.2% of returns)
Here:
$2,546
State:
$6,828
(% of AGI for various income ranges: 1.9% for AGIs below $25k, 1.2% for AGIs $25k-50k, 1.2% for AGIs $50k-75k, 1.1% for AGIs $75k-100k, 0.9% for AGIs $100k-200k, 1.1% for AGIs over 200k)
Net capital gain/loss in AGI: +$1,400 (reported on 18.6% of returns)
Here:
+$1,400
State:
+$15,358
(% of AGI for various income ranges: 0.2% for AGIs $50k-75k, 0.3% for AGIs $75k-100k, 0.5% for AGIs $100k-200k, 0.6% for AGIs over 200k)
Profit/loss from business: +$16,022 (reported on 13.5% of returns)
Here:
+$16,022
State:
+$19,577
(% of AGI for various income ranges: 7.1% for AGIs below $25k, 4.0% for AGIs $25k-50k, 3.3% for AGIs $50k-75k, 2.3% for AGIs $75k-100k, 2.3% for AGIs $100k-200k, 3.6% for AGIs over 200k)
Taxable individual retirement arrangement distribution: $14,395 (reported on 11.9% of returns)
07403:
$14,395
New Jersey:
$18,214
(% of AGI for various income ranges: 4.7% for AGIs below $25k, 3.2% for AGIs $25k-50k, 2.6% for AGIs $50k-75k, 1.7% for AGIs $75k-100k, 3.3% for AGIs $100k-200k)
Self-employment retirement plans: $14,800 (reported on 0.8% of returns)
07403:
$14,800
New Jersey:
$24,511
Total itemized deductions: $25,457 (24% of AGI, reported on 51.1% of returns)
Here:
$25,457
State:
$30,827
Here:
24.0% of AGI
State:
21.2% of AGI
(% of AGI for various income ranges: 20.6% for AGIs below $25k, 17.0% for AGIs $25k-50k, 18.0% for AGIs $50k-75k, 19.3% for AGIs $75k-100k, 19.4% for AGIs $100k-200k, 16.8% for AGIs over 200k)
Charity contributions: $2,099 (reported on 43.2% of returns)
Here:
$2,099
State:
$3,451
(% of AGI for various income ranges: 0.8% for AGIs below $25k, 0.9% for AGIs $25k-50k, 1.1% for AGIs $50k-75k, 1.5% for AGIs $75k-100k, 1.3% for AGIs $100k-200k, 1.5% for AGIs over 200k)
Taxes paid: $13,583 (reported on 51.1% of returns)
07403:
$13,583
State:
$15,801
(% of AGI for various income ranges: 9.8% for AGIs below $25k, 8.2% for AGIs $25k-50k, 9.1% for AGIs $50k-75k, 9.9% for AGIs $75k-100k, 10.5% for AGIs $100k-200k, 10.2% for AGIs over 200k)
Earned income credit: $1,688 (reported on 6.5% of returns)
Here:
$1,688
State:
$2,182
(% of AGI for various income ranges: 2.3% for AGIs below $25k, 0.4% for AGIs $25k-50k)
Percentage of individuals using paid preparers for their 2012 taxes: 63.2%
Here:
63%
State:
65%
(% for various income ranges: 59.1% for AGIs below $25k, 60.0% for AGIs $25k-50k, 63.8% for AGIs $50k-75k, 65.9% for AGIs $75k-100k, 68.8% for AGIs $100k-200k, 71.4% for AGIs over 200k)
Averages for the 2004 tax year for zip code 07403, filed in 2005:
Average Adjusted Gross Income (AGI) in 2004: $58,256 (Individual Income Tax Returns)
Here:
$58,256
State:
$64,921
Salary/wage: $55,505 (reported on 86.5% of returns)
Here:
$55,505
State:
$57,755
(% of AGI for various income ranges: 105.8% for AGIs below $10k, 66.7% for AGIs $10k-25k, 81.1% for AGIs $25k-50k, 82.2% for AGIs $50k-75k, 85.9% for AGIs $75k-100k, 82.3% for AGIs over 100k)
Taxable interest for individuals: $1,106 (reported on 60.8% of returns)
This zip code:
$1,106
New Jersey:
$2,068
(% of AGI for various income ranges: 8.1% for AGIs below $10k, 2.8% for AGIs $10k-25k, 1.4% for AGIs $25k-50k, 1.0% for AGIs $50k-75k, 0.7% for AGIs $75k-100k, 1.1% for AGIs over 100k)
Taxable dividends: $1,727 (reported on 34.8% of returns)
Here:
$1,727
State:
$3,959
(% of AGI for various income ranges: 6.8% for AGIs below $10k, 2.3% for AGIs $10k-25k, 1.0% for AGIs $25k-50k, 0.8% for AGIs $50k-75k, 0.7% for AGIs $75k-100k, 1.0% for AGIs over 100k)
Net capital gain/loss: +$3,884 (reported on 24.0% of returns)
Here:
+$3,884
State:
+$13,591
(% of AGI for various income ranges: -4.0% for AGIs below $10k, -1.0% for AGIs $10k-25k, -0.1% for AGIs $25k-50k, 0.1% for AGIs $50k-75k, 0.9% for AGIs $75k-100k, 3.6% for AGIs over 100k)
Profit/loss from business: +$14,862 (reported on 13.1% of returns)
Here:
+$14,862
State:
+$17,520
(% of AGI for various income ranges: 9.4% for AGIs below $10k, 7.2% for AGIs $10k-25k, 3.6% for AGIs $25k-50k, 3.7% for AGIs $50k-75k, 3.2% for AGIs $75k-100k, 2.6% for AGIs over 100k)
IRA payment deduction: $3,200 (reported on 3.5% of returns)
07403:
$3,200
New Jersey:
$3,270
(% of AGI for various income ranges: 0.4% for AGIs $25k-50k, 0.3% for AGIs $50k-75k, 0.2% for AGIs $75k-100k, 0.1% for AGIs over 100k)
Self-employed pension: $10,107 (reported on 0.8% of returns)
Here:
$10,107
New Jersey:
$17,258
Total itemized deductions: $20,016 (24% of AGI, reported on 53.5% of returns)
Here:
$20,016
State:
$23,924
Here:
23.8% of AGI
State:
21.1% of AGI
(% of AGI for various income ranges: 35.7% for AGIs below $10k, 19.9% for AGIs $10k-25k, 16.0% for AGIs $25k-50k, 19.9% for AGIs $50k-75k, 21.0% for AGIs $75k-100k, 16.8% for AGIs over 100k)
Charity contributions deductions: $1,967 (2% of AGI, reported on 49.6% of returns)
Here:
$1,967
State:
$3,242
Here:
2.3% of AGI
State:
2.7% of AGI
(% of AGI for various income ranges: 1.4% for AGIs below $10k, 1.2% for AGIs $10k-25k, 1.5% for AGIs $25k-50k, 1.8% for AGIs $50k-75k, 1.8% for AGIs $75k-100k, 1.7% for AGIs over 100k)
Total tax: $8,165 (reported on 83.9% of returns)
07403:
$8,165
State:
$12,321
(% of AGI for various income ranges: 3.7% for AGIs below $10k, 4.8% for AGIs $10k-25k, 8.2% for AGIs $25k-50k, 9.7% for AGIs $50k-75k, 9.7% for AGIs $75k-100k, 15.8% for AGIs over 100k)
Earned income credit: $1,161 (reported on 5.3% of returns)
Here:
$1,161
State:
$1,711
Percentage of individuals using paid preparers for their 2004 taxes: 62.5%
Here:
62%
State:
65%
(% for various income ranges: 54.3% for AGIs below $10k, 61.0% for AGIs $10k-25k, 61.2% for AGIs $25k-50k, 64.6% for AGIs $50k-75k, 63.9% for AGIs $75k-100k, 69.7% for AGIs over 100k)
Likely homosexual households (counted as self-reported same-sex unmarried-partner households)
Lesbian couples: 1.2% of all households
Gay men: 0.0% of all households
Household received Food Stamps/SNAP in the past 12 months: 283 Household did not receive Food Stamps/SNAP in the past 12 months: 2,732
Women who had a birth in the past 12 months: 100 (88 now married, 13 unmarried) Women who did not have a birth in the past 12 months: 2,005 (951 now married, 1,052 unmarried)
Housing units in zip code 07403 with a mortgage: 1,412 (101 second mortgage, 90 both second mortgage and home equity loan) Houses without a mortgage: 138
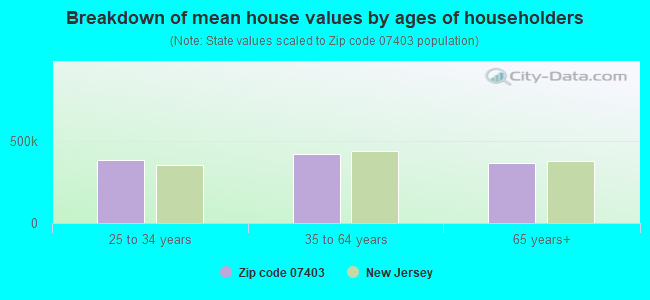
Median monthly owner costs for units with a mortgage: $2,412 Median monthly owner costs for units without a mortgage: $1,367
Residents with income below the poverty level in 2022:
This zip code:
9.1%
Whole state:
9.7%
Residents with income below 50% of the poverty level in 2022:
This zip code:
8.1%
Whole state:
5.2%
Median number of rooms in houses and condos:
Here:
6.7
State:
6.8
Median number of rooms in apartments:
Here:
4.1
State:
3.9
Notable locations in this zip code not listed on our city pages
Notable locations in zip code 07403: Bloomingdale Fire Department Station 2 (A), Bloomingdale Fire Department Main Station (B). Display/hide their locations on the map
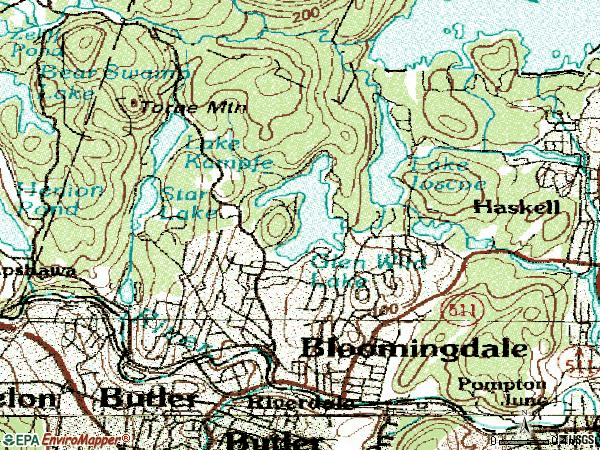
Lakes and reservoirs: Twilliger Lake (A), Bogues Pond (B), Lake Kampfe (C), Upper Morse Lake (D), Lake Iosco (E), Lower Morse Lake (F), Star Lake (G), Glen Wild Lake (H). Display/hide their locations on the map
In group quarters: 104 (-1 institutionalized population)
Size of family households: 796 2-persons, 471 3-persons, 329 4-persons, 191 5-persons, 189 6-persons
Size of nonfamily households: 896 1-person, 140 2-persons
1,261 married couples with children.
83 single-parent households (83 women).
75.2% of residents of 07403 zip code speak English at home.
10.7% of residents speak Spanish at home (67% very well, 7% well, 15% not well, 10% not at all).
2.4% of residents speak other Indo-European language at home (50% very well, 44% well, 7% not well).
2.0% of residents speak Asian or Pacific Island language at home (64% very well, 15% well, 21% not at all).
9.3% of residents speak other language at home (88% very well, 12% not well).
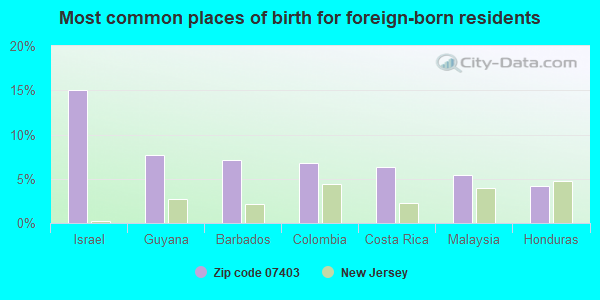
Foreign born population: 1,260 (16.3%) (71.4% of them are naturalized citizens)
This zip code:
16.3%
Whole state:
23.5%
15%Israel
8%Guyana
7%Barbados
7%Colombia
6%Costa Rica
5%Malaysia
4%Honduras
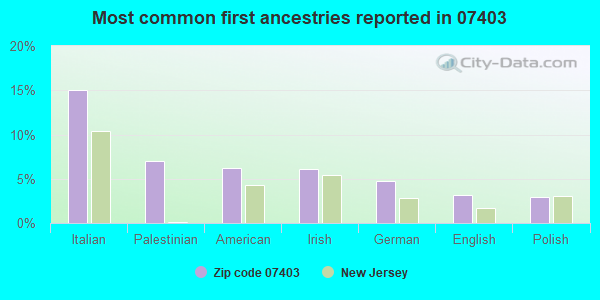
15%Italian
7%Palestinian
6%American
6%Irish
5%German
3%English
3%Polish
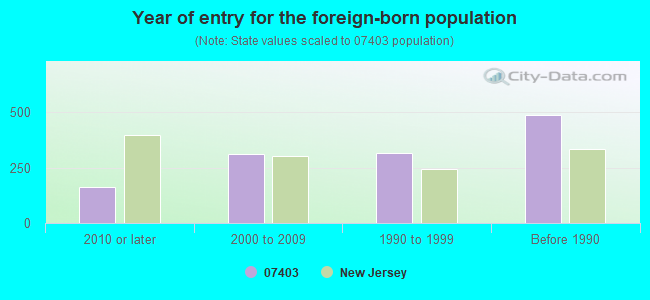
Year of entry for the foreign-born population
1612010 or later
3092000 to 2009
3171990 to 1999
487Before 1990
Facilities with environmental interests located in this zip code:
BLOOMINGDALE BD OF ED WALTER T BERGEN SCHOOL (GLENWILD AVENUE AND ROY DRIVE in BLOOMINGDALE, NJ)
(National Center for Education Statistics) - STATE ID-050 STATE MASTER (New Jersey environmental info) - NJEMS-009328, STATE CLEANUP SITE, NJEMS-31040, AIR PROGRAM, NJEMS-0420-050-31, PESTICIDES - APPLICATION (Resource Conservation and Recovery Act (tracking hazardous waste)) Business SIC classification: ELEMENTARY AND SECONDARY SCHOOLS Organizations: BLOOMINGDALE BORO BD OF ED, BLOOMINGDALE BORO (SCHOOL DISTRICT)
Alternative names: BLOOMINGDALE BD OF ED - WALTER T BERGEN, BLOOMINGDALE BOARD OF EDUCATION
BLOOMINGDALE BD OF ED MARTHA B DAY ELEMENTARY SCHOOL (RAFKIND RD in BLOOMINGDALE BORO, NJ)
(National Center for Education Statistics) - STATE ID-020 STATE MASTER (New Jersey environmental info) - NJEMS-009329, STATE CLEANUP SITE, NJEMS-31175, AIR PROGRAM, NJEMS-0420-020-31, PESTICIDES - APPLICATION Organizations: BLOOMINGDALE BORO BD OF ED, BLOOMINGDALE BORO (SCHOOL DISTRICT)
STATE MASTER (New Jersey environmental info) - NJEMS-1304, MINERAL EXPLORATION, NJEMS-1601-03-0001.1, LAND USE - COASTAL AND LAND USE, NJEMS-1601001, DRINKING WATER PROGRAM, NJEMS-168128, National Pollutant Discharge Elimination System Permit, NJEMS-198731, REFUSE DISPOSAL, NJEMS-G000029096, STATE CLEANUP SITE National Pollutant Discharge Elimination System NON-MAJOR (Tracking pollutant discharge elimination systems) - permit
3 GS AUTO BODY (84 MAIN ST in BLOOMINGDALE, NJ)
STATE MASTER (New Jersey environmental info) - NJEMS-G3060, AIR PROGRAM (Resource Conservation and Recovery Act (tracking hazardous waste)) Organizations: 3 G S AUTO BODY Alternative names: 3 G S AUTO BODY INC
ALFREDS AUTO BODY REPAIR (111 MAIN ST in BLOOMINGDALE, NJ)
(Resource Conservation and Recovery Act (tracking hazardous waste))
AUTOMOTIVE WASTE INDUSTRIES (33.5 MAIN ST in BLOOMINGDALE, NJ)
Conditionally Exempt Small Quantity Generators, less than 100 kg/month of hazardous waste (Resource Conservation and Recovery Act (tracking hazardous waste)) - notification TRANSPORTER (Resource Conservation and Recovery Act (tracking hazardous waste)) - notification Organizations: KENNETH A MARTIN (CONTACT/OWNER)
BLOOMINGDALE DEAN SERVICE (10 MAIN ST in BLOOMINGDALE, NJ)
(Resource Conservation and Recovery Act (tracking hazardous waste))
BLOOMINGDALE PRINTING LAM INC (129 HAMBURG TNPK in BLOOMINGDALE, NJ)
(Resource Conservation and Recovery Act (tracking hazardous waste))
FRANKLIN LAUNDROMAT (169 PINE TREE ROAD in BLOOMINGDALE, NJ)
AIR MINOR (AIRS/AFS) Business SIC classification: DRYCLEANING PLANTS, EXCEPT RUG CLEANING
BLOOMINGDALE BOARD OF EDUCATION (31 CAPTOLENE AVENUE in BLOOMINGDALE, NJ)
COMPLIANCE ACTIVITY (Tracking inspections of insecticide, fungicide, and rodenticide, and toxic substances) Alternative names: BLOOMINGDALE BD OF ED
71.6%Utility gas
11.2%Electricity
5.7%Fuel oil, kerosene, etc.
4.7%Bottled, tank, or LP gas
3.7%Wood
2.0%Coal or coke
0.8%No fuel used
Population in 1990: 7,520. Population change in the 1990s: +47 (+0.6%).
Place of birth for U.S.-born residents:
This state: 5,131
Northeast: 843
Midwest: 105
South: 139
West: 161
65% of the 07403 zip code residents lived in the same house 5 years ago. Out of people who lived in different houses, 47% lived in this county. Out of people who lived in different counties, 50% lived in New Jersey.
88% of the 07403 zip code residents lived in the same house 1 year ago. Out of people who lived in different houses, 26% moved from this county. Out of people who lived in different houses, 54% moved from different county within same state. Out of people who lived in different houses, 16% moved from different state.
Private vs. public school enrollment:
Students in private schools in grades 1 to 8 (elementary and middle school):
Here:
0.0%
New Jersey:
12.3%
Students in private schools in grades 9 to 12 (high school): 21
Here:
6.2%
New Jersey:
13.1%
Students in private undergraduate colleges: 159
Here:
38.1%
New Jersey:
33.2%
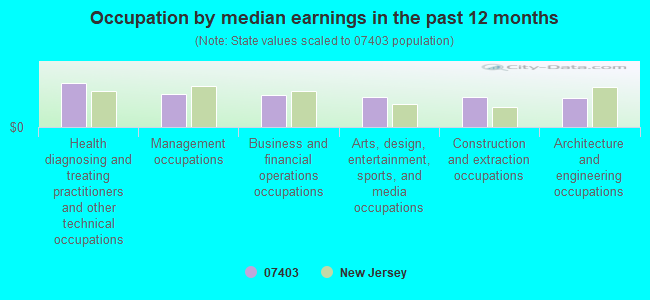
Occupation by median earnings in the past 12 months ($)
128,265Health diagnosing and treating practitioners and other technical occupations
95,412Management occupations
94,721Business and financial operations occupations
86,531Arts, design, entertainment, sports, and media occupations
86,194Construction and extraction occupations
84,906Architecture and engineering occupations
Companies with federal contracts located in this zip code:
OPEN ACCESS SYSTEMS CORP (56 MAIN ST in BLOOMINGDALE, NJ; small business) : $21,565 in 5 contractsfrom 2002 to 2005
Contracts for Switches, Training Aids, Other ADP and Telecommunications Services (includes data storage on tapes, compact disks, etc.), ADP Software, and moreby Navy, Department of Defense, Army Signed by year:2000: $0; 2001: $0; 2002: $2,700; 2003: $0; 2004: $5,640; 2005: $13,225; 2006: $0.
Biggest contracts:
$5,640 with Navy for Switches. Signed on 2004-10-20. Completion date: 2004-10-29.
$5,590 with Navy for Training Aids. Taking place in OH. Signed on 2005-09-02. Completion date: 2005-09-30.
$4,500 with Department of Defense for Other ADP and Telecommunications Services (includes data storage on tapes, compact disks, etc.). Taking place in IL. Signed on 2005-09-29. Completion date: 2006-09-30.
$3,135 with Navy for ADP Software. Signed on 2005-09-22. Completion date: 2005-09-27.
Top industries in this zip code by the number of employees in 2005:
Health Care and Social Assistance: Nursing Care Facilities (100-249 employees: 1 establishment)
Health Care and Social Assistance: Child Day Care Services (50-99: 1, 10-19: 1, 5-9: 1)
Construction: Plumbing, Heating, and Air-Conditioning Contractors (5-9: 3, 1-4: 7)
Administrative and Support and Waste Management and Remediation Services: Janitorial Services (20-49: 1, 1-4: 1)
Professional, Scientific, and Technical Services: Veterinary Services (20-49: 1)
Finance and Insurance: Commercial Banking (10-19: 1, 5-9: 1)
People in group quarters in 2010:
116 people in nursing facilities/skilled-nursing facilities
5 people in group homes intended for adults
People in group quarters in 2000:
116 people in nursing homes
6 people in other noninstitutional group quarters
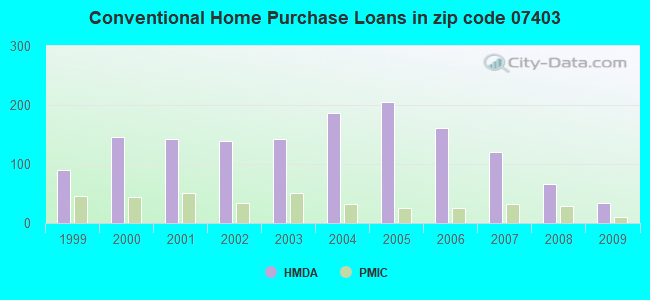
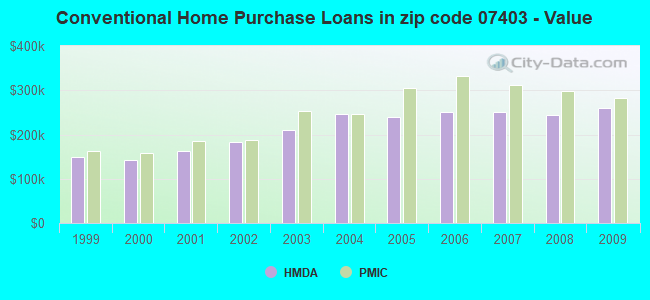
Home Mortgage Disclosure Act Aggregated Statistics For Year 2009 (Based on 2 partial tracts)
A) FHA, FSA/RHS & VA Home Purchase Loans
B) Conventional Home Purchase Loans
C) Refinancings
D) Home Improvement Loans
F) Non-occupant Loans on < 5 Family Dwellings (A B C & D)
Number
Average Value
Number
Average Value
Number
Average Value
Number
Average Value
Number
Average Value
LOANS ORIGINATED
42
$283,873
34
$259,695
261
$233,787
16
$137,780
3
$245,430
APPLICATIONS APPROVED, NOT ACCEPTED
1
$283,980
7
$239,436
26
$242,484
1
$2,930
1
$329,360
APPLICATIONS DENIED
0
$0
7
$336,674
111
$281,063
9
$67,986
4
$227,988
APPLICATIONS WITHDRAWN
9
$283,977
4
$264,215
56
$267,013
7
$190,713
0
$0
FILES CLOSED FOR INCOMPLETENESS
4
$294,955
3
$241,040
26
$259,374
4
$120,762
0
$0
Aggregated Statistics For Year 2008 (Based on 2 partial tracts)
A) FHA, FSA/RHS & VA Home Purchase Loans
B) Conventional Home Purchase Loans
C) Refinancings
D) Home Improvement Loans
F) Non-occupant Loans on < 5 Family Dwellings (A B C & D)
Number
Average Value
Number
Average Value
Number
Average Value
Number
Average Value
Number
Average Value
LOANS ORIGINATED
16
$303,830
66
$243,723
143
$249,174
31
$42,120
6
$170,777
APPLICATIONS APPROVED, NOT ACCEPTED
1
$401,080
10
$206,249
47
$235,205
7
$30,530
0
$0
APPLICATIONS DENIED
1
$679,200
7
$305,516
111
$304,088
23
$69,053
1
$487,450
APPLICATIONS WITHDRAWN
0
$0
4
$366,315
40
$266,668
4
$126,618
3
$267,387
FILES CLOSED FOR INCOMPLETENESS
0
$0
1
$512,330
13
$278,685
1
$117,100
0
$0
Aggregated Statistics For Year 2007 (Based on 2 partial tracts)
A) FHA, FSA/RHS & VA Home Purchase Loans
B) Conventional Home Purchase Loans
C) Refinancings
D) Home Improvement Loans
E) Loans on Dwellings For 5+ Families
F) Non-occupant Loans on < 5 Family Dwellings (A B C & D)
Number
Average Value
Number
Average Value
Number
Average Value
Number
Average Value
Number
Average Value
Number
Average Value
LOANS ORIGINATED
3
$277,633
121
$250,032
214
$221,800
59
$73,165
6
$307,398
10
$255,140
APPLICATIONS APPROVED, NOT ACCEPTED
1
$458,170
13
$163,945
67
$205,172
25
$156,627
0
$0
1
$226,890
APPLICATIONS DENIED
0
$0
19
$248,692
107
$289,285
23
$67,844
0
$0
1
$297,150
APPLICATIONS WITHDRAWN
1
$317,640
15
$270,705
56
$260,191
9
$190,944
0
$0
3
$125,887
FILES CLOSED FOR INCOMPLETENESS
0
$0
3
$293,247
28
$299,922
0
$0
0
$0
1
$234,210
Aggregated Statistics For Year 2006 (Based on 2 partial tracts)
A) FHA, FSA/RHS & VA Home Purchase Loans
B) Conventional Home Purchase Loans
C) Refinancings
D) Home Improvement Loans
F) Non-occupant Loans on < 5 Family Dwellings (A B C & D)
G) Loans On Manufactured Home Dwelling (A B C & D)
Number
Average Value
Number
Average Value
Number
Average Value
Number
Average Value
Number
Average Value
Number
Average Value
LOANS ORIGINATED
4
$324,598
161
$250,555
283
$224,468
82
$86,079
19
$233,977
0
$0
APPLICATIONS APPROVED, NOT ACCEPTED
0
$0
25
$217,696
50
$188,742
22
$60,215
4
$194,320
0
$0
APPLICATIONS DENIED
0
$0
23
$277,167
121
$265,129
22
$128,815
9
$235,183
1
$696,770
APPLICATIONS WITHDRAWN
1
$490,370
22
$270,204
73
$290,434
6
$51,233
1
$440,600
0
$0
FILES CLOSED FOR INCOMPLETENESS
0
$0
1
$417,180
28
$341,850
1
$21,960
3
$290,320
0
$0
Aggregated Statistics For Year 2005 (Based on 2 partial tracts)
A) FHA, FSA/RHS & VA Home Purchase Loans
B) Conventional Home Purchase Loans
C) Refinancings
D) Home Improvement Loans
E) Loans on Dwellings For 5+ Families
F) Non-occupant Loans on < 5 Family Dwellings (A B C & D)
Number
Average Value
Number
Average Value
Number
Average Value
Number
Average Value
Number
Average Value
Number
Average Value
LOANS ORIGINATED
3
$279,587
205
$239,371
340
$222,054
64
$74,722
1
$439,140
32
$283,382
APPLICATIONS APPROVED, NOT ACCEPTED
0
$0
19
$288,677
57
$196,766
7
$64,199
0
$0
1
$708,480
APPLICATIONS DENIED
0
$0
20
$220,448
123
$249,227
31
$53,264
0
$0
9
$200,866
APPLICATIONS WITHDRAWN
1
$453,780
40
$259,678
104
$221,400
18
$166,873
0
$0
4
$312,888
FILES CLOSED FOR INCOMPLETENESS
0
$0
3
$230,793
57
$266,694
1
$87,830
0
$0
0
$0
Aggregated Statistics For Year 2004 (Based on 2 partial tracts)
A) FHA, FSA/RHS & VA Home Purchase Loans
B) Conventional Home Purchase Loans
C) Refinancings
D) Home Improvement Loans
E) Loans on Dwellings For 5+ Families
F) Non-occupant Loans on < 5 Family Dwellings (A B C & D)
G) Loans On Manufactured Home Dwelling (A B C & D)
Number
Average Value
Number
Average Value
Number
Average Value
Number
Average Value
Number
Average Value
Number
Average Value
Number
Average Value
LOANS ORIGINATED
7
$249,264
187
$245,903
331
$189,715
48
$80,296
6
$356,923
18
$215,667
1
$124,420
APPLICATIONS APPROVED, NOT ACCEPTED
0
$0
32
$225,837
64
$185,628
12
$48,549
0
$0
3
$208,347
1
$74,650
APPLICATIONS DENIED
1
$338,140
22
$218,971
113
$209,427
41
$59,659
0
$0
4
$205,665
0
$0
APPLICATIONS WITHDRAWN
1
$406,940
26
$209,943
82
$208,127
7
$72,771
1
$585,520
7
$282,513
0
$0
FILES CLOSED FOR INCOMPLETENESS
0
$0
1
$60,020
32
$222,955
4
$32,935
0
$0
0
$0
0
$0
Aggregated Statistics For Year 2003 (Based on 2 partial tracts)
A) FHA, FSA/RHS & VA Home Purchase Loans
B) Conventional Home Purchase Loans
C) Refinancings
D) Home Improvement Loans
F) Non-occupant Loans on < 5 Family Dwellings (A B C & D)
Number
Average Value
Number
Average Value
Number
Average Value
Number
Average Value
Number
Average Value
LOANS ORIGINATED
9
$240,713
143
$210,726
812
$165,301
66
$63,010
20
$214,886
APPLICATIONS APPROVED, NOT ACCEPTED
4
$252,140
22
$259,093
102
$141,328
18
$58,146
7
$216,433
APPLICATIONS DENIED
1
$223,960
10
$172,728
176
$190,435
35
$37,975
3
$281,537
APPLICATIONS WITHDRAWN
0
$0
20
$209,616
73
$172,428
9
$86,852
6
$142,720
FILES CLOSED FOR INCOMPLETENESS
0
$0
3
$123,937
15
$162,677
1
$36,590
0
$0
Aggregated Statistics For Year 2002 (Based on 2 partial tracts)
A) FHA, FSA/RHS & VA Home Purchase Loans
B) Conventional Home Purchase Loans
C) Refinancings
D) Home Improvement Loans
E) Loans on Dwellings For 5+ Families
F) Non-occupant Loans on < 5 Family Dwellings (A B C & D)
Number
Average Value
Number
Average Value
Number
Average Value
Number
Average Value
Number
Average Value
Number
Average Value
LOANS ORIGINATED
12
$180,902
139
$182,248
523
$158,088
81
$39,631
1
$2,012,720
16
$176,937
APPLICATIONS APPROVED, NOT ACCEPTED
3
$179,560
10
$171,996
95
$135,425
19
$60,247
0
$0
4
$204,932
APPLICATIONS DENIED
0
$0
9
$250,960
124
$145,140
31
$30,740
0
$0
3
$148,820
APPLICATIONS WITHDRAWN
0
$0
15
$179,462
94
$159,180
13
$84,562
0
$0
0
$0
FILES CLOSED FOR INCOMPLETENESS
0
$0
0
$0
47
$176,840
7
$40,777
0
$0
0
$0
Aggregated Statistics For Year 2001 (Based on 2 partial tracts)
A) FHA, FSA/RHS & VA Home Purchase Loans
B) Conventional Home Purchase Loans
C) Refinancings
D) Home Improvement Loans
F) Non-occupant Loans on < 5 Family Dwellings (A B C & D)
Number
Average Value
Number
Average Value
Number
Average Value
Number
Average Value
Number
Average Value
LOANS ORIGINATED
12
$150,893
142
$162,255
321
$142,600
59
$45,626
6
$134,913
APPLICATIONS APPROVED, NOT ACCEPTED
0
$0
15
$119,153
72
$100,392
13
$39,748
4
$25,982
APPLICATIONS DENIED
1
$319,110
4
$127,350
105
$125,929
32
$34,719
6
$103,198
APPLICATIONS WITHDRAWN
1
$207,860
6
$193,953
50
$151,035
13
$31,190
1
$257,630
FILES CLOSED FOR INCOMPLETENESS
0
$0
0
$0
32
$117,424
0
$0
0
$0
Aggregated Statistics For Year 2000 (Based on 2 partial tracts)
A) FHA, FSA/RHS & VA Home Purchase Loans
B) Conventional Home Purchase Loans
C) Refinancings
D) Home Improvement Loans
F) Non-occupant Loans on < 5 Family Dwellings (A B C & D)
Number
Average Value
Number
Average Value
Number
Average Value
Number
Average Value
Number
Average Value
LOANS ORIGINATED
20
$169,508
145
$142,786
88
$80,060
59
$35,851
12
$67,822
APPLICATIONS APPROVED, NOT ACCEPTED
6
$161,018
15
$134,377
42
$79,916
25
$31,735
3
$104,417
APPLICATIONS DENIED
1
$269,340
16
$151,138
70
$90,086
40
$23,933
0
$0
APPLICATIONS WITHDRAWN
3
$167,850
12
$140,525
48
$71,299
12
$48,428
3
$100,513
FILES CLOSED FOR INCOMPLETENESS
1
$212,250
4
$120,398
7
$111,876
1
$43,910
0
$0
Aggregated Statistics For Year 1999 (Based on 1 partial tract)
A) FHA, FSA/RHS & VA Home Purchase Loans
B) Conventional Home Purchase Loans
C) Refinancings
D) Home Improvement Loans
E) Loans on Dwellings For 5+ Families
F) Non-occupant Loans on < 5 Family Dwellings (A B C & D)
Detailed PMIC statistics for the following Tracts:1165.00
2002 - 2018 National Fire Incident Reporting System (NFIRS) incidents
Based on the data from the years 2002 - 2018 the average number of fires per year is 17. The highest number of reported fire incidents - 34 took place in 2005, and the least - 0 in 2003. The data has a rising trend.
When looking into fire subcategories, the most incidents belonged to: Structure Fires (54.4%), and Outside Fires (30.6%).
Fire incident types reported to NFIRS in Zip Code 07403


 Nearest zip codes: 07457, 07420, 07465, 07442, 07444, 07405.


 Based on the data from the years 2002 - 2018 the average number of fires per year is 17. The highest number of reported fire incidents - 34 took place in 2005, and the least - 0 in 2003. The data has a rising trend.
 When looking into fire subcategories, the most incidents belonged to: Structure Fires (54.4%), and Outside Fires (30.6%).