Estimated zip code population in 2022: 10,955 Zip code population in 2010: 11,046 Zip code population in 2000: 9,227
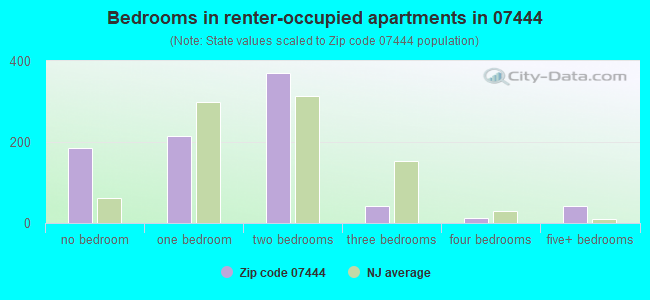
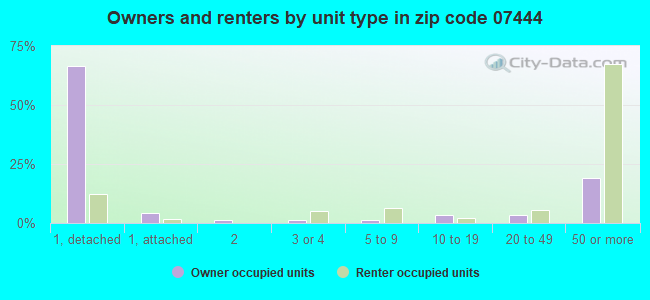
Houses and condos: 4,939 Renter-occupied apartments: 862
% of renters here:
18%
State:
35%
March 2022 cost of living index in zip code 07444: 119.0 (more than average, U.S. average is 100)
Land area: 5.2 sq. mi. Water area: 0.2 sq. mi.
Population density: 2,107 people per square mile
(low).
OSM Map
Google Map
MSN Map
OSM Map
General Map
Google Map
MSN Map
OSM Map
Google Map
MSN Map
OSM Map
Google Map
MSN Map
Please wait while loading the map...
Real estate property taxes paid for housing units in 2022:
This zip code:
1.6% ($8,404)
New Jersey:
2.1% ($8,897)
Median real estate property taxes paid for housing units with mortgages in 2022: $9,557 (1.6%) Median real estate property taxes paid for housing units with no mortgage in 2022: $6,751 (1.6%)
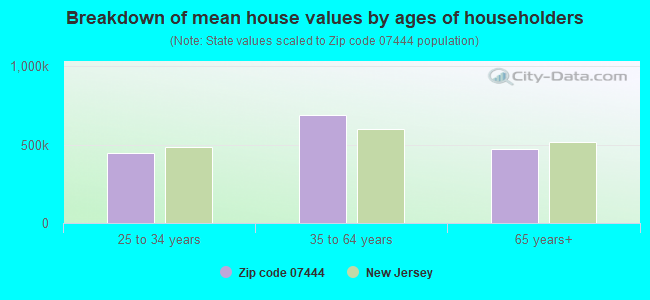
Estimated median house/condo value in 2022: $517,800
07444:
$517,800
New Jersey:
$428,900
Median resident age:
This zip code:
54.3 years
New Jersey median age:
40.4 years
Average household size:
This zip code:
2.2 people
New Jersey:
2.6 people
Averages for the 2020 tax year for zip code 07444, filed in 2021:
Average Adjusted Gross Income (AGI) in 2020: $105,237 (Individual Income Tax Returns)
Here:
$105,237
State:
$95,247
Salary/wage: $93,954 (reported on 66.5% of returns)
Here:
$93,954
State:
$80,635
(% of AGI for various income ranges: 1104.4% for AGIs below $25k, 3443.5% for AGIs $25k-50k, 5794.6% for AGIs $50k-75k, 8188.6% for AGIs $75k-100k, 17547.7% for AGIs $100k-200k, 75369.1% for AGIs over 200k)
Taxable interest for individuals: $2,251 (reported on 56.9% of returns)
This zip code:
$2,251
New Jersey:
$2,414
(% of AGI for various income ranges: 88.3% for AGIs below $25k, 126.1% for AGIs $25k-50k, 169.2% for AGIs $50k-75k, 246.9% for AGIs $75k-100k, 352.0% for AGIs $100k-200k, 1020.0% for AGIs over 200k)
Ordinary dividends: $9,987 (reported on 48.2% of returns)
Here:
$9,987
State:
$8,057
(% of AGI for various income ranges: 162.8% for AGIs below $25k, 330.4% for AGIs $25k-50k, 551.0% for AGIs $50k-75k, 672.0% for AGIs $75k-100k, 1246.9% for AGIs $100k-200k, 5463.9% for AGIs over 200k)
Net capital gain/loss in AGI: +$12,715 (reported on 41.8% of returns)
Here:
+$12,715
State:
+$25,022
(% of AGI for various income ranges: 43.0% for AGIs below $25k, 99.1% for AGIs $25k-50k, 272.3% for AGIs $50k-75k, 425.4% for AGIs $75k-100k, 1038.2% for AGIs $100k-200k, 9332.2% for AGIs over 200k)
Profit/loss from business: +$25,090 (reported on 14.2% of returns)
Here:
+$25,090
State:
+$18,035
(% of AGI for various income ranges: 101.7% for AGIs below $25k, 245.9% for AGIs $25k-50k, 306.5% for AGIs $50k-75k, 629.4% for AGIs $75k-100k, 863.1% for AGIs $100k-200k, 4314.8% for AGIs over 200k)
Taxable individual retirement arrangement distribution: $24,009 (reported on 21.1% of returns)
07444:
$24,009
New Jersey:
$21,558
(% of AGI for various income ranges: 169.8% for AGIs below $25k, 401.9% for AGIs $25k-50k, 726.7% for AGIs $50k-75k, 1045.4% for AGIs $75k-100k, 1716.9% for AGIs $100k-200k, 3516.1% for AGIs over 200k)
Self-employed (Keogh) retirement plans: $25,838 (reported on 1.3% of returns)
07444:
$25,838
New Jersey:
$30,844
(% of AGI for various income ranges: 97.9% for AGIs $100k-200k, 596.5% for AGIs over 200k)
Total itemized deductions: $35,376 (reported on 23.2% of returns)
Here:
$35,376
State:
$32,863
(% of AGI for various income ranges: 323.6% for AGIs below $25k, 690.9% for AGIs $25k-50k, 1125.8% for AGIs $50k-75k, 1538.6% for AGIs $75k-100k, 2252.5% for AGIs $100k-200k, 7478.3% for AGIs over 200k)
Charity contributions: $6,371 (reported on 20.4% of returns)
Here:
$6,371
State:
$7,880
(% of AGI for various income ranges: 15.6% for AGIs below $25k, 49.8% for AGIs $25k-50k, 118.7% for AGIs $50k-75k, 155.7% for AGIs $75k-100k, 280.0% for AGIs $100k-200k, 1932.6% for AGIs over 200k)
Taxes paid: $8,762 (reported on 23.0% of returns)
07444:
$8,762
State:
$9,183
(% of AGI for various income ranges: 89.7% for AGIs below $25k, 174.6% for AGIs $25k-50k, 298.8% for AGIs $50k-75k, 443.4% for AGIs $75k-100k, 620.0% for AGIs $100k-200k, 1447.8% for AGIs over 200k)
Earned income credit: $1,485 (reported on 3.3% of returns)
Here:
$1,485
State:
$2,148
(% of AGI for various income ranges: 25.5% for AGIs below $25k, 24.8% for AGIs $25k-50k)
Percentage of individuals using paid preparers for their 2020 taxes: 91.7%
Here:
92%
State:
92%
(% for various income ranges: 89.4% for AGIs below $25k, 92.5% for AGIs $25k-50k, 92.5% for AGIs $50k-75k, 91.3% for AGIs $75k-100k, 91.9% for AGIs $100k-200k, 93.4% for AGIs over 200k)
Averages for the 2012 tax year for zip code 07444, filed in 2013:
Average Adjusted Gross Income (AGI) in 2012: $92,404 (Individual Income Tax Returns)
Here:
$92,404
State:
$79,688
Salary/wage: $88,281 (reported on 66.6% of returns)
Here:
$88,281
State:
$68,122
(% of AGI for various income ranges: 53.8% for AGIs below $25k, 52.1% for AGIs $25k-50k, 51.1% for AGIs $50k-75k, 52.4% for AGIs $75k-100k, 68.6% for AGIs $100k-200k, 68.7% for AGIs over 200k)
Taxable interest for individuals: $2,459 (reported on 64.6% of returns)
This zip code:
$2,459
New Jersey:
$2,193
(% of AGI for various income ranges: 5.0% for AGIs below $25k, 2.8% for AGIs $25k-50k, 2.1% for AGIs $50k-75k, 2.1% for AGIs $75k-100k, 1.2% for AGIs $100k-200k, 1.5% for AGIs over 200k)
Ordinary dividends: $7,879 (reported on 49.8% of returns)
Here:
$7,879
State:
$6,828
(% of AGI for various income ranges: 8.3% for AGIs below $25k, 6.3% for AGIs $25k-50k, 5.3% for AGIs $50k-75k, 5.0% for AGIs $75k-100k, 3.5% for AGIs $100k-200k, 3.8% for AGIs over 200k)
Net capital gain/loss in AGI: +$7,864 (reported on 38.7% of returns)
Here:
+$7,864
State:
+$15,358
(% of AGI for various income ranges: 0.4% for AGIs $50k-75k, 1.1% for AGIs $75k-100k, 1.3% for AGIs $100k-200k, 7.6% for AGIs over 200k)
Profit/loss from business: +$25,753 (reported on 12.7% of returns)
Here:
+$25,753
State:
+$19,577
(% of AGI for various income ranges: 6.2% for AGIs below $25k, 4.0% for AGIs $25k-50k, 2.5% for AGIs $50k-75k, 2.9% for AGIs $75k-100k, 3.3% for AGIs $100k-200k, 4.0% for AGIs over 200k)
Taxable individual retirement arrangement distribution: $19,033 (reported on 26.2% of returns)
07444:
$19,033
New Jersey:
$18,214
(% of AGI for various income ranges: 10.1% for AGIs below $25k, 6.5% for AGIs $25k-50k, 7.2% for AGIs $50k-75k, 7.2% for AGIs $75k-100k, 5.7% for AGIs $100k-200k, 3.5% for AGIs over 200k)
Self-employment retirement plans: $19,186 (reported on 1.2% of returns)
07444:
$19,186
New Jersey:
$24,511
Total itemized deductions: $29,578 (23% of AGI, reported on 60.8% of returns)
Here:
$29,578
State:
$30,827
Here:
22.6% of AGI
State:
21.2% of AGI
(% of AGI for various income ranges: 39.9% for AGIs below $25k, 24.4% for AGIs $25k-50k, 20.4% for AGIs $50k-75k, 20.7% for AGIs $75k-100k, 20.1% for AGIs $100k-200k, 15.5% for AGIs over 200k)
Charity contributions: $3,416 (reported on 53.6% of returns)
Here:
$3,416
State:
$3,451
(% of AGI for various income ranges: 1.8% for AGIs below $25k, 1.8% for AGIs $25k-50k, 1.6% for AGIs $50k-75k, 2.1% for AGIs $75k-100k, 1.6% for AGIs $100k-200k, 2.4% for AGIs over 200k)
Taxes paid: $14,250 (reported on 60.8% of returns)
07444:
$14,250
State:
$15,801
(% of AGI for various income ranges: 14.8% for AGIs below $25k, 9.0% for AGIs $25k-50k, 8.1% for AGIs $50k-75k, 8.9% for AGIs $75k-100k, 9.5% for AGIs $100k-200k, 9.3% for AGIs over 200k)
Earned income credit: $1,287 (reported on 3.8% of returns)
Here:
$1,287
State:
$2,182
(% of AGI for various income ranges: 1.1% for AGIs below $25k, 0.3% for AGIs $25k-50k)
Percentage of individuals using paid preparers for their 2012 taxes: 68.0%
Here:
68%
State:
65%
(% for various income ranges: 60.5% for AGIs below $25k, 67.0% for AGIs $25k-50k, 70.9% for AGIs $50k-75k, 73.6% for AGIs $75k-100k, 70.4% for AGIs $100k-200k, 76.1% for AGIs over 200k)
Averages for the 2004 tax year for zip code 07444, filed in 2005:
Average Adjusted Gross Income (AGI) in 2004: $78,034 (Individual Income Tax Returns)
Here:
$78,034
State:
$64,921
Salary/wage: $73,425 (reported on 74.1% of returns)
Here:
$73,425
State:
$57,755
(% of AGI for various income ranges: 125.6% for AGIs below $10k, 50.1% for AGIs $10k-25k, 61.3% for AGIs $25k-50k, 62.0% for AGIs $50k-75k, 73.6% for AGIs $75k-100k, 71.9% for AGIs over 100k)
Taxable interest for individuals: $2,532 (reported on 76.3% of returns)
This zip code:
$2,532
New Jersey:
$2,068
(% of AGI for various income ranges: 15.2% for AGIs below $10k, 8.7% for AGIs $10k-25k, 4.1% for AGIs $25k-50k, 3.8% for AGIs $50k-75k, 2.0% for AGIs $75k-100k, 1.7% for AGIs over 100k)
Taxable dividends: $4,087 (reported on 51.9% of returns)
Here:
$4,087
State:
$3,959
(% of AGI for various income ranges: 14.0% for AGIs below $10k, 6.7% for AGIs $10k-25k, 4.0% for AGIs $25k-50k, 3.6% for AGIs $50k-75k, 2.5% for AGIs $75k-100k, 2.2% for AGIs over 100k)
Net capital gain/loss: +$8,149 (reported on 41.2% of returns)
Here:
+$8,149
State:
+$13,591
(% of AGI for various income ranges: -9.6% for AGIs below $10k, 0.4% for AGIs $10k-25k, 0.6% for AGIs $25k-50k, 1.0% for AGIs $50k-75k, 1.6% for AGIs $75k-100k, 6.4% for AGIs over 100k)
Profit/loss from business: +$20,549 (reported on 14.3% of returns)
Here:
+$20,549
State:
+$17,520
(% of AGI for various income ranges: 9.7% for AGIs below $10k, 4.4% for AGIs $10k-25k, 5.0% for AGIs $25k-50k, 3.7% for AGIs $50k-75k, 2.9% for AGIs $75k-100k, 3.7% for AGIs over 100k)
IRA payment deduction: $3,713 (reported on 3.4% of returns)
07444:
$3,713
New Jersey:
$3,270
(% of AGI for various income ranges: 0.4% for AGIs $25k-50k, 0.3% for AGIs $50k-75k, 0.2% for AGIs $75k-100k, 0.1% for AGIs over 100k)
Self-employed pension: $14,486 (reported on 1.4% of returns)
Here:
$14,486
New Jersey:
$17,258
(% of AGI for various income ranges: 0.3% for AGIs $50k-75k, 0.1% for AGIs $75k-100k, 0.4% for AGIs over 100k)
Total itemized deductions: $24,220 (22% of AGI, reported on 61.6% of returns)
Here:
$24,220
State:
$23,924
Here:
21.9% of AGI
State:
21.1% of AGI
(% of AGI for various income ranges: 53.0% for AGIs below $10k, 33.7% for AGIs $10k-25k, 21.6% for AGIs $25k-50k, 21.7% for AGIs $50k-75k, 21.9% for AGIs $75k-100k, 16.7% for AGIs over 100k)
Charity contributions deductions: $3,065 (3% of AGI, reported on 57.7% of returns)
Here:
$3,065
State:
$3,242
Here:
2.8% of AGI
State:
2.7% of AGI
(% of AGI for various income ranges: 2.2% for AGIs below $10k, 2.7% for AGIs $10k-25k, 2.1% for AGIs $25k-50k, 2.7% for AGIs $50k-75k, 2.3% for AGIs $75k-100k, 2.2% for AGIs over 100k)
Total tax: $13,807 (reported on 83.8% of returns)
07444:
$13,807
State:
$12,321
(% of AGI for various income ranges: 5.6% for AGIs below $10k, 4.1% for AGIs $10k-25k, 8.1% for AGIs $25k-50k, 9.9% for AGIs $50k-75k, 9.7% for AGIs $75k-100k, 18.5% for AGIs over 100k)
Earned income credit: $1,081 (reported on 2.6% of returns)
Here:
$1,081
State:
$1,711
Percentage of individuals using paid preparers for their 2004 taxes: 67.9%
Here:
68%
State:
65%
(% for various income ranges: 57.8% for AGIs below $10k, 65.1% for AGIs $10k-25k, 67.5% for AGIs $25k-50k, 70.9% for AGIs $50k-75k, 71.9% for AGIs $75k-100k, 72.8% for AGIs over 100k)
Household received Food Stamps/SNAP in the past 12 months: 61 Household did not receive Food Stamps/SNAP in the past 12 months: 4,700
Women who had a birth in the past 12 months: 71 (72 now married, 0 unmarried) Women who did not have a birth in the past 12 months: 1,690 (798 now married, 889 unmarried)
Housing units in zip code 07444 with a mortgage: 1,877 (304 second mortgage, 49 home equity loan, 220 both second mortgage and home equity loan) Houses without a mortgage: 109
Median monthly owner costs for units with a mortgage: $2,925 Median monthly owner costs for units without a mortgage: $836
Residents with income below the poverty level in 2022:
This zip code:
7.0%
Whole state:
9.7%
Residents with income below 50% of the poverty level in 2022:
This zip code:
4.4%
Whole state:
5.2%
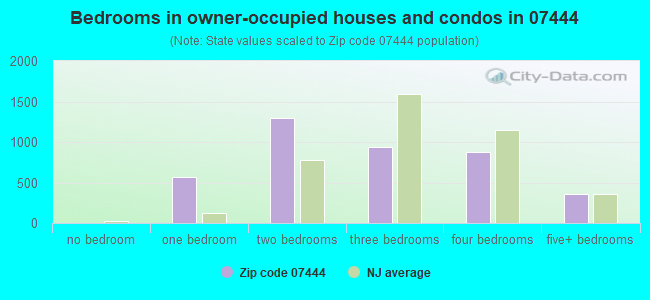
Median number of rooms in houses and condos:
Here:
6.0
State:
6.8
Median number of rooms in apartments:
Here:
3.7
State:
3.9
Notable locations in this zip code not listed on our city pages
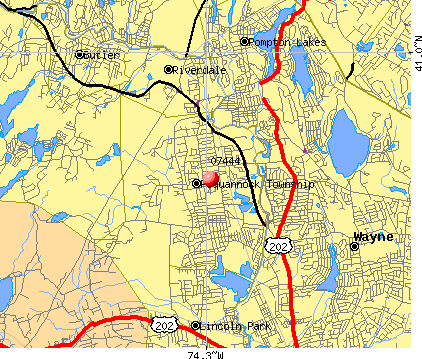
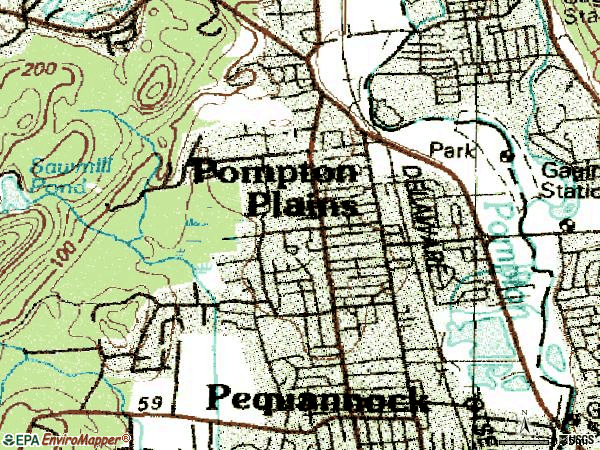
Notable locations in zip code 07444: Pompton Plains Station (A), Sunset Valley Golf Course (B), Pequannock Township First Aid and Rescue Squad (C), A and M Medical Services (D), Pequannock Township Fire Department Engine Company 1 (E). Display/hide their locations on the map
In group quarters: 161 (-1 institutionalized population)
Size of family households: 1,144 2-persons, 341 3-persons, 582 4-persons, 251 5-persons, 143 6-persons, 27 7-or-more-persons
Size of nonfamily households: 2,104 1-person, 229 2-persons
1,494 married couples with children.
93 single-parent households (19 men, 74 women).
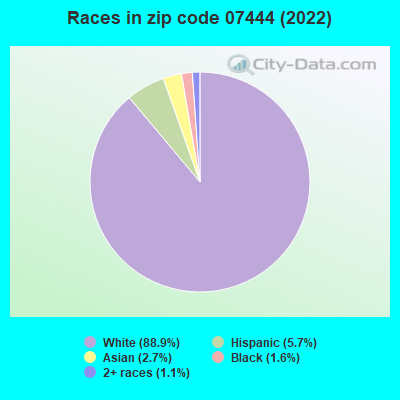
91.2% of residents of 07444 zip code speak English at home.
2.3% of residents speak Spanish at home (51% very well, 44% well, 5% not well).
3.9% of residents speak other Indo-European language at home (68% very well, 21% well, 11% not well).
1.6% of residents speak Asian or Pacific Island language at home (94% very well, 6% well).
1.3% of residents speak other language at home (29% very well, 71% not well).
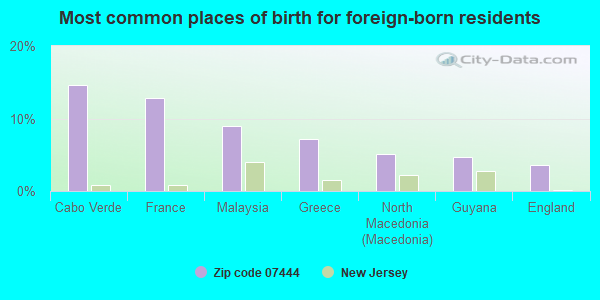
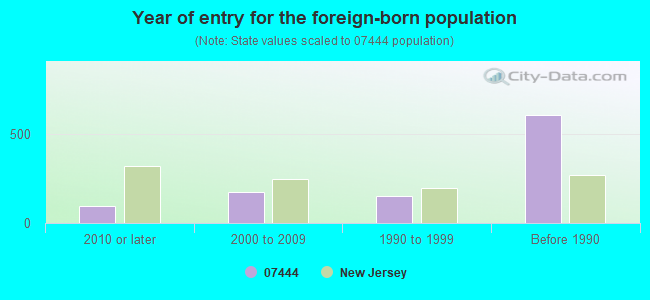
Foreign born population: 1,047 (9.6%) (85.6% of them are naturalized citizens)
This zip code:
9.6%
Whole state:
23.5%
15%Cabo Verde
13%France
9%Malaysia
7%Greece
5%North Macedonia (Macedonia)
5%Guyana
4%England
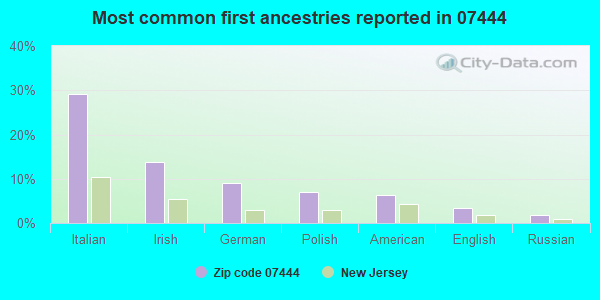
29%Italian
14%Irish
9%German
7%Polish
6%American
3%English
2%Russian
Year of entry for the foreign-born population
982010 or later
1772000 to 2009
1541990 to 1999
610Before 1990
Major facilities with environmental interests located in this zip code:
PEQUANNOCK TWP BD OF ED PEQUANNOCK HIGH SCHOOL (85 SUNSET RD in POMPTON PLAINS, NJ)
COMPLIANCE ACTIVITY (Tracking inspections of insecticide, fungicide, and rodenticide, and toxic substances) (National Center for Education Statistics) - STATE ID-050 STATE MASTER (New Jersey environmental info) - NJEMS-015281, STATE CLEANUP SITE, NJEMS-25077, AIR PROGRAM (Resource Conservation and Recovery Act (tracking hazardous waste)) Business SIC classification: ELEMENTARY AND SECONDARY SCHOOLS
PEQUANNOCK TWP BD OF ED HILLVIEW SCHOOL (206 BOULEVARD in POMPTON PLAINS, NJ)
(National Center for Education Statistics) - STATE ID-055 STATE MASTER (New Jersey environmental info) - NJEMS-015284, STATE CLEANUP SITE, NJEMS-25816, AIR PROGRAM Business SIC classification: ELEMENTARY AND SECONDARY SCHOOLS
FAIRFIELD MOTORS INC (700 RTE 23 in POMPTON PLAINS, NJ)
STATE MASTER (New Jersey environmental info) - NJEMS-009530, STATE CLEANUP SITE, NJEMS-1431-02-0002.1, LAND USE - COASTAL AND LAND USE, NJEMS-26411, AIR PROGRAM, NJEMS-39729900000, EPCRA (Resource Conservation and Recovery Act (tracking hazardous waste)) Business SIC classification: MOTOR VEHICLE DEALERS (NEW AND USED) Organizations: ADJESS ASSOC GP, ROUTE 23 HONDA, BARISH JEFFREY (CONTACT/OWNER)
Alternative names: FAIRFIELD HONDA
PEQUANNOCK TWP BD OF ED NORTH BOULEVARD SCHOOL (363 BOULEVARD in POMPTON PLAINS, NJ)
(National Center for Education Statistics) - STATE ID-060 STATE MASTER (New Jersey environmental info) - NJEMS-015283, STATE CLEANUP SITE, NJEMS-25909, AIR PROGRAM
NETHERLAND REFORMED CHRISTIAN SCHOOL (164 JACKSONVILLE ROAD in POMPTON PLAINS, NJ)
COMPLIANCE ACTIVITY (Tracking inspections of insecticide, fungicide, and rodenticide, and toxic substances) STATE MASTER (New Jersey environmental info) - NJEMS-44679400000, EPCRA Business SIC classification: ELEMENTARY AND SECONDARY SCHOOLS Alternative names: NETHERLANDS REFORMED CHRISTIAN SCHOOL, NETHERLANDS REFORMED CHURCH SCHOOL
PEQUANNOCK TWP DPW GARAGE (99 ALEXANDER AVENUE in POMPTON PLAINS, NJ)
STATE MASTER (New Jersey environmental info) - NJEMS-009035, STATE CLEANUP SITE, NJEMS-H8543, AIR PROGRAM Conditionally Exempt Small Quantity Generators, less than 100 kg/month of hazardous waste (Resource Conservation and Recovery Act (tracking hazardous waste)) - notification Organizations: TWP OF PEQUANNOCK (CONTACT/OWNER)
Alternative names: PEQUANNOCK TWP OF DPW, PEQUANNOCK TWP OF DPW GARAGE
PEQUANNOCK VALLEY (493 NEWARK-POMPTON TURNPIKE in POMPTON PLAINS, NJ)
(National Center for Education Statistics) - STATE ID-080 Organizations: PEQUANNOCK TWP (SCHOOL DISTRICT)
PEQUANNOCK TWP (538 NEWARK in POMPTON PLAINS, NJ)
(Integrated Compliance Information System) - ICIS-02-1987-0451, FORMAL ENFORCEMENT ACTION
NEW JERSEY BELL TELEPHONE COMPANY (97 WEST PARKWAY in POMPTON PLAINS, NJ)
(Resource Conservation and Recovery Act (tracking hazardous waste))
ALL AMERICAN OIL RECOVERY COMPANY (EAST GARDEN PLACE in POMPTON PLAINS, NJ)
(Resource Conservation and Recovery Act (tracking hazardous waste))
ARROW GROUP INDUSTRIES INC (100 ALEXANDER AVE in POMPTON PLAINS, NJ)
(Resource Conservation and Recovery Act (tracking hazardous waste)) Business NAICS classification: PREFABRICATED METAL BUILDING AND COMPONENT MANUFACTURING.
PASSAIC COUNTY RUSTPROOFING, INC. (444 RT 23 NORTH in POMPTON PLAINS, NJ)
(Resource Conservation and Recovery Act (tracking hazardous waste))
Housing units lacking complete plumbing facilities: 2.7% Housing units lacking complete kitchen facilities: 4.4%
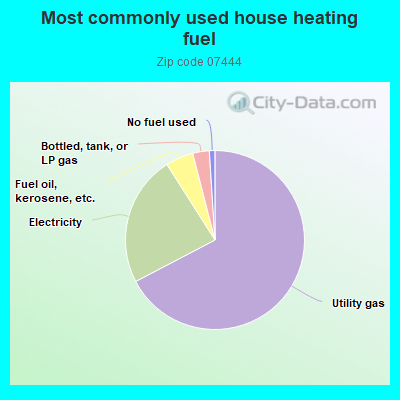
67.2%Utility gas
23.6%Electricity
5.0%Fuel oil, kerosene, etc.
3.0%Bottled, tank, or LP gas
1.0%No fuel used
Population in 1990: 8,028. Population change in the 1990s: +1,199 (+14.9%).
Place of birth for U.S.-born residents:
This state: 7,320
Northeast: 1,729
Midwest: 313
South: 352
West: 109
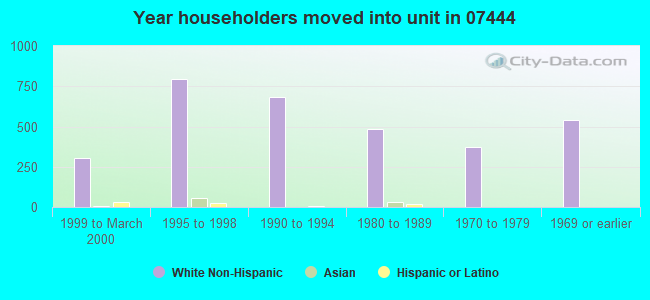
69% of the 07444 zip code residents lived in the same house 5 years ago. Out of people who lived in different houses, 43% lived in this county. Out of people who lived in different counties, 50% lived in New Jersey.
94% of the 07444 zip code residents lived in the same house 1 year ago. Out of people who lived in different houses, 15% moved from this county. Out of people who lived in different houses, 66% moved from different county within same state. Out of people who lived in different houses, 19% moved from different state.
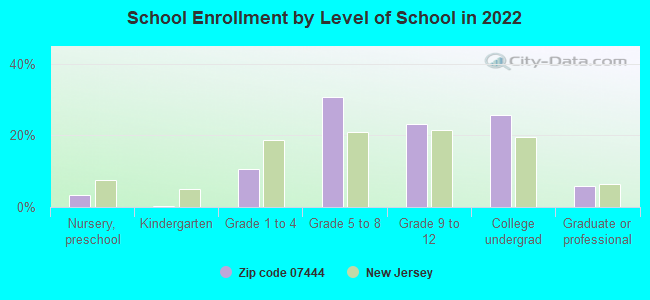
Private vs. public school enrollment:
Students in private schools in grades 1 to 8 (elementary and middle school): 87
Here:
10.2%
New Jersey:
12.3%
Students in private schools in grades 9 to 12 (high school): 19
Here:
4.1%
New Jersey:
13.1%
Students in private undergraduate colleges: 141
Here:
26.6%
New Jersey:
33.2%
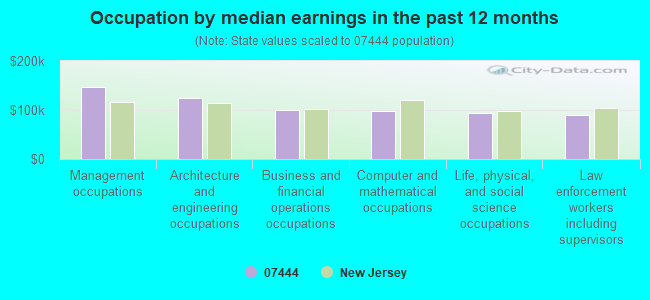
Occupation by median earnings in the past 12 months ($)
147,672Management occupations
124,823Architecture and engineering occupations
100,845Business and financial operations occupations
97,077Computer and mathematical occupations
93,527Life, physical, and social science occupations
89,069Law enforcement workers including supervisors
Companies with federal contracts located in this zip code:
KRAFT POWER CORP (241 W PARKWAY in POMPTON PLAINS, NJ) : $185,152 in 3 contractsfrom 2001 to 2002
$85,000 with Navy for Gasoline Reciprocating Engines, Except Aircraft; and Components. Signed on 2002-06-12. Completion date: 2002-07-12.
$55,152 with Navy for Generators and Generators Sets, Electrical. Signed on 2002-07-23. Completion date: 2002-09-03.
$45,000 with Navy for Diesel Engines and Components. Signed on 2001-04-26. Completion date: 2001-05-10.
THE EVANS GROUP, INC (230 WEST PARKWAY, UNIT 7-1 in POMPTON PLAINS, NJ; small business) : $140,550 in 4 contractsfrom 2001 to 2003
$66,300 with Army for Maintenance, Repair and Rebuilding of Equipment -- Instruments and Laboratory Equipment. Signed on 2002-02-27. Completion date: 2002-12-31.
$38,250, same as above.Signed on 2003-07-25. Completion date: 2003-09-17.
$36,000, same as above.Signed on 2001-05-09. Completion date: 2001-11-09.
$0, same as above.Signed on 2003-07-25. Completion date: 2003-09-17.
ALLIED GROUP (101 ALEXANDER AVENUE in POMPTON PLAINS, NJ; small business) : $9,466 in 2 contractsfrom 2004 to 2005
$4,839 with Defense Logistics Agency for Guns, through 30 mm. Taking place in NY. Signed on 2004-12-22. Completion date: 2005-05-18.
$4,627 with Defense Logistics Agency for Vehicular Furniture and Accessories. Taking place in NV. Signed on 2005-01-12. Completion date: 2005-07-02.
Top industries in this zip code by the number of employees in 2005:
Health Care and Social Assistance: General Medical and Surgical Hospitals (over 1000 employees: 1 establishment)
Wholesale Trade: Home Furnishing Merchant Wholesalers (250-499: 1)
Health Care and Social Assistance: Continuing Care Retirement Communities (250-499: 1)
Administrative and Support and Waste Management and Remediation Services: Temporary Help Services (100-249: 1)
Health Care and Social Assistance: Home Health Care Services (100-249: 1)
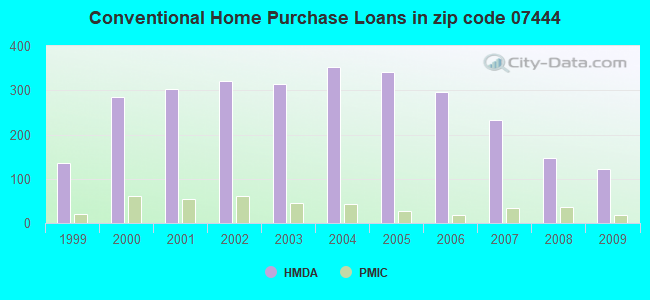
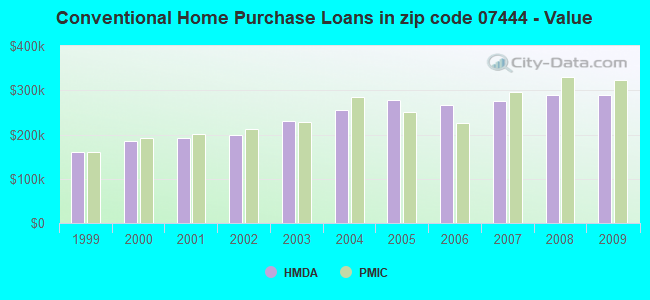
Detailed PMIC statistics for the following Tracts:0402.00
, 0403.00
2002 - 2018 National Fire Incident Reporting System (NFIRS) incidents
Based on the data from the years 2002 - 2018 the average number of fire incidents per year is 12. The highest number of reported fire incidents - 39 took place in 2011, and the least - 0 in 2003. The data has a rising trend.
When looking into fire subcategories, the most reports belonged to: Structure Fires (47.8%), and Outside Fires (27.6%).
Fire incident types reported to NFIRS in Zip Code 07444


 Nearest zip codes: 07440, 07457, 07035, 07442, 07082, 07403.


 Based on the data from the years 2002 - 2018 the average number of fire incidents per year is 12. The highest number of reported fire incidents - 39 took place in 2011, and the least - 0 in 2003. The data has a rising trend.
 When looking into fire subcategories, the most reports belonged to: Structure Fires (47.8%), and Outside Fires (27.6%).