Estimated zip code population in 2022: 18,038 Zip code population in 2010: 17,433 Zip code population in 2000: 17,478
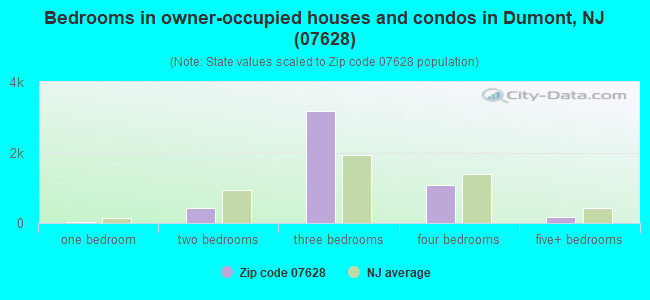
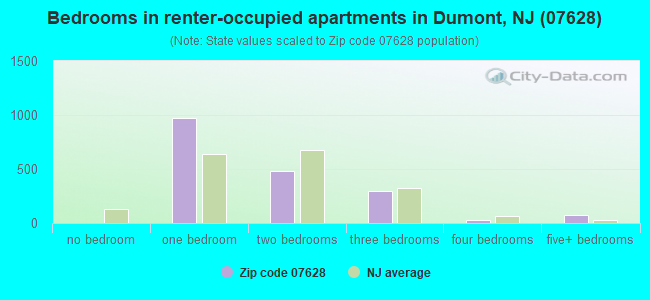
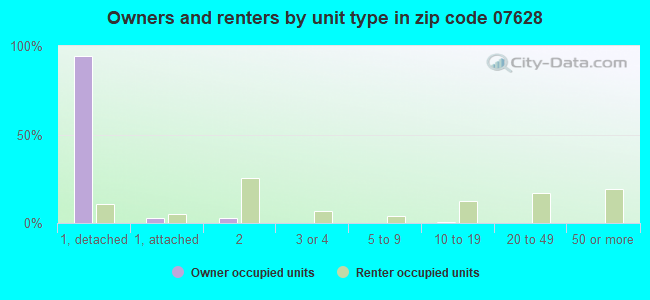
Houses and condos: 6,867 Renter-occupied apartments: 1,835
% of renters here:
27%
State:
35%
March 2022 cost of living index in zip code 07628: 117.0 (more than average, U.S. average is 100)
Land area: 2.0 sq. mi. Water area: 0.0 sq. mi.
Population density: 9,117 people per square mile
(high).
OSM Map
Google Map
MSN Map
OSM Map
General Map
Google Map
MSN Map
OSM Map
Google Map
MSN Map
OSM Map
Google Map
MSN Map
Please wait while loading the map...
Real estate property taxes paid for housing units in 2022:
This zip code:
2.0% ($9,521)
New Jersey:
2.1% ($8,897)
Median real estate property taxes paid for housing units with mortgages in 2022: $9,557 (2.0%) Median real estate property taxes paid for housing units with no mortgage in 2022: $9,483 (2.2%)
Business Search- 14 Million verified businesses
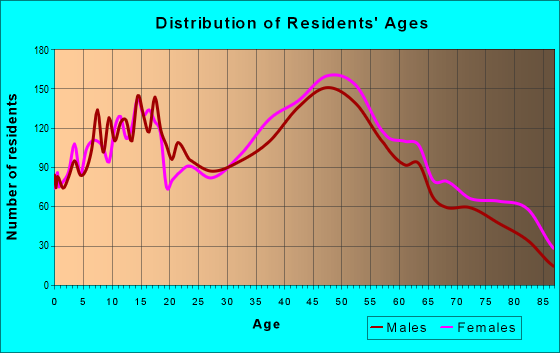
Males: 8,576
(47.5%)
Females: 9,461
(52.5%)
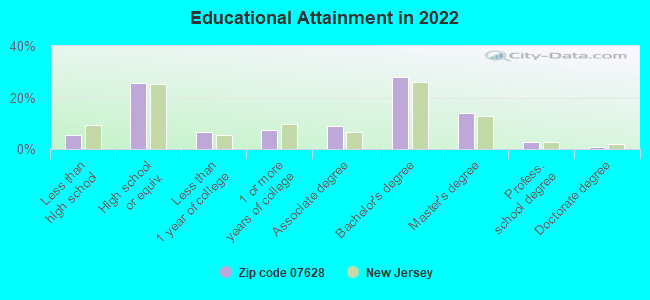
For population 25 years and over in 07628:
High school or higher: 94.8%
Bachelor's degree or higher: 45.9%
Graduate or professional degree: 17.7%
Unemployed: 4.2%
Mean travel time to work (commute): 31.4 minutes
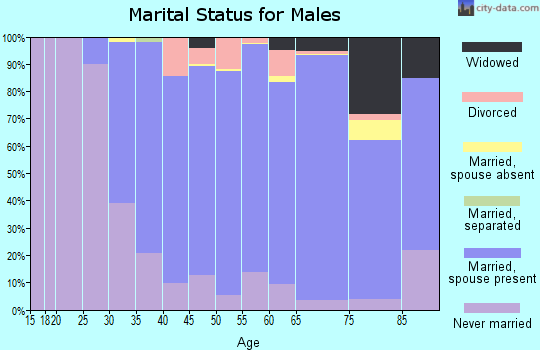
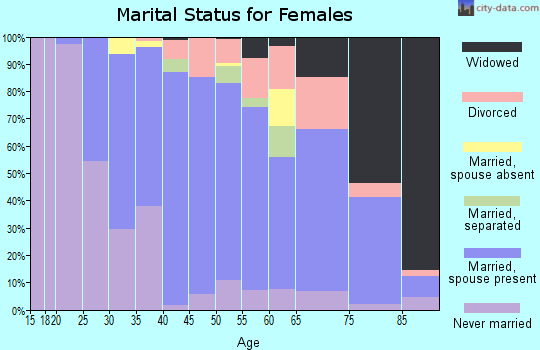
For population 15 years and over in 07628:
Never married: 27.2%
Now married: 56.8%
Separated: 0.5%
Widowed: 6.1%
Divorced: 9.5%
Zip code 07628 compared to state average:
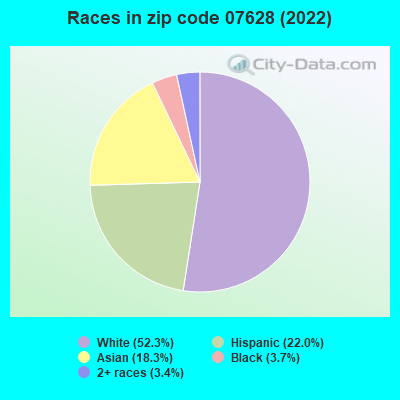
Black race population percentage significantly below state average.
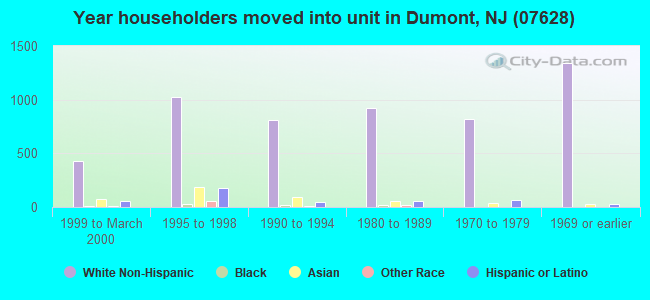
Length of stay since moving in significantly above state average.
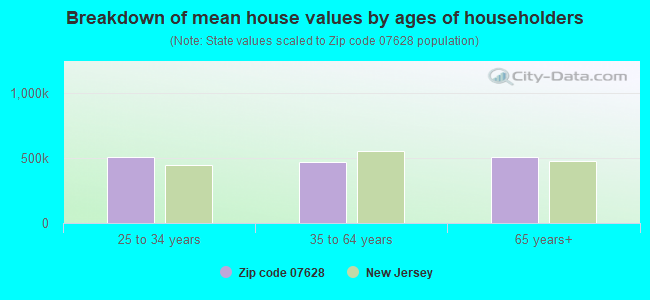
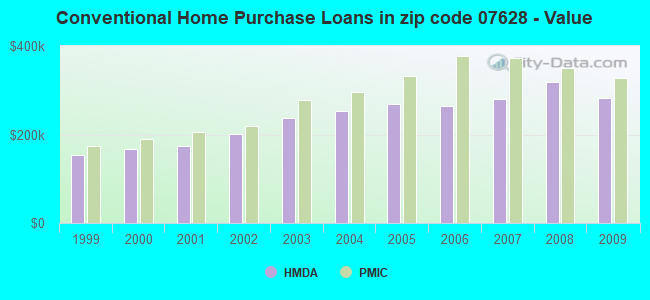
Estimated median house/condo value in 2022: $469,931
07628:
$469,931
New Jersey:
$428,900
According to our research of New Jersey and other state lists, there were 4 registered sex offenders living in 07628 zip code as of April 26, 2024. The ratio of all residents to sex offenders in zip code 07628 is 4,511 to 1. The ratio of registered sex offenders to all residents in this zip code is much lower than the state average.
Median resident age:
This zip code:
42.7 years
New Jersey median age:
40.4 years
Average household size:
This zip code:
2.7 people
New Jersey:
2.6 people
Averages for the 2020 tax year for zip code 07628, filed in 2021:
Average Adjusted Gross Income (AGI) in 2020: $83,273 (Individual Income Tax Returns)
Here:
$83,273
State:
$95,247
Salary/wage: $76,419 (reported on 82.7% of returns)
Here:
$76,419
State:
$80,635
(% of AGI for various income ranges: 1100.7% for AGIs below $25k, 3710.9% for AGIs $25k-50k, 6815.5% for AGIs $50k-75k, 10106.8% for AGIs $75k-100k, 19279.6% for AGIs $100k-200k, 62805.9% for AGIs over 200k)
Taxable interest for individuals: $1,080 (reported on 35.6% of returns)
This zip code:
$1,080
New Jersey:
$2,414
(% of AGI for various income ranges: 24.7% for AGIs below $25k, 46.4% for AGIs $25k-50k, 45.8% for AGIs $50k-75k, 66.0% for AGIs $75k-100k, 83.5% for AGIs $100k-200k, 308.6% for AGIs over 200k)
Ordinary dividends: $3,579 (reported on 26.5% of returns)
Here:
$3,579
State:
$8,057
(% of AGI for various income ranges: 44.3% for AGIs below $25k, 72.7% for AGIs $25k-50k, 95.8% for AGIs $50k-75k, 160.7% for AGIs $75k-100k, 230.6% for AGIs $100k-200k, 1022.7% for AGIs over 200k)
Net capital gain/loss in AGI: +$9,673 (reported on 21.8% of returns)
Here:
+$9,673
State:
+$25,022
(% of AGI for various income ranges: 23.3% for AGIs below $25k, 27.6% for AGIs $25k-50k, 54.9% for AGIs $50k-75k, 154.4% for AGIs $75k-100k, 301.3% for AGIs $100k-200k, 5987.3% for AGIs over 200k)
Profit/loss from business: +$12,026 (reported on 15.9% of returns)
Here:
+$12,026
State:
+$18,035
(% of AGI for various income ranges: 142.9% for AGIs below $25k, 213.6% for AGIs $25k-50k, 265.1% for AGIs $50k-75k, 300.7% for AGIs $75k-100k, 469.3% for AGIs $100k-200k, 1117.3% for AGIs over 200k)
Taxable individual retirement arrangement distribution: $16,972 (reported on 9.4% of returns)
07628:
$16,972
New Jersey:
$21,558
(% of AGI for various income ranges: 85.6% for AGIs below $25k, 155.0% for AGIs $25k-50k, 207.0% for AGIs $50k-75k, 301.9% for AGIs $75k-100k, 381.3% for AGIs $100k-200k, 1235.9% for AGIs over 200k)
Self-employed (Keogh) retirement plans: $14,520 (reported on 0.5% of returns)
07628:
$14,520
New Jersey:
$30,844
(% of AGI for various income ranges: 57.2% for AGIs $100k-200k)
Total itemized deductions: $28,801 (reported on 17.3% of returns)
Here:
$28,801
State:
$32,863
(% of AGI for various income ranges: 199.1% for AGIs below $25k, 342.7% for AGIs $25k-50k, 625.2% for AGIs $50k-75k, 920.3% for AGIs $75k-100k, 1359.3% for AGIs $100k-200k, 4186.4% for AGIs over 200k)
Charity contributions: $4,619 (reported on 13.9% of returns)
Here:
$4,619
State:
$7,880
(% of AGI for various income ranges: 7.0% for AGIs below $25k, 28.3% for AGIs $25k-50k, 58.4% for AGIs $50k-75k, 86.7% for AGIs $75k-100k, 200.3% for AGIs $100k-200k, 791.4% for AGIs over 200k)
Taxes paid: $9,373 (reported on 17.3% of returns)
07628:
$9,373
State:
$9,183
(% of AGI for various income ranges: 65.5% for AGIs below $25k, 129.5% for AGIs $25k-50k, 216.9% for AGIs $50k-75k, 319.3% for AGIs $75k-100k, 466.4% for AGIs $100k-200k, 1003.6% for AGIs over 200k)
Earned income credit: $1,500 (reported on 8.0% of returns)
Here:
$1,500
State:
$2,148
(% of AGI for various income ranges: 45.8% for AGIs below $25k, 40.3% for AGIs $25k-50k)
Percentage of individuals using paid preparers for their 2020 taxes: 93.2%
Here:
93%
State:
92%
(% for various income ranges: 90.4% for AGIs below $25k, 93.4% for AGIs $25k-50k, 94.0% for AGIs $50k-75k, 94.5% for AGIs $75k-100k, 94.0% for AGIs $100k-200k, 96.7% for AGIs over 200k)
Averages for the 2012 tax year for zip code 07628, filed in 2013:
Average Adjusted Gross Income (AGI) in 2012: $67,826 (Individual Income Tax Returns)
Here:
$67,826
State:
$79,688
Salary/wage: $65,021 (reported on 84.0% of returns)
Here:
$65,021
State:
$68,122
(% of AGI for various income ranges: 66.2% for AGIs below $25k, 75.2% for AGIs $25k-50k, 76.9% for AGIs $50k-75k, 77.7% for AGIs $75k-100k, 85.8% for AGIs $100k-200k, 79.6% for AGIs over 200k)
Taxable interest for individuals: $931 (reported on 43.4% of returns)
This zip code:
$931
New Jersey:
$2,193
(% of AGI for various income ranges: 2.0% for AGIs below $25k, 0.9% for AGIs $25k-50k, 0.7% for AGIs $50k-75k, 0.6% for AGIs $75k-100k, 0.4% for AGIs $100k-200k, 0.5% for AGIs over 200k)
Ordinary dividends: $2,952 (reported on 28.1% of returns)
Here:
$2,952
State:
$6,828
(% of AGI for various income ranges: 2.5% for AGIs below $25k, 1.2% for AGIs $25k-50k, 1.2% for AGIs $50k-75k, 1.5% for AGIs $75k-100k, 0.9% for AGIs $100k-200k, 1.6% for AGIs over 200k)
Net capital gain/loss in AGI: +$2,197 (reported on 18.3% of returns)
Here:
+$2,197
State:
+$15,358
(% of AGI for various income ranges: 0.3% for AGIs $75k-100k, 0.3% for AGIs $100k-200k, 3.7% for AGIs over 200k)
Profit/loss from business: +$14,859 (reported on 13.2% of returns)
Here:
+$14,859
State:
+$19,577
(% of AGI for various income ranges: 8.6% for AGIs below $25k, 4.3% for AGIs $25k-50k, 2.7% for AGIs $50k-75k, 2.3% for AGIs $75k-100k, 2.1% for AGIs $100k-200k, 2.9% for AGIs over 200k)
Taxable individual retirement arrangement distribution: $12,744 (reported on 11.9% of returns)
07628:
$12,744
New Jersey:
$18,214
(% of AGI for various income ranges: 4.3% for AGIs below $25k, 3.0% for AGIs $25k-50k, 2.7% for AGIs $50k-75k, 2.5% for AGIs $75k-100k, 1.5% for AGIs $100k-200k, 2.4% for AGIs over 200k)
Self-employment retirement plans: $15,500 (reported on 0.5% of returns)
07628:
$15,500
New Jersey:
$24,511
Total itemized deductions: $25,979 (25% of AGI, reported on 50.2% of returns)
Here:
$25,979
State:
$30,827
Here:
25.1% of AGI
State:
21.2% of AGI
(% of AGI for various income ranges: 21.3% for AGIs below $25k, 15.5% for AGIs $25k-50k, 18.1% for AGIs $50k-75k, 20.9% for AGIs $75k-100k, 20.8% for AGIs $100k-200k, 15.4% for AGIs over 200k)
Charity contributions: $2,246 (reported on 43.8% of returns)
Here:
$2,246
State:
$3,451
(% of AGI for various income ranges: 1.0% for AGIs below $25k, 1.1% for AGIs $25k-50k, 1.3% for AGIs $50k-75k, 1.5% for AGIs $75k-100k, 1.6% for AGIs $100k-200k, 1.4% for AGIs over 200k)
Taxes paid: $13,158 (reported on 50.1% of returns)
07628:
$13,158
State:
$15,801
(% of AGI for various income ranges: 9.7% for AGIs below $25k, 7.1% for AGIs $25k-50k, 8.6% for AGIs $50k-75k, 10.1% for AGIs $75k-100k, 10.6% for AGIs $100k-200k, 9.5% for AGIs over 200k)
Earned income credit: $1,787 (reported on 7.7% of returns)
Here:
$1,787
State:
$2,182
(% of AGI for various income ranges: 3.0% for AGIs below $25k, 0.5% for AGIs $25k-50k)
Percentage of individuals using paid preparers for their 2012 taxes: 69.3%
Here:
69%
State:
65%
(% for various income ranges: 64.4% for AGIs below $25k, 67.5% for AGIs $25k-50k, 72.9% for AGIs $50k-75k, 71.0% for AGIs $75k-100k, 73.4% for AGIs $100k-200k, 75.0% for AGIs over 200k)
Averages for the 2004 tax year for zip code 07628, filed in 2005:
Average Adjusted Gross Income (AGI) in 2004: $55,779 (Individual Income Tax Returns)
Here:
$55,779
State:
$64,921
Salary/wage: $55,728 (reported on 82.8% of returns)
Here:
$55,728
State:
$57,755
(% of AGI for various income ranges: 129.4% for AGIs below $10k, 63.2% for AGIs $10k-25k, 77.7% for AGIs $25k-50k, 80.4% for AGIs $50k-75k, 84.9% for AGIs $75k-100k, 86.1% for AGIs over 100k)
Taxable interest for individuals: $1,216 (reported on 61.6% of returns)
This zip code:
$1,216
New Jersey:
$2,068
(% of AGI for various income ranges: 13.2% for AGIs below $10k, 4.5% for AGIs $10k-25k, 1.8% for AGIs $25k-50k, 1.3% for AGIs $50k-75k, 1.0% for AGIs $75k-100k, 0.8% for AGIs over 100k)
Taxable dividends: $2,107 (reported on 36.1% of returns)
Here:
$2,107
State:
$3,959
(% of AGI for various income ranges: 9.3% for AGIs below $10k, 3.1% for AGIs $10k-25k, 1.5% for AGIs $25k-50k, 1.4% for AGIs $50k-75k, 1.0% for AGIs $75k-100k, 1.1% for AGIs over 100k)
Net capital gain/loss: +$2,678 (reported on 25.9% of returns)
Here:
+$2,678
State:
+$13,591
(% of AGI for various income ranges: -8.3% for AGIs below $10k, -0.1% for AGIs $10k-25k, 0.0% for AGIs $25k-50k, 0.2% for AGIs $50k-75k, 0.5% for AGIs $75k-100k, 2.9% for AGIs over 100k)
Profit/loss from business: +$12,482 (reported on 12.8% of returns)
Here:
+$12,482
State:
+$17,520
(% of AGI for various income ranges: 18.2% for AGIs below $10k, 7.6% for AGIs $10k-25k, 3.1% for AGIs $25k-50k, 2.7% for AGIs $50k-75k, 2.4% for AGIs $75k-100k, 2.2% for AGIs over 100k)
IRA payment deduction: $3,304 (reported on 3.5% of returns)
07628:
$3,304
New Jersey:
$3,270
(% of AGI for various income ranges: 0.4% for AGIs $10k-25k, 0.4% for AGIs $25k-50k, 0.3% for AGIs $50k-75k, 0.2% for AGIs $75k-100k, 0.1% for AGIs over 100k)
Self-employed pension: $6,143 (reported on 0.6% of returns)
Here:
$6,143
New Jersey:
$17,258
(% of AGI for various income ranges: 0.1% for AGIs $50k-75k, 0.1% for AGIs $75k-100k, 0.1% for AGIs over 100k)
Total itemized deductions: $20,814 (25% of AGI, reported on 52.8% of returns)
Here:
$20,814
State:
$23,924
Here:
25.3% of AGI
State:
21.1% of AGI
(% of AGI for various income ranges: 48.5% for AGIs below $10k, 20.3% for AGIs $10k-25k, 17.1% for AGIs $25k-50k, 20.5% for AGIs $50k-75k, 21.0% for AGIs $75k-100k, 19.0% for AGIs over 100k)
Charity contributions deductions: $2,210 (3% of AGI, reported on 49.5% of returns)
Here:
$2,210
State:
$3,242
Here:
2.6% of AGI
State:
2.7% of AGI
(% of AGI for various income ranges: 2.6% for AGIs below $10k, 1.7% for AGIs $10k-25k, 1.7% for AGIs $25k-50k, 2.0% for AGIs $50k-75k, 2.0% for AGIs $75k-100k, 2.1% for AGIs over 100k)
Total tax: $7,550 (reported on 81.6% of returns)
07628:
$7,550
State:
$12,321
(% of AGI for various income ranges: 5.5% for AGIs below $10k, 4.6% for AGIs $10k-25k, 7.7% for AGIs $25k-50k, 9.0% for AGIs $50k-75k, 9.8% for AGIs $75k-100k, 14.7% for AGIs over 100k)
Earned income credit: $1,453 (reported on 6.2% of returns)
Here:
$1,453
State:
$1,711
Percentage of individuals using paid preparers for their 2004 taxes: 68.1%
Here:
68%
State:
65%
(% for various income ranges: 60.0% for AGIs below $10k, 68.2% for AGIs $10k-25k, 65.2% for AGIs $25k-50k, 71.4% for AGIs $50k-75k, 72.6% for AGIs $75k-100k, 73.6% for AGIs over 100k)
Likely homosexual households (counted as self-reported same-sex unmarried-partner households)
Lesbian couples: 0.0% of all households
Gay men: 0.3% of all households
Household received Food Stamps/SNAP in the past 12 months: 301 Household did not receive Food Stamps/SNAP in the past 12 months: 6,399
Women who had a birth in the past 12 months: 161 (149 now married, 14 unmarried) Women who did not have a birth in the past 12 months: 3,671 (1,559 now married, 2,111 unmarried)
Housing units in zip code 07628 with a mortgage: 3,063 (305 second mortgage, 254 both second mortgage and home equity loan) Houses without a mortgage: 184
Median monthly owner costs for units with a mortgage: $2,951 Median monthly owner costs for units without a mortgage: $1,341
Residents with income below the poverty level in 2022:
This zip code:
6.4%
Whole state:
9.7%
Residents with income below 50% of the poverty level in 2022:
This zip code:
3.7%
Whole state:
5.2%
Median number of rooms in houses and condos:
Here:
6.7
State:
6.8
Median number of rooms in apartments:
Here:
3.7
State:
3.9
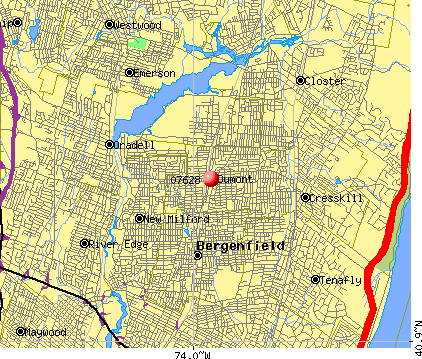
Notable locations in this zip code not listed on our city pages
Notable locations in zip code 07628: Dumont Station (A), Dumont Volunteer Ambulance Corps (B), Dumont Fire Department Company 3 (C), Dumont Fire Department Company 2 (D), Dumont Fire Department Company 1 (E), Dumont Fire Department Independent Company (F), Dumont Borough Hall (G). Display/hide their locations on the map
Churches in zip code 07628 include: Saint Lukes Church (A), Calvary United Methodist Church (B), Lutheran Church of the Redeemer (C), Old North Reformed Church (D), Saint Mary's Catholic Church (E). Display/hide their locations on the map
In group quarters: 16 (-1 institutionalized population)
Size of family households: 1,694 2-persons, 1,534 3-persons, 1,140 4-persons, 369 5-persons, 95 6-persons, 104 7-or-more-persons
Size of nonfamily households: 1,580 1-person, 197 2-persons, 10 3-persons
2,610 married couples with children.
608 single-parent households (105 men, 503 women).
65.4% of residents of 07628 zip code speak English at home.
14.3% of residents speak Spanish at home (70% very well, 14% well, 13% not well, 2% not at all).
4.6% of residents speak other Indo-European language at home (87% very well, 13% well).
14.3% of residents speak Asian or Pacific Island language at home (50% very well, 37% well, 11% not well, 2% not at all).
1.2% of residents speak other language at home (78% very well, 16% well, 6% not at all).
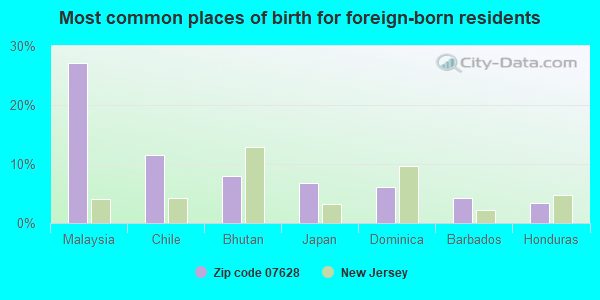
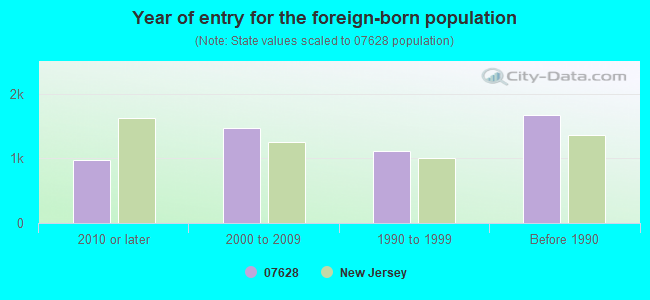
Foreign born population: 5,193 (28.8%) (74.3% of them are naturalized citizens)
This zip code:
28.8%
Whole state:
23.5%
27%Malaysia
11%Chile
8%Bhutan
7%Japan
6%Dominica
4%Barbados
3%Honduras
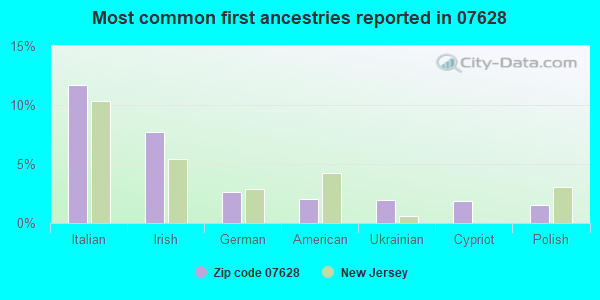
12%Italian
8%Irish
3%German
2%American
2%Ukrainian
2%Cypriot
2%Polish
Year of entry for the foreign-born population
9802010 or later
1,4762000 to 2009
1,1111990 to 1999
1,670Before 1990
Facilities with environmental interests located in this zip code:
CHESTNUT PYRAMID SERVICE STATION (562 WASHINGTON AVENUE in DUMONT, NJ)
STATE MASTER (New Jersey environmental info) - NJEMS-027388, STATE CLEANUP SITE, NJEMS-B0186, AIR PROGRAM (Resource Conservation and Recovery Act (tracking hazardous waste)) Business SIC classification: GASOLINE SERVICE STATIONS Organizations: PYRAMID OIL CO, CHESTNUT SERVICE INC Alternative names: CHESTNUT BEND PYRAMID
PRESIDENTS SQUARE MALL (125 WASHINGTON AVENUE in DUMONT, NJ)
STATE MASTER (New Jersey environmental info) - NJEMS-033637, STATE CLEANUP SITE Small Quantity Generators, between 100 kg and 1000 kg of hazardous waste/month (Resource Conservation and Recovery Act (tracking hazardous waste)) - notification Organizations: PRESIDENTS SQUARE MALL LLC, PRESIDENT SQUARE MALL (CONTACT/OWNER)
Alternative names: PRESIDENT SQUARE MALL
HERBS AUTO BODY (18 OXFORD AVE in DUMONT, NJ)
STATE MASTER (New Jersey environmental info) - NJEMS-16361800000, EPCRA, NJEMS-G0605, AIR PROGRAM (Resource Conservation and Recovery Act (tracking hazardous waste)) Business SIC classification: AUTOMOTIVE STAMPINGS; TOP, BODY, AND UPHOLSTERY REPAIR SHOPS AND PAINT SHOPS Organizations: HERBS AUTO BODY INC
HONISS SCHOOL (31 DEPEW ST in DUMONT, NJ)
(National Center for Education Statistics) - STATE ID-060 (Resource Conservation and Recovery Act (tracking hazardous waste)) Organizations: DUMONT BORO (SCHOOL DISTRICT)
OCEAN MACHINERY CORP (29 ALADDIN AVE in DUMONT, NJ)
STATE MASTER (New Jersey environmental info) - NJEMS-G000002489, STATE CLEANUP SITE (Resource Conservation and Recovery Act (tracking hazardous waste))
HI LINE AUTO BODY INC (24 SUNSET ST in DUMONT, NJ)
STATE MASTER (New Jersey environmental info) - NJEMS-69565300000, EPCRA, NJEMS-G0120, AIR PROGRAM Small Quantity Generators, between 100 kg and 1000 kg of hazardous waste/month (Resource Conservation and Recovery Act (tracking hazardous waste)) Business SIC classification: TOP, BODY, AND UPHOLSTERY REPAIR SHOPS AND PAINT SHOPS
ALL LEATHER & SUEDE CLEANING INC (54 RUCERETO AVE in DUMONT, NJ)
(Resource Conservation and Recovery Act (tracking hazardous waste))
AUTO RESTORATION (55 W QUACKENBUSH AVE in DUMONT, NJ)
(Resource Conservation and Recovery Act (tracking hazardous waste))
B & R AUTO SERVICE INC (86 E MADISON AVE in DUMONT, NJ)
(Resource Conservation and Recovery Act (tracking hazardous waste))
OPRANDY HELEN (50 W MADISON AVE in DUMONT, NJ)
(Resource Conservation and Recovery Act (tracking hazardous waste))
P & M FRIENDLY SERVICE INC (387 NEW MILFORD AVE in DUMONT, NJ)
(Resource Conservation and Recovery Act (tracking hazardous waste))
Housing units lacking complete kitchen facilities: 0.6%
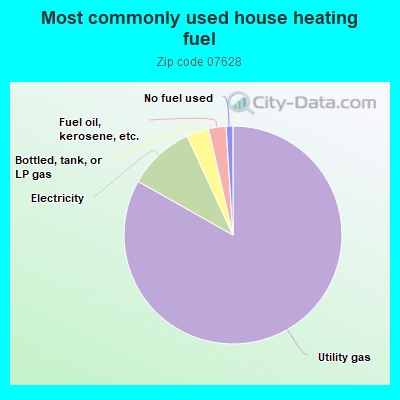
83.1%Utility gas
9.9%Electricity
3.3%Bottled, tank, or LP gas
2.6%Fuel oil, kerosene, etc.
1.0%No fuel used
Population in 1990: 17,187. Population change in the 1990s: +291 (+1.7%).
Place of birth for U.S.-born residents:
This state: 7,553
Northeast: 4,348
Midwest: 81
South: 532
West: 209
71% of the 07628 zip code residents lived in the same house 5 years ago. Out of people who lived in different houses, 68% lived in this county. Out of people who lived in different counties, 50% lived in New Jersey.
94% of the 07628 zip code residents lived in the same house 1 year ago. Out of people who lived in different houses, 59% moved from this county. Out of people who lived in different houses, 7% moved from different county within same state. Out of people who lived in different houses, 19% moved from different state. Out of people who lived in different houses, 19% moved from abroad.
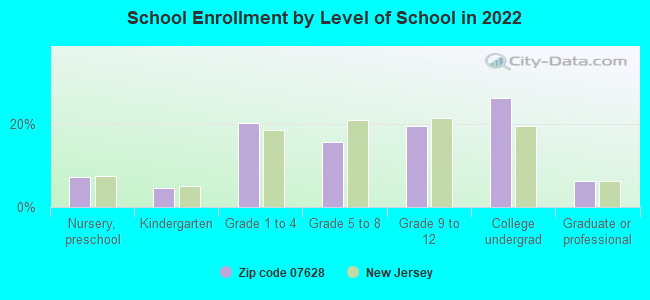
Private vs. public school enrollment:
Students in private schools in grades 1 to 8 (elementary and middle school): 40
Here:
2.6%
New Jersey:
12.3%
Students in private schools in grades 9 to 12 (high school):
Here:
0.0%
New Jersey:
13.1%
Students in private undergraduate colleges: 502
Here:
42.2%
New Jersey:
33.2%
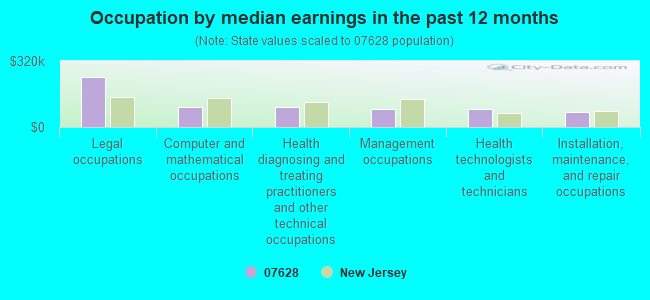
Occupation by median earnings in the past 12 months ($)
240,392Legal occupations
98,616Computer and mathematical occupations
97,084Health diagnosing and treating practitioners and other technical occupations
88,078Management occupations
85,426Health technologists and technicians
74,560Installation, maintenance, and repair occupations
Companies with federal contracts located in this zip code:
NORTH AMERICAN MANUFACTURING C (85 W MADISON AVE in DUMONT, NJ; small business) : $9,767 in 2 contractsfrom 2003 to 2005
$7,200 with Navy for Office Furniture. Signed on 2005-01-21. Completion date: 2005-04-20.
$2,567 with Navy for Office Furniture. Taking place in CA. Signed on 2003-09-23. Completion date: 2003-10-17.
Top industries in this zip code by the number of employees in 2005:
2005 - 2018 National Fire Incident Reporting System (NFIRS) incidents
According to the data from the years 2005 - 2018 the average number of fire incidents per year is 31. The highest number of reported fires - 45 took place in 2011, and the least - 19 in 2010. The data has a rising trend.
When looking into fire subcategories, the most incidents belonged to: Structure Fires (54.7%), and Outside Fires (34.7%).
Fire incident types reported to NFIRS in Zip Code 07628


 Nearest zip codes: 07641, 07621, 07646, 07626, 07627, 07649.
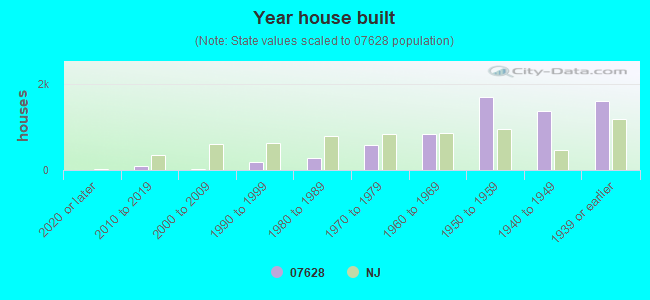


 According to the data from the years 2005 - 2018 the average number of fire incidents per year is 31. The highest number of reported fires - 45 took place in 2011, and the least - 19 in 2010. The data has a rising trend.
 When looking into fire subcategories, the most incidents belonged to: Structure Fires (54.7%), and Outside Fires (34.7%).