Estimated zip code population in 2022: 16,911 Zip code population in 2010: 16,341 Zip code population in 2000: 16,400
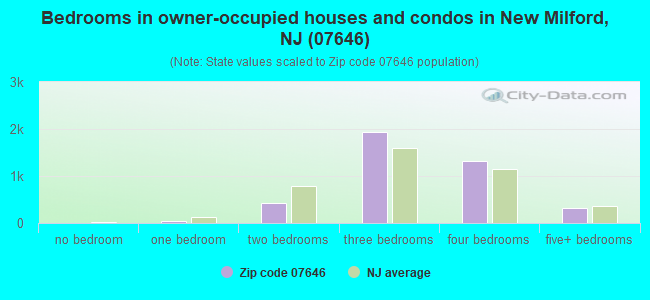
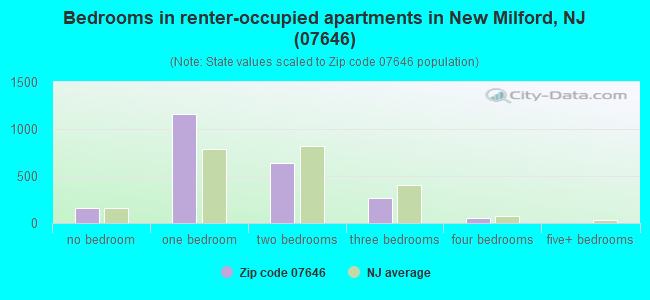
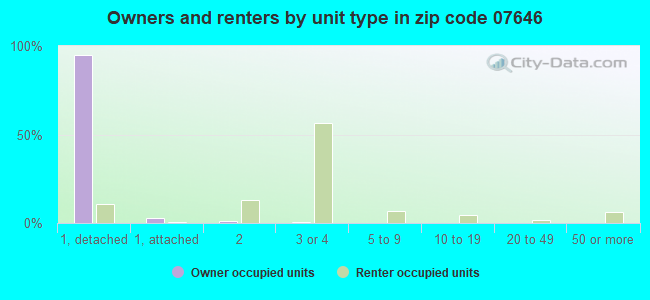
Houses and condos: 6,408 Renter-occupied apartments: 2,252
% of renters here:
36%
State:
35%
March 2022 cost of living index in zip code 07646: 117.9 (more than average, U.S. average is 100)
Land area: 2.3 sq. mi. Water area: 0.0 sq. mi.
Population density: 7,437 people per square mile
(high).
OSM Map
Google Map
MSN Map
OSM Map
General Map
Google Map
MSN Map
OSM Map
Google Map
MSN Map
OSM Map
Google Map
MSN Map
Please wait while loading the map...
Real estate property taxes paid for housing units in 2022:
This zip code:
1.9% ($9,521)
New Jersey:
2.1% ($8,897)
Median real estate property taxes paid for housing units with mortgages in 2022: $9,557 (1.8%) Median real estate property taxes paid for housing units with no mortgage in 2022: $9,483 (2.0%)
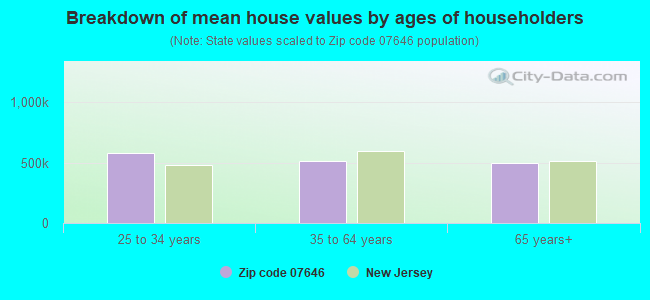
Estimated median house/condo value in 2022: $512,885
07646:
$512,885
New Jersey:
$428,900
According to our research of New Jersey and other state lists, there was 1 registered sex offender living in 07646 zip code as of April 26, 2024. The ratio of all residents to sex offenders in zip code 07646 is 16,921 to 1. The ratio of registered sex offenders to all residents in this zip code is much lower than the state average.
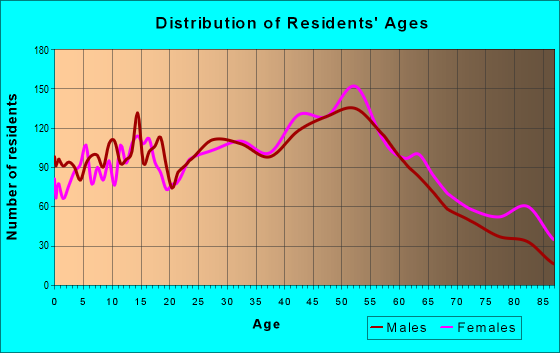
Median resident age:
This zip code:
40.7 years
New Jersey median age:
40.4 years
Average household size:
This zip code:
2.6 people
New Jersey:
2.6 people
Averages for the 2020 tax year for zip code 07646, filed in 2021:
Average Adjusted Gross Income (AGI) in 2020: $87,547 (Individual Income Tax Returns)
Here:
$87,547
State:
$95,247
Salary/wage: $78,018 (reported on 82.9% of returns)
Here:
$78,018
State:
$80,635
(% of AGI for various income ranges: 1142.9% for AGIs below $25k, 3778.8% for AGIs $25k-50k, 6984.9% for AGIs $50k-75k, 10180.0% for AGIs $75k-100k, 20514.3% for AGIs $100k-200k, 65058.8% for AGIs over 200k)
Taxable interest for individuals: $1,715 (reported on 33.8% of returns)
This zip code:
$1,715
New Jersey:
$2,414
(% of AGI for various income ranges: 30.3% for AGIs below $25k, 37.4% for AGIs $25k-50k, 42.3% for AGIs $50k-75k, 83.3% for AGIs $75k-100k, 170.8% for AGIs $100k-200k, 618.0% for AGIs over 200k)
Ordinary dividends: $4,111 (reported on 27.0% of returns)
Here:
$4,111
State:
$8,057
(% of AGI for various income ranges: 45.3% for AGIs below $25k, 62.6% for AGIs $25k-50k, 127.3% for AGIs $50k-75k, 178.7% for AGIs $75k-100k, 347.3% for AGIs $100k-200k, 984.0% for AGIs over 200k)
Net capital gain/loss in AGI: +$13,658 (reported on 24.4% of returns)
Here:
+$13,658
State:
+$25,022
(% of AGI for various income ranges: 9.1% for AGIs below $25k, 30.4% for AGIs $25k-50k, 87.2% for AGIs $50k-75k, 103.5% for AGIs $75k-100k, 423.5% for AGIs $100k-200k, 8946.8% for AGIs over 200k)
Profit/loss from business: +$14,486 (reported on 15.9% of returns)
Here:
+$14,486
State:
+$18,035
(% of AGI for various income ranges: 178.5% for AGIs below $25k, 228.8% for AGIs $25k-50k, 174.5% for AGIs $50k-75k, 242.4% for AGIs $75k-100k, 478.3% for AGIs $100k-200k, 2835.2% for AGIs over 200k)
Taxable individual retirement arrangement distribution: $18,241 (reported on 8.5% of returns)
07646:
$18,241
New Jersey:
$21,558
(% of AGI for various income ranges: 65.4% for AGIs below $25k, 101.5% for AGIs $25k-50k, 184.9% for AGIs $50k-75k, 271.6% for AGIs $75k-100k, 532.8% for AGIs $100k-200k, 1048.4% for AGIs over 200k)
Self-employed (Keogh) retirement plans: $20,460 (reported on 0.6% of returns)
07646:
$20,460
New Jersey:
$30,844
(% of AGI for various income ranges: 20.2% for AGIs $25k-50k, 318.8% for AGIs over 200k)
Total itemized deductions: $29,056 (reported on 16.5% of returns)
Here:
$29,056
State:
$32,863
(% of AGI for various income ranges: 165.9% for AGIs below $25k, 254.6% for AGIs $25k-50k, 538.3% for AGIs $50k-75k, 803.8% for AGIs $75k-100k, 1456.9% for AGIs $100k-200k, 4578.0% for AGIs over 200k)
Charity contributions: $6,024 (reported on 14.1% of returns)
Here:
$6,024
State:
$7,880
(% of AGI for various income ranges: 9.6% for AGIs below $25k, 17.2% for AGIs $25k-50k, 51.5% for AGIs $50k-75k, 98.4% for AGIs $75k-100k, 263.4% for AGIs $100k-200k, 1292.0% for AGIs over 200k)
Taxes paid: $9,531 (reported on 16.4% of returns)
07646:
$9,531
State:
$9,183
(% of AGI for various income ranges: 54.4% for AGIs below $25k, 83.8% for AGIs $25k-50k, 185.7% for AGIs $50k-75k, 294.9% for AGIs $75k-100k, 518.1% for AGIs $100k-200k, 1187.2% for AGIs over 200k)
Earned income credit: $1,803 (reported on 7.5% of returns)
Here:
$1,803
State:
$2,148
(% of AGI for various income ranges: 55.7% for AGIs below $25k, 44.8% for AGIs $25k-50k)
Percentage of individuals using paid preparers for their 2020 taxes: 92.3%
Here:
92%
State:
92%
(% for various income ranges: 90.0% for AGIs below $25k, 92.5% for AGIs $25k-50k, 92.6% for AGIs $50k-75k, 92.9% for AGIs $75k-100k, 93.7% for AGIs $100k-200k, 92.9% for AGIs over 200k)
Averages for the 2012 tax year for zip code 07646, filed in 2013:
Average Adjusted Gross Income (AGI) in 2012: $70,537 (Individual Income Tax Returns)
Here:
$70,537
State:
$79,688
Salary/wage: $65,745 (reported on 83.9% of returns)
Here:
$65,745
State:
$68,122
(% of AGI for various income ranges: 68.2% for AGIs below $25k, 76.2% for AGIs $25k-50k, 78.0% for AGIs $50k-75k, 77.4% for AGIs $75k-100k, 82.7% for AGIs $100k-200k, 72.9% for AGIs over 200k)
Taxable interest for individuals: $1,282 (reported on 43.7% of returns)
This zip code:
$1,282
New Jersey:
$2,193
(% of AGI for various income ranges: 2.4% for AGIs below $25k, 0.9% for AGIs $25k-50k, 0.8% for AGIs $50k-75k, 0.8% for AGIs $75k-100k, 0.6% for AGIs $100k-200k, 0.7% for AGIs over 200k)
Ordinary dividends: $3,597 (reported on 28.2% of returns)
Here:
$3,597
State:
$6,828
(% of AGI for various income ranges: 2.5% for AGIs below $25k, 1.4% for AGIs $25k-50k, 1.3% for AGIs $50k-75k, 1.4% for AGIs $75k-100k, 1.3% for AGIs $100k-200k, 1.5% for AGIs over 200k)
Net capital gain/loss in AGI: +$2,668 (reported on 20.5% of returns)
Here:
+$2,668
State:
+$15,358
(% of AGI for various income ranges: 0.3% for AGIs $50k-75k, 0.6% for AGIs $100k-200k, 3.0% for AGIs over 200k)
Profit/loss from business: +$15,091 (reported on 14.2% of returns)
Here:
+$15,091
State:
+$19,577
(% of AGI for various income ranges: 8.8% for AGIs below $25k, 4.9% for AGIs $25k-50k, 2.1% for AGIs $50k-75k, 2.5% for AGIs $75k-100k, 2.0% for AGIs $100k-200k, 3.8% for AGIs over 200k)
Taxable individual retirement arrangement distribution: $14,023 (reported on 11.0% of returns)
07646:
$14,023
New Jersey:
$18,214
(% of AGI for various income ranges: 4.5% for AGIs below $25k, 2.5% for AGIs $25k-50k, 2.5% for AGIs $50k-75k, 3.2% for AGIs $75k-100k, 1.7% for AGIs $100k-200k, 1.4% for AGIs over 200k)
Self-employment retirement plans: $16,520 (reported on 0.6% of returns)
07646:
$16,520
New Jersey:
$24,511
Total itemized deductions: $26,851 (24% of AGI, reported on 48.1% of returns)
Here:
$26,851
State:
$30,827
Here:
24.5% of AGI
State:
21.2% of AGI
(% of AGI for various income ranges: 21.9% for AGIs below $25k, 14.8% for AGIs $25k-50k, 16.3% for AGIs $50k-75k, 19.1% for AGIs $75k-100k, 20.5% for AGIs $100k-200k, 15.9% for AGIs over 200k)
Charity contributions: $2,779 (reported on 41.6% of returns)
Here:
$2,779
State:
$3,451
(% of AGI for various income ranges: 0.9% for AGIs below $25k, 1.0% for AGIs $25k-50k, 1.3% for AGIs $50k-75k, 1.8% for AGIs $75k-100k, 1.9% for AGIs $100k-200k, 1.7% for AGIs over 200k)
Taxes paid: $13,411 (reported on 48.1% of returns)
07646:
$13,411
State:
$15,801
(% of AGI for various income ranges: 9.6% for AGIs below $25k, 6.6% for AGIs $25k-50k, 7.3% for AGIs $50k-75k, 9.0% for AGIs $75k-100k, 10.3% for AGIs $100k-200k, 9.6% for AGIs over 200k)
Earned income credit: $1,738 (reported on 8.4% of returns)
Here:
$1,738
State:
$2,182
(% of AGI for various income ranges: 3.0% for AGIs below $25k, 0.7% for AGIs $25k-50k)
Percentage of individuals using paid preparers for their 2012 taxes: 68.5%
Here:
68%
State:
65%
(% for various income ranges: 62.9% for AGIs below $25k, 66.9% for AGIs $25k-50k, 69.2% for AGIs $50k-75k, 72.2% for AGIs $75k-100k, 73.8% for AGIs $100k-200k, 76.5% for AGIs over 200k)
Averages for the 2004 tax year for zip code 07646, filed in 2005:
Average Adjusted Gross Income (AGI) in 2004: $57,818 (Individual Income Tax Returns)
Here:
$57,818
State:
$64,921
Salary/wage: $55,639 (reported on 83.8% of returns)
Here:
$55,639
State:
$57,755
(% of AGI for various income ranges: 78.7% for AGIs below $10k, 66.1% for AGIs $10k-25k, 79.6% for AGIs $25k-50k, 80.7% for AGIs $50k-75k, 83.7% for AGIs $75k-100k, 81.4% for AGIs over 100k)
Taxable interest for individuals: $1,346 (reported on 65.2% of returns)
This zip code:
$1,346
New Jersey:
$2,068
(% of AGI for various income ranges: 9.4% for AGIs below $10k, 3.8% for AGIs $10k-25k, 1.8% for AGIs $25k-50k, 1.7% for AGIs $50k-75k, 1.4% for AGIs $75k-100k, 1.0% for AGIs over 100k)
Taxable dividends: $2,351 (reported on 36.5% of returns)
Here:
$2,351
State:
$3,959
(% of AGI for various income ranges: 5.6% for AGIs below $10k, 3.0% for AGIs $10k-25k, 1.8% for AGIs $25k-50k, 1.3% for AGIs $50k-75k, 1.3% for AGIs $75k-100k, 1.3% for AGIs over 100k)
Net capital gain/loss: +$3,298 (reported on 27.5% of returns)
Here:
+$3,298
State:
+$13,591
(% of AGI for various income ranges: -6.1% for AGIs below $10k, -0.4% for AGIs $10k-25k, -0.2% for AGIs $25k-50k, 0.2% for AGIs $50k-75k, 0.5% for AGIs $75k-100k, 3.6% for AGIs over 100k)
Profit/loss from business: +$13,645 (reported on 13.1% of returns)
Here:
+$13,645
State:
+$17,520
(% of AGI for various income ranges: 9.7% for AGIs below $10k, 6.8% for AGIs $10k-25k, 3.4% for AGIs $25k-50k, 3.4% for AGIs $50k-75k, 2.1% for AGIs $75k-100k, 2.7% for AGIs over 100k)
IRA payment deduction: $3,092 (reported on 3.8% of returns)
07646:
$3,092
New Jersey:
$3,270
(% of AGI for various income ranges: 0.5% for AGIs $10k-25k, 0.3% for AGIs $25k-50k, 0.2% for AGIs $50k-75k, 0.2% for AGIs $75k-100k, 0.1% for AGIs over 100k)
Self-employed pension: $13,694 (reported on 0.6% of returns)
Here:
$13,694
New Jersey:
$17,258
Total itemized deductions: $21,396 (25% of AGI, reported on 49.5% of returns)
Here:
$21,396
State:
$23,924
Here:
24.8% of AGI
State:
21.1% of AGI
(% of AGI for various income ranges: 35.2% for AGIs below $10k, 20.8% for AGIs $10k-25k, 14.6% for AGIs $25k-50k, 17.8% for AGIs $50k-75k, 21.0% for AGIs $75k-100k, 18.0% for AGIs over 100k)
Charity contributions deductions: $2,497 (3% of AGI, reported on 46.0% of returns)
Here:
$2,497
State:
$3,242
Here:
2.8% of AGI
State:
2.7% of AGI
(% of AGI for various income ranges: 1.4% for AGIs below $10k, 1.5% for AGIs $10k-25k, 1.6% for AGIs $25k-50k, 2.0% for AGIs $50k-75k, 2.3% for AGIs $75k-100k, 2.1% for AGIs over 100k)
Total tax: $8,251 (reported on 82.9% of returns)
07646:
$8,251
State:
$12,321
(% of AGI for various income ranges: 3.4% for AGIs below $10k, 4.8% for AGIs $10k-25k, 8.2% for AGIs $25k-50k, 9.9% for AGIs $50k-75k, 10.3% for AGIs $75k-100k, 15.5% for AGIs over 100k)
Earned income credit: $1,346 (reported on 6.1% of returns)
Here:
$1,346
State:
$1,711
Percentage of individuals using paid preparers for their 2004 taxes: 68.0%
Here:
68%
State:
65%
(% for various income ranges: 62.4% for AGIs below $10k, 65.8% for AGIs $10k-25k, 64.7% for AGIs $25k-50k, 69.9% for AGIs $50k-75k, 73.1% for AGIs $75k-100k, 74.5% for AGIs over 100k)
Household received Food Stamps/SNAP in the past 12 months: 169 Household did not receive Food Stamps/SNAP in the past 12 months: 6,087
Women who had a birth in the past 12 months: 324 (215 now married, 107 unmarried) Women who did not have a birth in the past 12 months: 3,516 (1,875 now married, 1,632 unmarried)
Housing units in zip code 07646 with a mortgage: 2,563 (317 second mortgage, 306 both second mortgage and home equity loan) Houses without a mortgage: 216
Median monthly owner costs for units with a mortgage: $3,084 Median monthly owner costs for units without a mortgage: $1,320
Residents with income below the poverty level in 2022:
This zip code:
4.5%
Whole state:
9.7%
Residents with income below 50% of the poverty level in 2022:
This zip code:
2.4%
Whole state:
5.2%
Median number of rooms in houses and condos:
Here:
7.0
State:
6.8
Median number of rooms in apartments:
Here:
3.5
State:
3.9
Notable locations in this zip code not listed on our city pages
Notable locations in zip code 07646: New Milford Volunteer Ambulance Corp (A), New Milford Fire Department Company 1 (B), New Milford Fire Department Company 2 (C), New Milford Boro Hall (D), New Milford Public Library (E). Display/hide their locations on the map
Churches in zip code 07646 include: Church of the Ascension (A), Gloria Dei Evangelical Lutheran Church (B), New Milford Presbyterian Church (C), Saint Matthew's Evangelical Lutheran Church (D). Display/hide their locations on the map
In group quarters: 201 (-1 institutionalized population)
Size of family households: 1,609 2-persons, 977 3-persons, 1,203 4-persons, 389 5-persons, 125 6-persons, 70 7-or-more-persons
Size of nonfamily households: 1,647 1-person, 252 2-persons, 26 3-persons
3,074 married couples with children.
531 single-parent households (531 women).
59.0% of residents of 07646 zip code speak English at home.
13.8% of residents speak Spanish at home (70% very well, 25% well, 4% not well, 1% not at all).
7.6% of residents speak other Indo-European language at home (73% very well, 20% well, 6% not well).
16.1% of residents speak Asian or Pacific Island language at home (71% very well, 22% well, 7% not well).
3.5% of residents speak other language at home (71% very well, 15% well, 13% not well).
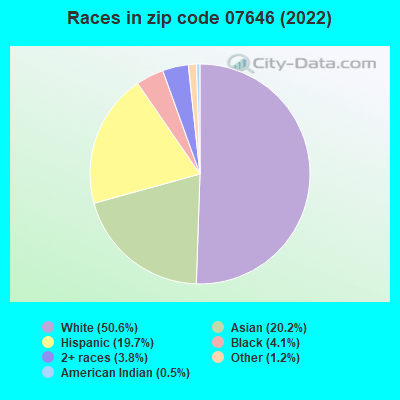
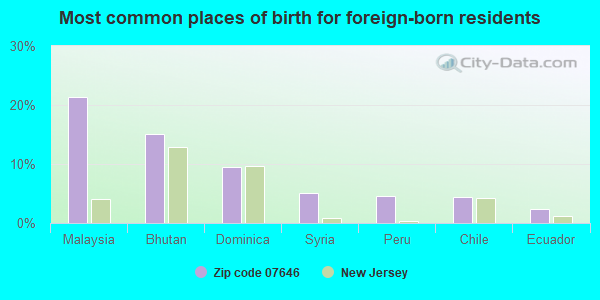
Foreign born population: 5,205 (30.8%) (74.1% of them are naturalized citizens)
This zip code:
30.8%
Whole state:
23.5%
21%Malaysia
15%Bhutan
10%Dominica
5%Syria
5%Peru
4%Chile
2%Ecuador
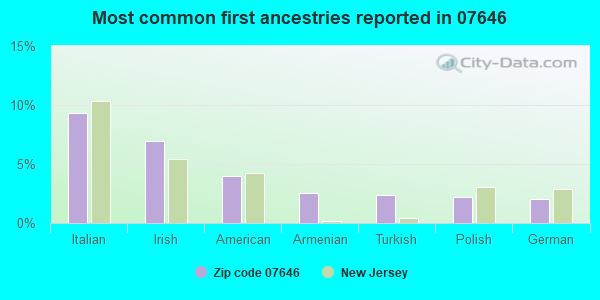
9%Italian
7%Irish
4%American
3%Armenian
2%Turkish
2%Polish
2%German
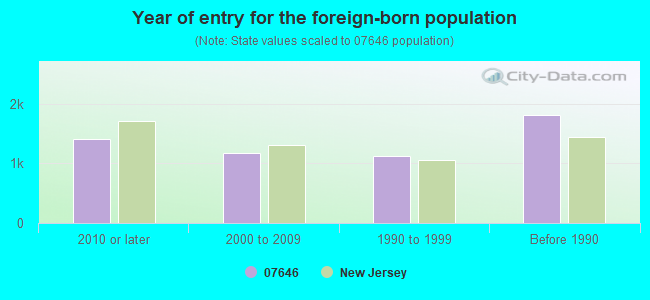
Year of entry for the foreign-born population
1,4042010 or later
1,1732000 to 2009
1,1191990 to 1999
1,814Before 1990
Major facilities with environmental interests located in this zip code:
NEW MILFORD BORO BD OF ED BERKLEY STREET SCHOOL (BERKLEY ST in NEW MILFORD, NJ)
(National Center for Education Statistics) - STATE ID-060 STATE MASTER (New Jersey environmental info) - NJEMS-02504, AIR PROGRAM (Resource Conservation and Recovery Act (tracking hazardous waste)) Alternative names: BERKLEY SCHOOL
NEW MILFORD BORO BD OF ED DAVID OWENS MIDDLE SCHOOL (ROSLYN AVE in NEW MILFORD, NJ)
(National Center for Education Statistics) - STATE ID-085 STATE MASTER (New Jersey environmental info) - NJEMS-012926, STATE CLEANUP SITE, NJEMS-02502, AIR PROGRAM (Resource Conservation and Recovery Act (tracking hazardous waste))
NEW MILFORD BORO BD OF ED NEW MILFORD HIGH SCHOOL (RIVER RD in NEW MILFORD, NJ)
(National Center for Education Statistics) - STATE ID-050 STATE MASTER (New Jersey environmental info) - NJEMS-012922, STATE CLEANUP SITE, NJEMS-02501, AIR PROGRAM, NJEMS-3550-050-03, PESTICIDES - APPLICATION (Resource Conservation and Recovery Act (tracking hazardous waste))
NEW MILFORD BORO FUEL FILLING SITE (930 RIVER RD in NEW MILFORD BORO, NJ)
STATE MASTER (New Jersey environmental info) - NJEMS-026354, STATE CLEANUP SITE, NJEMS-202039, National Pollutant Discharge Elimination System Permit National Pollutant Discharge Elimination System NON-MAJOR (Tracking pollutant discharge elimination systems) - permit (Resource Conservation and Recovery Act (tracking hazardous waste)) Alternative names: NEW MILFORD BOROUGH OF
GENES FRENCH CLEANERS (1041 RIVER RD in NEW MILFORD, NJ)
AIR MINOR (AIRS/AFS) STATE MASTER (New Jersey environmental info) - NJEMS-53259300000, EPCRA, NJEMS-L0088, AIR PROGRAM (Resource Conservation and Recovery Act (tracking hazardous waste)) Business SIC classification: DRYCLEANING PLANTS, EXCEPT RUG CLEANING; INDUSTRIAL LAUNDERERS Organizations: JOSEPH F DALLAGO & SONS INC
NEW MILFORD BORO BD OF ED BF GIBBS SCHOOL (145 SUTTON PLACE in NEW MILFORD, NJ)
STATE MASTER (New Jersey environmental info) - NJEMS-012927, STATE CLEANUP SITE, NJEMS-02503, AIR PROGRAM (Resource Conservation and Recovery Act (tracking hazardous waste))
NEW MILFORD CLEANERS (356 RIVER RD in NEW MILFORD, NJ)
STATE MASTER (New Jersey environmental info) - NJEMS-L0090, AIR PROGRAM, NJEMS-82008400000, EPCRA (Resource Conservation and Recovery Act (tracking hazardous waste)) Business SIC classification: DRYCLEANING PLANTS, EXCEPT RUG CLEANING Organizations: JONG KYU KIM D/B/A NEW MILFORD CLEANER, NEW MILFORD CLEANERS INC
NOAHS CLEANERS (844 RIVER RD in NEW MILFORD BORO, NJ)
STATE MASTER (New Jersey environmental info) - NJEMS-96203400000, EPCRA, NJEMS-L0072, AIR PROGRAM (Resource Conservation and Recovery Act (tracking hazardous waste)) Business SIC classification: DRYCLEANING PLANTS, EXCEPT RUG CLEANING Alternative names: PEAK CLEANERS
B SWANSON LANDSCAPE CONTRACTORS INC (498 BOULEVARD in NEW MILFORD BORO, NJ)
COMPLIANCE ACTIVITY (Tracking inspections of insecticide, fungicide, and rodenticide, and toxic substances) STATE MASTER (New Jersey environmental info) - NJEMS-98303A, PESTICIDES - APPLICATION, NJEMS-U000010, Alternative names: B. SWANSON LANSCAPE CONTRACTORS
HOVNANIAN ARMENIAN SCHOOL OF NJ (817 RIVER ROAD in NEW MILFORD, NJ)
COMPLIANCE ACTIVITY (Tracking inspections of insecticide, fungicide, and rodenticide, and toxic substances) STATE MASTER (New Jersey environmental info) - NJEMS-027395, STATE CLEANUP SITE, NJEMS-42131800000, EPCRA Business SIC classification: ELEMENTARY AND SECONDARY SCHOOLS Organizations: HOVNANIAN SCHOOL INC (CONTACT/OWNER)
Alternative names: HORNANIAN ARMENIAN SCHOOL
BERTRAM F GIBBS (SUTTON PL in NEW MILFORD, NJ)
(National Center for Education Statistics) - STATE ID-070 Organizations: NEW MILFORD BORO (SCHOOL DISTRICT)
NEW MILFORD WTRSHD MAINTEN YD (CNR MAIN ST & MADISON AVE in NEW MILFORD, NJ)
National Pollutant Discharge Elimination System NON-MAJOR (Tracking pollutant discharge elimination systems) - permit Business SIC classification: WATER SUPPLY Organizations: UNITED WATER NEW JERSEY (CONTACT/OPERATOR)
Alternative names: UNITED WATER NEW JERSEY
BERGEN COUNTY OF DPW C38-22 (HISTORIC NEW BRIDGE RD in NEW MILFORD/RIVER EDGE, NJ)
Large Quantity Generators, more that 1000 kg of hazardous waste/month (Resource Conservation and Recovery Act (tracking hazardous waste)) - notification Organizations: COUNTY OF BERGEN (CONTACT/OWNER)
Housing units lacking complete plumbing facilities: 0.4% Housing units lacking complete kitchen facilities: 0.4%
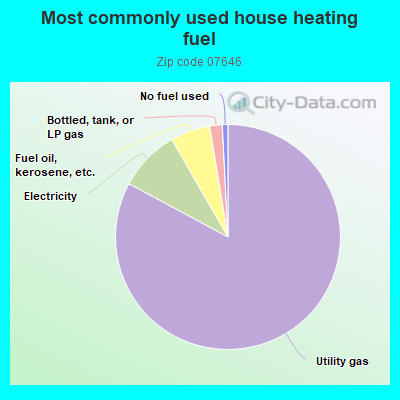
82.7%Utility gas
8.8%Electricity
5.7%Fuel oil, kerosene, etc.
1.8%Bottled, tank, or LP gas
0.8%No fuel used
Population in 1990: 15,799. Population change in the 1990s: +601 (+3.8%).
Place of birth for U.S.-born residents:
This state: 7,574
Northeast: 3,373
Midwest: 144
South: 102
West: 156
66% of the 07646 zip code residents lived in the same house 5 years ago. Out of people who lived in different houses, 72% lived in this county. Out of people who lived in different counties, 50% lived in New Jersey.
93% of the 07646 zip code residents lived in the same house 1 year ago. Out of people who lived in different houses, 43% moved from this county. Out of people who lived in different houses, 27% moved from different county within same state. Out of people who lived in different houses, 30% moved from different state. Out of people who lived in different houses, 1% moved from abroad.
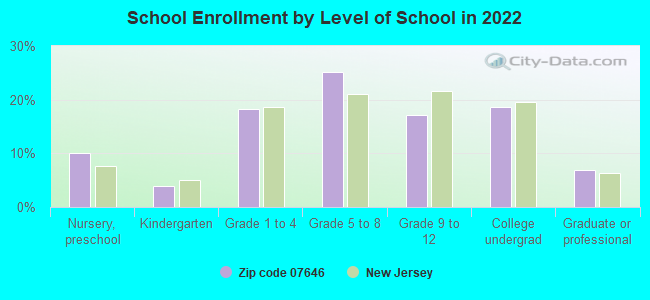
Private vs. public school enrollment:
Students in private schools in grades 1 to 8 (elementary and middle school): 79
Here:
4.4%
New Jersey:
12.3%
Students in private schools in grades 9 to 12 (high school): 99
Here:
13.7%
New Jersey:
13.1%
Students in private undergraduate colleges: 171
Here:
22.2%
New Jersey:
33.2%
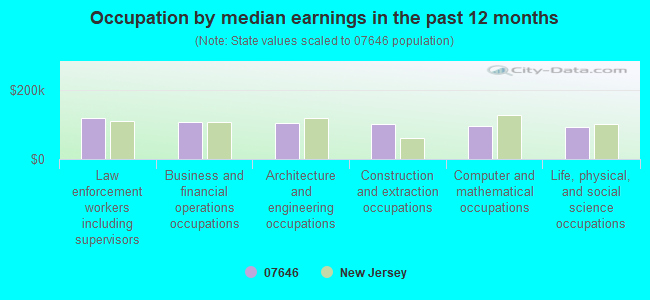
Occupation by median earnings in the past 12 months ($)
119,646Law enforcement workers including supervisors
108,068Business and financial operations occupations
103,869Architecture and engineering occupations
101,584Construction and extraction occupations
96,708Computer and mathematical occupations
92,018Life, physical, and social science occupations
Top industries in this zip code by the number of employees in 2005:
2004 - 2018 National Fire Incident Reporting System (NFIRS) incidents
According to the data from the years 2004 - 2018 the average number of fires per year is 30. The highest number of fire incidents - 54 took place in 2005, and the least - 9 in 2016. The data has a declining trend.
When looking into fire subcategories, the most incidents belonged to: Structure Fires (69.9%), and Outside Fires (18.7%).
Fire incident types reported to NFIRS in Zip Code 07646


 Nearest zip codes: 07661, 07621, 07649, 07628, 07641, 07630.


 According to the data from the years 2004 - 2018 the average number of fires per year is 30. The highest number of fire incidents - 54 took place in 2005, and the least - 9 in 2016. The data has a declining trend.
 When looking into fire subcategories, the most incidents belonged to: Structure Fires (69.9%), and Outside Fires (18.7%).