Estimated zip code population in 2022: 12,038 Zip code population in 2010: 11,340 Zip code population in 2000: 10,946
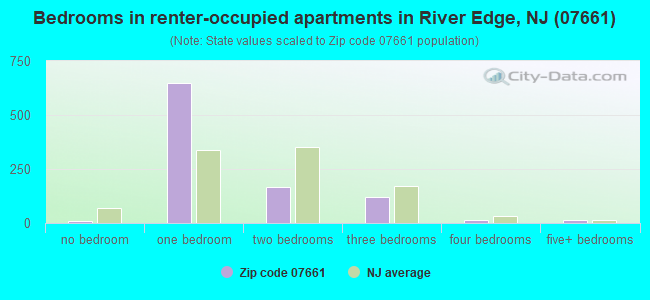
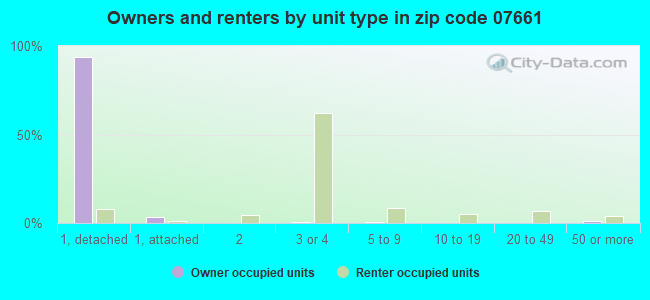
Houses and condos: 4,502 Renter-occupied apartments: 956
% of renters here:
21%
State:
35%
March 2022 cost of living index in zip code 07661: 117.8 (more than average, U.S. average is 100)
Land area: 1.8 sq. mi. Water area: 0.0 sq. mi.
Population density: 6,515 people per square mile
(high).
OSM Map
Google Map
MSN Map
OSM Map
General Map
Google Map
MSN Map
OSM Map
Google Map
MSN Map
OSM Map
Google Map
MSN Map
Please wait while loading the map...
Real estate property taxes paid for housing units in 2022:
This zip code:
1.4% ($9,521)
New Jersey:
2.1% ($8,897)
Median real estate property taxes paid for housing units with mortgages in 2022: $9,557 (1.4%) Median real estate property taxes paid for housing units with no mortgage in 2022: $9,483 (1.5%)
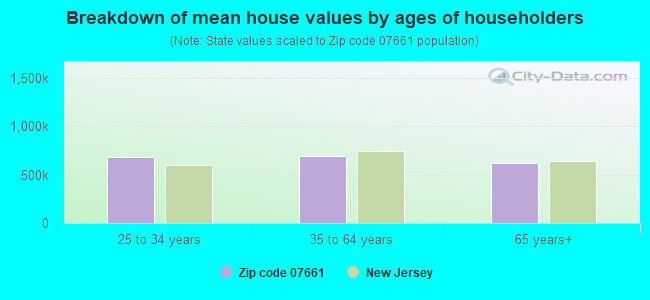
Estimated median house/condo value in 2022: $667,819
07661:
$667,819
New Jersey:
$428,900
According to our research of New Jersey and other state lists, there were 2 registered sex offenders living in 07661 zip code as of April 27, 2024. The ratio of all residents to sex offenders in zip code 07661 is 5,876 to 1. The ratio of registered sex offenders to all residents in this zip code is much lower than the state average.
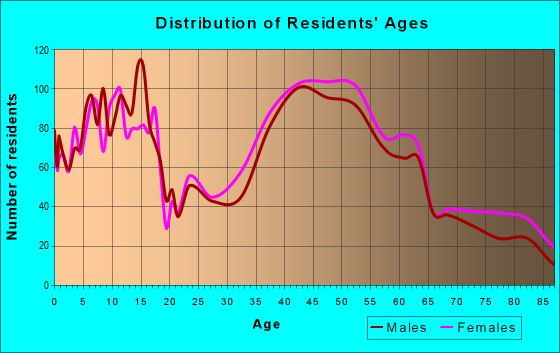
Median resident age:
This zip code:
40.7 years
New Jersey median age:
40.4 years
Average household size:
This zip code:
2.7 people
New Jersey:
2.6 people
Averages for the 2020 tax year for zip code 07661, filed in 2021:
Average Adjusted Gross Income (AGI) in 2020: $121,858 (Individual Income Tax Returns)
Here:
$121,858
State:
$95,247
Salary/wage: $114,026 (reported on 81.7% of returns)
Here:
$114,026
State:
$80,635
(% of AGI for various income ranges: 1114.4% for AGIs below $25k, 3629.6% for AGIs $25k-50k, 7280.0% for AGIs $50k-75k, 10243.7% for AGIs $75k-100k, 20331.1% for AGIs $100k-200k, 75507.4% for AGIs over 200k)
Taxable interest for individuals: $1,795 (reported on 47.5% of returns)
This zip code:
$1,795
New Jersey:
$2,414
(% of AGI for various income ranges: 39.2% for AGIs below $25k, 82.3% for AGIs $25k-50k, 82.4% for AGIs $50k-75k, 126.0% for AGIs $75k-100k, 192.1% for AGIs $100k-200k, 519.5% for AGIs over 200k)
Ordinary dividends: $5,362 (reported on 40.7% of returns)
Here:
$5,362
State:
$8,057
(% of AGI for various income ranges: 74.6% for AGIs below $25k, 120.0% for AGIs $25k-50k, 198.1% for AGIs $50k-75k, 249.4% for AGIs $75k-100k, 487.3% for AGIs $100k-200k, 1587.9% for AGIs over 200k)
Net capital gain/loss in AGI: +$13,185 (reported on 36.1% of returns)
Here:
+$13,185
State:
+$25,022
(% of AGI for various income ranges: 39.8% for AGIs below $25k, 82.9% for AGIs $25k-50k, 105.0% for AGIs $50k-75k, 248.0% for AGIs $75k-100k, 601.7% for AGIs $100k-200k, 5397.6% for AGIs over 200k)
Profit/loss from business: +$20,198 (reported on 19.2% of returns)
Here:
+$20,198
State:
+$18,035
(% of AGI for various income ranges: 207.2% for AGIs below $25k, 295.2% for AGIs $25k-50k, 323.3% for AGIs $50k-75k, 493.7% for AGIs $75k-100k, 755.5% for AGIs $100k-200k, 2780.3% for AGIs over 200k)
Taxable individual retirement arrangement distribution: $18,295 (reported on 10.3% of returns)
07661:
$18,295
New Jersey:
$21,558
(% of AGI for various income ranges: 75.6% for AGIs below $25k, 138.7% for AGIs $25k-50k, 279.5% for AGIs $50k-75k, 439.1% for AGIs $75k-100k, 621.4% for AGIs $100k-200k, 606.8% for AGIs over 200k)
Self-employed (Keogh) retirement plans: $31,350 (reported on 1.1% of returns)
07661:
$31,350
New Jersey:
$30,844
(% of AGI for various income ranges: 96.4% for AGIs $50k-75k, 388.4% for AGIs over 200k)
Total itemized deductions: $33,204 (reported on 20.3% of returns)
Here:
$33,204
State:
$32,863
(% of AGI for various income ranges: 159.0% for AGIs below $25k, 315.6% for AGIs $25k-50k, 675.2% for AGIs $50k-75k, 951.7% for AGIs $75k-100k, 1536.3% for AGIs $100k-200k, 4780.5% for AGIs over 200k)
Charity contributions: $6,171 (reported on 17.3% of returns)
Here:
$6,171
State:
$7,880
(% of AGI for various income ranges: 8.9% for AGIs below $25k, 23.3% for AGIs $25k-50k, 89.8% for AGIs $50k-75k, 109.7% for AGIs $75k-100k, 233.0% for AGIs $100k-200k, 893.7% for AGIs over 200k)
Taxes paid: $9,572 (reported on 20.3% of returns)
07661:
$9,572
State:
$9,183
(% of AGI for various income ranges: 66.2% for AGIs below $25k, 124.8% for AGIs $25k-50k, 220.7% for AGIs $50k-75k, 330.9% for AGIs $75k-100k, 506.6% for AGIs $100k-200k, 1099.2% for AGIs over 200k)
Earned income credit: $1,821 (reported on 5.9% of returns)
Here:
$1,821
State:
$2,148
(% of AGI for various income ranges: 52.0% for AGIs below $25k, 54.6% for AGIs $25k-50k)
Percentage of individuals using paid preparers for their 2020 taxes: 93.2%
Here:
93%
State:
92%
(% for various income ranges: 91.5% for AGIs below $25k, 92.3% for AGIs $25k-50k, 92.6% for AGIs $50k-75k, 91.7% for AGIs $75k-100k, 94.1% for AGIs $100k-200k, 96.1% for AGIs over 200k)
Averages for the 2012 tax year for zip code 07661, filed in 2013:
Average Adjusted Gross Income (AGI) in 2012: $96,104 (Individual Income Tax Returns)
Here:
$96,104
State:
$79,688
Salary/wage: $90,137 (reported on 83.1% of returns)
Here:
$90,137
State:
$68,122
(% of AGI for various income ranges: 64.7% for AGIs below $25k, 72.4% for AGIs $25k-50k, 71.1% for AGIs $50k-75k, 73.5% for AGIs $75k-100k, 82.2% for AGIs $100k-200k, 78.3% for AGIs over 200k)
Taxable interest for individuals: $1,540 (reported on 55.6% of returns)
This zip code:
$1,540
New Jersey:
$2,193
(% of AGI for various income ranges: 3.0% for AGIs below $25k, 1.5% for AGIs $25k-50k, 1.3% for AGIs $50k-75k, 1.3% for AGIs $75k-100k, 0.6% for AGIs $100k-200k, 0.7% for AGIs over 200k)
Ordinary dividends: $4,579 (reported on 39.8% of returns)
Here:
$4,579
State:
$6,828
(% of AGI for various income ranges: 5.0% for AGIs below $25k, 2.0% for AGIs $25k-50k, 2.3% for AGIs $50k-75k, 2.0% for AGIs $75k-100k, 1.4% for AGIs $100k-200k, 2.0% for AGIs over 200k)
Net capital gain/loss in AGI: +$4,112 (reported on 29.3% of returns)
Here:
+$4,112
State:
+$15,358
(% of AGI for various income ranges: 0.4% for AGIs $75k-100k, 0.6% for AGIs $100k-200k, 2.8% for AGIs over 200k)
Profit/loss from business: +$18,300 (reported on 17.1% of returns)
Here:
+$18,300
State:
+$19,577
(% of AGI for various income ranges: 10.9% for AGIs below $25k, 5.7% for AGIs $25k-50k, 4.5% for AGIs $50k-75k, 3.1% for AGIs $75k-100k, 2.5% for AGIs $100k-200k, 2.8% for AGIs over 200k)
Taxable individual retirement arrangement distribution: $16,988 (reported on 13.5% of returns)
07661:
$16,988
New Jersey:
$18,214
(% of AGI for various income ranges: 6.1% for AGIs below $25k, 3.5% for AGIs $25k-50k, 3.4% for AGIs $50k-75k, 3.3% for AGIs $75k-100k, 2.3% for AGIs $100k-200k, 1.6% for AGIs over 200k)
Self-employment retirement plans: $15,600 (reported on 1.3% of returns)
07661:
$15,600
New Jersey:
$24,511
(% of AGI for various income ranges: 0.2% for AGIs $100k-200k, 0.4% for AGIs over 200k)
Total itemized deductions: $31,893 (23% of AGI, reported on 57.9% of returns)
Here:
$31,893
State:
$30,827
Here:
22.7% of AGI
State:
21.2% of AGI
(% of AGI for various income ranges: 29.6% for AGIs below $25k, 17.0% for AGIs $25k-50k, 21.9% for AGIs $50k-75k, 20.5% for AGIs $75k-100k, 20.5% for AGIs $100k-200k, 16.5% for AGIs over 200k)
Charity contributions: $2,956 (reported on 51.3% of returns)
Here:
$2,956
State:
$3,451
(% of AGI for various income ranges: 1.1% for AGIs below $25k, 1.4% for AGIs $25k-50k, 1.4% for AGIs $50k-75k, 1.8% for AGIs $75k-100k, 1.7% for AGIs $100k-200k, 1.5% for AGIs over 200k)
Taxes paid: $17,681 (reported on 57.9% of returns)
07661:
$17,681
State:
$15,801
(% of AGI for various income ranges: 13.5% for AGIs below $25k, 7.9% for AGIs $25k-50k, 10.2% for AGIs $50k-75k, 10.7% for AGIs $75k-100k, 11.2% for AGIs $100k-200k, 10.4% for AGIs over 200k)
Earned income credit: $1,776 (reported on 7.0% of returns)
Here:
$1,776
State:
$2,182
(% of AGI for various income ranges: 3.1% for AGIs below $25k, 0.8% for AGIs $25k-50k)
Percentage of individuals using paid preparers for their 2012 taxes: 67.9%
Here:
68%
State:
65%
(% for various income ranges: 63.6% for AGIs below $25k, 64.3% for AGIs $25k-50k, 67.7% for AGIs $50k-75k, 69.8% for AGIs $75k-100k, 71.2% for AGIs $100k-200k, 73.2% for AGIs over 200k)
Averages for the 2004 tax year for zip code 07661, filed in 2005:
Average Adjusted Gross Income (AGI) in 2004: $74,424 (Individual Income Tax Returns)
Here:
$74,424
State:
$64,921
Salary/wage: $72,010 (reported on 79.4% of returns)
Here:
$72,010
State:
$57,755
(% of AGI for various income ranges: 104.3% for AGIs below $10k, 52.2% for AGIs $10k-25k, 71.3% for AGIs $25k-50k, 73.8% for AGIs $50k-75k, 76.9% for AGIs $75k-100k, 79.1% for AGIs over 100k)
Taxable interest for individuals: $1,727 (reported on 72.8% of returns)
This zip code:
$1,727
New Jersey:
$2,068
(% of AGI for various income ranges: 17.3% for AGIs below $10k, 7.1% for AGIs $10k-25k, 3.2% for AGIs $25k-50k, 1.8% for AGIs $50k-75k, 1.8% for AGIs $75k-100k, 1.0% for AGIs over 100k)
Taxable dividends: $2,813 (reported on 48.7% of returns)
Here:
$2,813
State:
$3,959
(% of AGI for various income ranges: 12.1% for AGIs below $10k, 5.2% for AGIs $10k-25k, 2.4% for AGIs $25k-50k, 2.2% for AGIs $50k-75k, 2.2% for AGIs $75k-100k, 1.3% for AGIs over 100k)
Net capital gain/loss: +$7,003 (reported on 38.7% of returns)
Here:
+$7,003
State:
+$13,591
(% of AGI for various income ranges: -2.3% for AGIs below $10k, -0.1% for AGIs $10k-25k, 0.2% for AGIs $25k-50k, 0.4% for AGIs $50k-75k, 1.0% for AGIs $75k-100k, 5.6% for AGIs over 100k)
Profit/loss from business: +$16,142 (reported on 16.3% of returns)
Here:
+$16,142
State:
+$17,520
(% of AGI for various income ranges: 8.2% for AGIs below $10k, 10.2% for AGIs $10k-25k, 5.7% for AGIs $25k-50k, 4.8% for AGIs $50k-75k, 3.4% for AGIs $75k-100k, 2.6% for AGIs over 100k)
IRA payment deduction: $3,507 (reported on 4.2% of returns)
07661:
$3,507
New Jersey:
$3,270
(% of AGI for various income ranges: 0.4% for AGIs $10k-25k, 0.5% for AGIs $25k-50k, 0.3% for AGIs $50k-75k, 0.3% for AGIs $75k-100k, 0.1% for AGIs over 100k)
Self-employed pension: $12,221 (reported on 1.8% of returns)
Here:
$12,221
New Jersey:
$17,258
(% of AGI for various income ranges: 0.3% for AGIs $50k-75k, 0.3% for AGIs $75k-100k, 0.3% for AGIs over 100k)
Total itemized deductions: $24,422 (23% of AGI, reported on 58.5% of returns)
Here:
$24,422
State:
$23,924
Here:
22.6% of AGI
State:
21.1% of AGI
(% of AGI for various income ranges: 48.2% for AGIs below $10k, 30.7% for AGIs $10k-25k, 19.8% for AGIs $25k-50k, 20.9% for AGIs $50k-75k, 20.5% for AGIs $75k-100k, 17.6% for AGIs over 100k)
Charity contributions deductions: $2,803 (2% of AGI, reported on 53.6% of returns)
Here:
$2,803
State:
$3,242
Here:
2.5% of AGI
State:
2.7% of AGI
(% of AGI for various income ranges: 1.9% for AGIs below $10k, 2.1% for AGIs $10k-25k, 1.8% for AGIs $25k-50k, 1.9% for AGIs $50k-75k, 2.3% for AGIs $75k-100k, 2.0% for AGIs over 100k)
Total tax: $12,559 (reported on 83.3% of returns)
07661:
$12,559
State:
$12,321
(% of AGI for various income ranges: 4.6% for AGIs below $10k, 4.6% for AGIs $10k-25k, 7.9% for AGIs $25k-50k, 9.6% for AGIs $50k-75k, 10.4% for AGIs $75k-100k, 17.2% for AGIs over 100k)
Earned income credit: $1,396 (reported on 4.2% of returns)
Here:
$1,396
State:
$1,711
Percentage of individuals using paid preparers for their 2004 taxes: 67.3%
Here:
67%
State:
65%
(% for various income ranges: 60.5% for AGIs below $10k, 69.3% for AGIs $10k-25k, 65.1% for AGIs $25k-50k, 70.1% for AGIs $50k-75k, 71.4% for AGIs $75k-100k, 68.7% for AGIs over 100k)
Household received Food Stamps/SNAP in the past 12 months: 220 Household did not receive Food Stamps/SNAP in the past 12 months: 4,222
Women who had a birth in the past 12 months: 178 (182 now married, 0 unmarried) Women who did not have a birth in the past 12 months: 2,422 (1,583 now married, 826 unmarried)
Housing units in zip code 07661 with a mortgage: 2,222 (283 second mortgage, 279 both second mortgage and home equity loan) Houses without a mortgage: 70
Median monthly owner costs for units with a mortgage: $3,562 Median monthly owner costs for units without a mortgage: $1,425
Residents with income below the poverty level in 2022:
This zip code:
2.8%
Whole state:
9.7%
Residents with income below 50% of the poverty level in 2022:
This zip code:
2.2%
Whole state:
5.2%
Median number of rooms in houses and condos:
Here:
7.2
State:
6.8
Median number of rooms in apartments:
Here:
3.4
State:
3.9
Notable locations in this zip code not listed on our city pages
Notable locations in zip code 07661: River Edge Station (A), River Edge Ambulance Service (B), River Edge Fire Department Company 2 (C), River Edge Fire Department Company 1 (D), Zabriskie Von Steuben House (E), River Edge Free Public Library (F), River Edge Municipal Building (G). Display/hide their locations on the map
Churches in zip code 07661 include: First Congregational Church (A), Grace Lutheran Church (B), Reformed Church of Cherry Hill (C), Saint Peter The Apostle Roman Catholic Church (D). Display/hide their locations on the map
In group quarters: 14 (-1 institutionalized population)
Size of family households: 1,336 2-persons, 852 3-persons, 1,022 4-persons, 194 5-persons, 80 6-persons, 33 7-or-more-persons
Size of nonfamily households: 854 1-person, 76 2-persons
2,245 married couples with children.
178 single-parent households (41 men, 137 women).
64.2% of residents of 07661 zip code speak English at home.
4.2% of residents speak Spanish at home (76% very well, 17% well, 8% not well).
6.2% of residents speak other Indo-European language at home (66% very well, 13% well, 21% not well).
24.4% of residents speak Asian or Pacific Island language at home (62% very well, 29% well, 9% not well).
0.9% of residents speak other language at home (62% very well, 38% well).
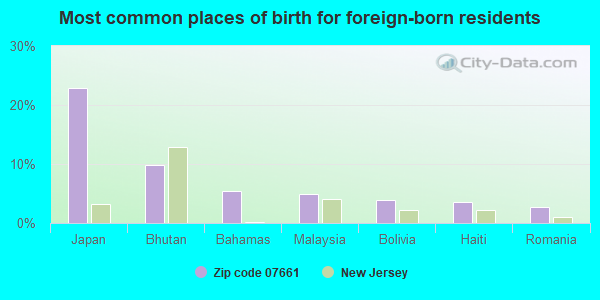
Foreign born population: 3,466 (28.8%) (66.5% of them are naturalized citizens)
This zip code:
28.8%
Whole state:
23.5%
23%Japan
10%Bhutan
5%Bahamas
5%Malaysia
4%Bolivia
3%Haiti
3%Romania
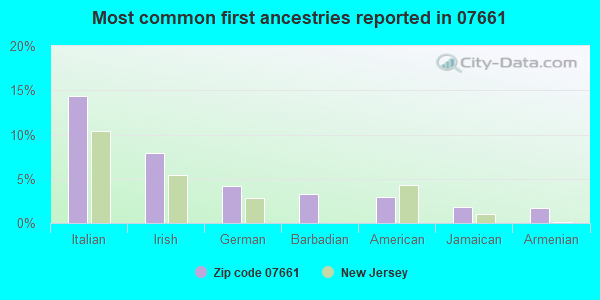
14%Italian
8%Irish
4%German
3%Barbadian
3%American
2%Jamaican
2%Armenian
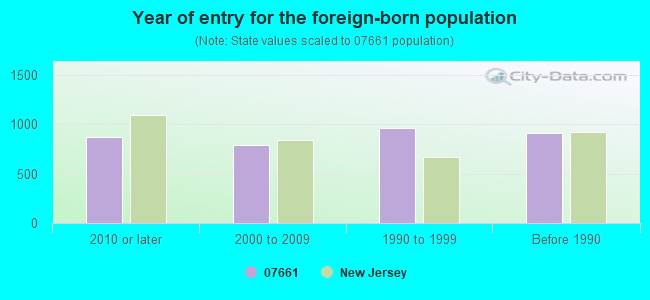
Year of entry for the foreign-born population
8702010 or later
7922000 to 2009
9621990 to 1999
908Before 1990
Facilities with environmental interests located in this zip code:
BP SERVICE STATION #3483 (525 HACKENSACK AVE in RIVER EDGE BORO, NJ)
STATE MASTER (New Jersey environmental info) - NJEMS-A0214, AIR PROGRAM, NJEMS-001165, STATE CLEANUP SITE, NJEMS-73999400000, EPCRA (Resource Conservation and Recovery Act (tracking hazardous waste)) Business SIC classification: GASOLINE SERVICE STATIONS Organizations: BP AMOCO OIL CORP, BP PRODUCTS NORTH AMERICA, BP PRODUCTS NORTH AMERICA INC (CONTACT/OWNER)
Alternative names: A R S ENTERPRISES T/A ABES AMOCO, AMOCO SERVICE STATION #3483
PERFECT CLEANERS & TAILORING (496 KINDERKAMACK ROAD in RIVER EDGE, NJ)
AIR MINOR (AIRS/AFS) STATE MASTER (New Jersey environmental info) - NJEMS-L0143, AIR PROGRAM (Resource Conservation and Recovery Act (tracking hazardous waste)) Business SIC classification: DRYCLEANING PLANTS, EXCEPT RUG CLEANING Alternative names: PERFECT CDRY CLEANER, PERFECT DRY CLEANERS
HALOCARBON PRODUCTS CORP (RIVER EDGE) (887 KINDERKAMACK RD in RIVER EDGE, NJ)
(Integrated Compliance Information System) - ICIS-HQ-1997-0469, FORMAL ENFORCEMENT ACTION STATE MASTER (New Jersey environmental info) - NJEMS-09206100001, EPCRA Business SIC classification: PHARMACEUTICAL PREPARATIONS; INDUSTRIAL ORGANIC CHEMICALS
FRANKS TEXACO SERVICE STATION #063 (536 KINDERKAMACK RD in RIVER EDGE, NJ)
STATE MASTER (New Jersey environmental info) - NJEMS-001850, STATE CLEANUP SITE, NJEMS-32827600000, EPCRA, NJEMS-A0008, AIR PROGRAM (Resource Conservation and Recovery Act (tracking hazardous waste)) Business SIC classification: GASOLINE SERVICE STATIONS Organizations: FRANK & SON YOUR 1 STOP AUTO REPAIR SHOP INC, LS RIVEREDGE PROPERTIES INC, IATTARELLI FRANK & CAROL (CONTACT/OWNER)
Alternative names: FRANKS TEXACO INC
EXXON SERVICE STATION RIVER EDGE (2 RTE 4 W in RIVER EDGE, NJ)
(Resource Conservation and Recovery Act (tracking hazardous waste)) Alternative names: EXXON CO USA-RIVER EDGE
FIRST FIDELITY BANK EXECUTOR (224 KINDERKAMACK RD in RIVER EDGE, NJ)
(Resource Conservation and Recovery Act (tracking hazardous waste)) Organizations: EST FRED KRAISSL JR (CONTACT/OWNER)
AUGUST PRESS (831 MAIN ST in RIVER EDGE, NJ)
(Resource Conservation and Recovery Act (tracking hazardous waste))
BERGEN COUNTY DEPT OF PARKS (FOREST HOWLAND & CONTINENTAL in RIVER EDGE, NJ)
(Resource Conservation and Recovery Act (tracking hazardous waste))
FORMER MOBIL OIL SERVICE STATION (821 KINDERKAMACK RD in RIVER EDGE, NJ)
(Resource Conservation and Recovery Act (tracking hazardous waste))
Housing units lacking complete kitchen facilities: 0.7%
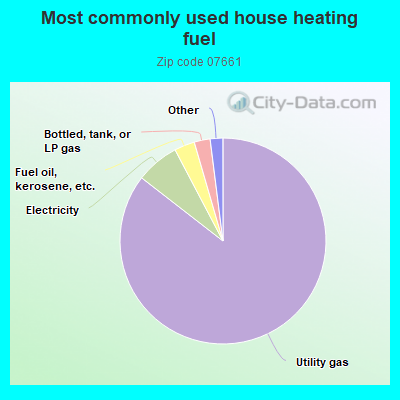
85.6%Utility gas
6.8%Electricity
3.2%Fuel oil, kerosene, etc.
2.5%Bottled, tank, or LP gas
1.0%No fuel used
0.8%Other fuel
Population in 1990: 10,603. Population change in the 1990s: +343 (+3.2%).
Place of birth for U.S.-born residents:
This state: 5,069
Northeast: 2,965
Midwest: 188
South: 188
West: 85
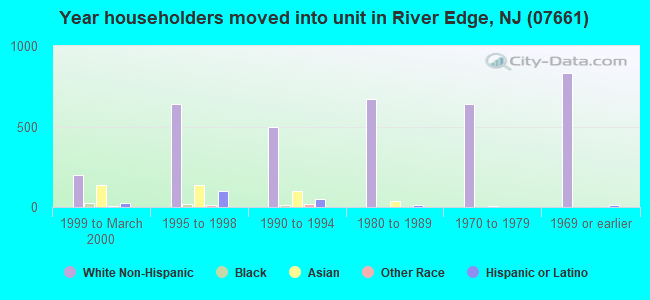
74% of the 07661 zip code residents lived in the same house 5 years ago. Out of people who lived in different houses, 59% lived in this county. Out of people who lived in different counties, 50% lived in New Jersey.
92% of the 07661 zip code residents lived in the same house 1 year ago. Out of people who lived in different houses, 55% moved from this county. Out of people who lived in different houses, 6% moved from different county within same state. Out of people who lived in different houses, 35% moved from different state. Out of people who lived in different houses, 6% moved from abroad.
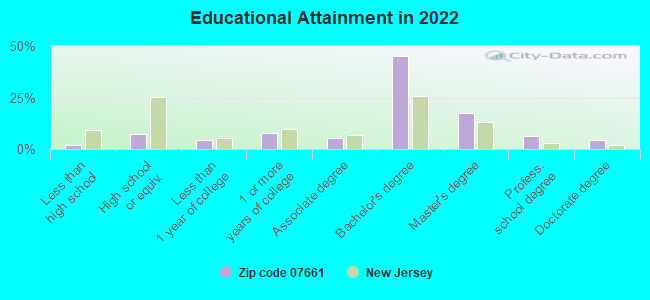
Private vs. public school enrollment:
Students in private schools in grades 1 to 8 (elementary and middle school):
Here:
0.0%
New Jersey:
12.3%
Students in private schools in grades 9 to 12 (high school): 26
Here:
4.4%
New Jersey:
13.1%
Students in private undergraduate colleges: 150
Here:
28.8%
New Jersey:
33.2%
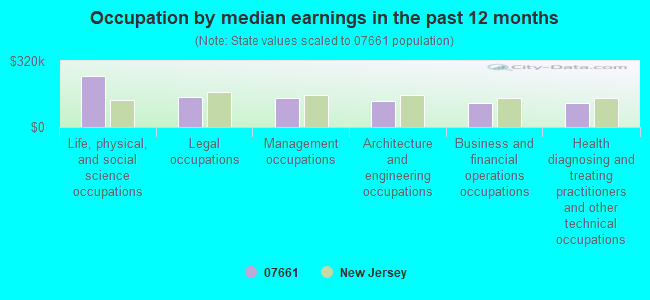
Occupation by median earnings in the past 12 months ($)
247,427Life, physical, and social science occupations
146,377Legal occupations
139,496Management occupations
123,785Architecture and engineering occupations
116,729Business and financial operations occupations
114,688Health diagnosing and treating practitioners and other technical occupations
Companies with federal contracts located in this zip code:
FINKS FUNKY CHICKEN & RIBS,INC (626 KINDERKAMACK RD in RIVER EDGE, NJ; small business) : $5,152 in 2 contractsin 2002
$9,240 with Army for Food Services. Signed on 2002-05-07. Completion date: 2002-06-08.
-$4,088, same as above.Signed on 2002-06-19. Completion date: 2002-06-08.
HIROX USA (1060 MAIN ST # 302 in RIVER EDGE, NJ; small business)
$3,650 with Navy for Optical Instruments, Test Equipment, Components and Accessories. Signed on 2006-03-01. Completion date: 2006-04-14.
Top industries in this zip code by the number of employees in 2005:
Health Care and Social Assistance: Offices of Physicians (except Mental Health Specialists) (100-249 employees: 1 establishment, 20-49 employees: 1 establishment, 10-19 employees: 3 establishments, 5-9 employees: 4 establishments, 1-4 employees: 2 establishments)
Professional, Scientific, and Technical Services: Offices of Lawyers (100-249: 1, 20-49: 1, 10-19: 2, 1-4: 7)
Educational Services: Elementary and Secondary Schools (100-249: 1, 5-9: 1)
Finance and Insurance: Real Estate Credit (100-249: 1, 1-4: 1)
Administrative and Support and Waste Management and Remediation Services: Security Guards and Patrol Services (100-249: 1)
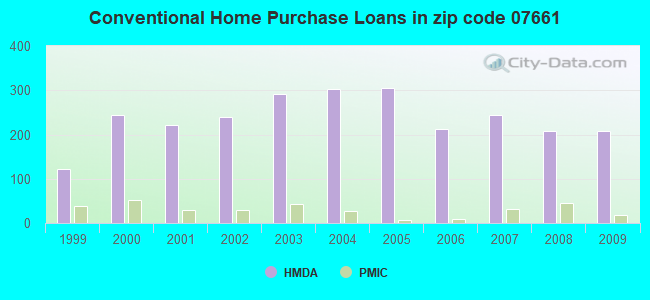
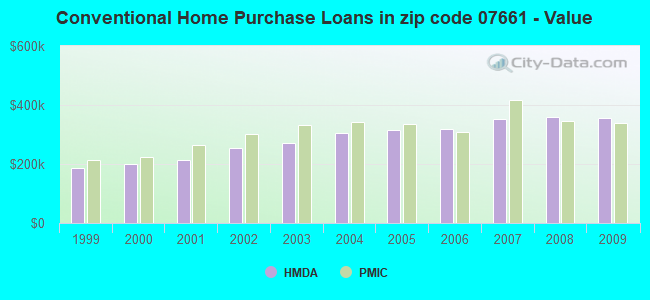
Detailed PMIC statistics for the following Tracts:0481.00
, 0482.00
2004 - 2018 National Fire Incident Reporting System (NFIRS) incidents
According to the data from the years 2004 - 2018 the average number of fires per year is 23. The highest number of fire incidents - 52 took place in 2005, and the least - 1 in 2013. The data has a rising trend.
When looking into fire subcategories, the most incidents belonged to: Structure Fires (64.9%), and Outside Fires (22.7%).
Fire incident types reported to NFIRS in Zip Code 07661


 Nearest zip codes: 07646, 07649, 07607, 07652, 07601, 07621.


 According to the data from the years 2004 - 2018 the average number of fires per year is 23. The highest number of fire incidents - 52 took place in 2005, and the least - 1 in 2013. The data has a rising trend.
 When looking into fire subcategories, the most incidents belonged to: Structure Fires (64.9%), and Outside Fires (22.7%).