Estimated zip code population in 2022: 10,053 Zip code population in 2010: 9,555 Zip code population in 2000: 9,523
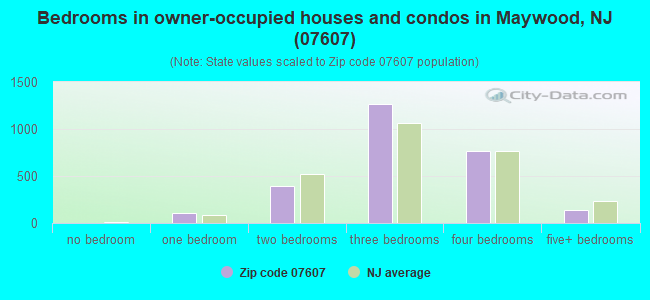
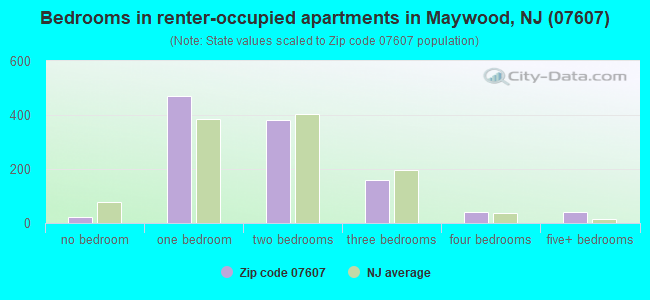
Houses and condos: 3,877 Renter-occupied apartments: 1,110
% of renters here:
29%
State:
35%
March 2022 cost of living index in zip code 07607: 117.8 (more than average, U.S. average is 100)
Land area: 1.3 sq. mi. Water area: 0.0 sq. mi.
Population density: 7,916 people per square mile
(high).
OSM Map
Google Map
MSN Map
OSM Map
General Map
Google Map
MSN Map
OSM Map
Google Map
MSN Map
OSM Map
Google Map
MSN Map
Please wait while loading the map...
Real estate property taxes paid for housing units in 2022:
This zip code:
1.9% ($9,521)
New Jersey:
2.1% ($8,897)
Median real estate property taxes paid for housing units with mortgages in 2022: $9,557 (1.9%) Median real estate property taxes paid for housing units with no mortgage in 2022: $9,483 (2.0%)
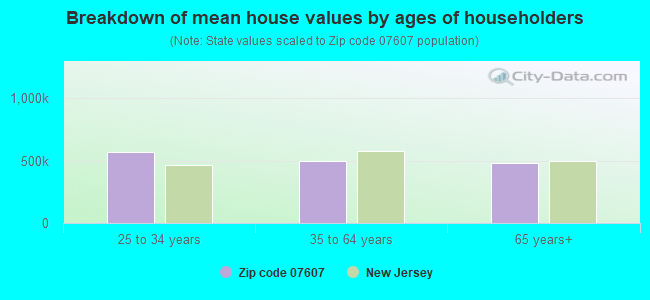
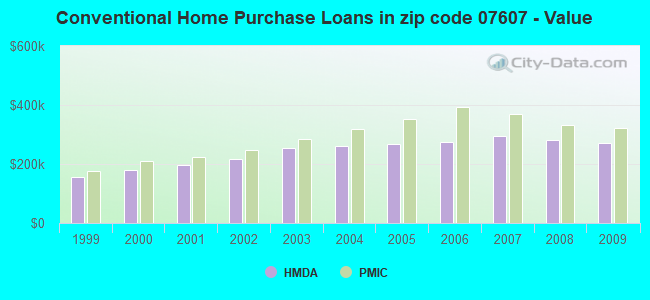
Estimated median house/condo value in 2022: $502,307
07607:
$502,307
New Jersey:
$428,900
According to our research of New Jersey and other state lists, there was 1 registered sex offender living in 07607 zip code as of April 27, 2024. The ratio of all residents to sex offenders in zip code 07607 is 9,865 to 1. The ratio of registered sex offenders to all residents in this zip code is much lower than the state average.
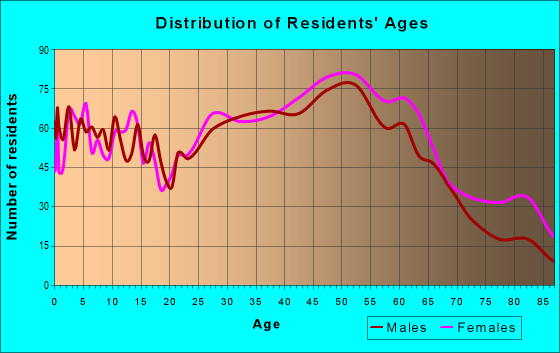
Median resident age:
This zip code:
45.1 years
New Jersey median age:
40.4 years
Average household size:
This zip code:
2.6 people
New Jersey:
2.6 people
Averages for the 2020 tax year for zip code 07607, filed in 2021:
Average Adjusted Gross Income (AGI) in 2020: $86,347 (Individual Income Tax Returns)
Here:
$86,347
State:
$95,247
Salary/wage: $76,689 (reported on 82.0% of returns)
Here:
$76,689
State:
$80,635
(% of AGI for various income ranges: 1086.2% for AGIs below $25k, 3681.5% for AGIs $25k-50k, 6645.1% for AGIs $50k-75k, 10608.3% for AGIs $75k-100k, 18471.3% for AGIs $100k-200k, 67830.8% for AGIs over 200k)
Taxable interest for individuals: $1,551 (reported on 35.3% of returns)
This zip code:
$1,551
New Jersey:
$2,414
(% of AGI for various income ranges: 29.9% for AGIs below $25k, 34.4% for AGIs $25k-50k, 57.2% for AGIs $50k-75k, 91.4% for AGIs $75k-100k, 122.8% for AGIs $100k-200k, 661.5% for AGIs over 200k)
Ordinary dividends: $3,916 (reported on 26.1% of returns)
Here:
$3,916
State:
$8,057
(% of AGI for various income ranges: 38.6% for AGIs below $25k, 46.8% for AGIs $25k-50k, 92.3% for AGIs $50k-75k, 206.1% for AGIs $75k-100k, 261.8% for AGIs $100k-200k, 1218.5% for AGIs over 200k)
Net capital gain/loss in AGI: +$10,705 (reported on 21.8% of returns)
Here:
+$10,705
State:
+$25,022
(% of AGI for various income ranges: 16.1% for AGIs below $25k, 27.9% for AGIs $25k-50k, 55.3% for AGIs $50k-75k, 204.2% for AGIs $75k-100k, 316.9% for AGIs $100k-200k, 6463.8% for AGIs over 200k)
Profit/loss from business: +$13,224 (reported on 17.8% of returns)
Here:
+$13,224
State:
+$18,035
(% of AGI for various income ranges: 178.0% for AGIs below $25k, 215.5% for AGIs $25k-50k, 117.5% for AGIs $50k-75k, 309.2% for AGIs $75k-100k, 592.7% for AGIs $100k-200k, 2696.2% for AGIs over 200k)
Taxable individual retirement arrangement distribution: $18,735 (reported on 9.4% of returns)
07607:
$18,735
New Jersey:
$21,558
(% of AGI for various income ranges: 72.6% for AGIs below $25k, 145.0% for AGIs $25k-50k, 197.7% for AGIs $50k-75k, 423.1% for AGIs $75k-100k, 456.4% for AGIs $100k-200k, 1366.2% for AGIs over 200k)
Self-employed (Keogh) retirement plans: $18,900 (reported on 0.8% of returns)
07607:
$18,900
New Jersey:
$30,844
(% of AGI for various income ranges: 112.8% for AGIs $100k-200k)
Total itemized deductions: $26,324 (reported on 16.9% of returns)
Here:
$26,324
State:
$32,863
(% of AGI for various income ranges: 188.6% for AGIs below $25k, 237.6% for AGIs $25k-50k, 546.8% for AGIs $50k-75k, 1046.7% for AGIs $75k-100k, 1271.8% for AGIs $100k-200k, 3255.4% for AGIs over 200k)
Charity contributions: $4,476 (reported on 13.9% of returns)
Here:
$4,476
State:
$7,880
(% of AGI for various income ranges: 9.6% for AGIs below $25k, 18.2% for AGIs $25k-50k, 47.5% for AGIs $50k-75k, 112.2% for AGIs $75k-100k, 190.4% for AGIs $100k-200k, 795.4% for AGIs over 200k)
Taxes paid: $9,352 (reported on 16.9% of returns)
07607:
$9,352
State:
$9,183
(% of AGI for various income ranges: 60.8% for AGIs below $25k, 83.0% for AGIs $25k-50k, 198.6% for AGIs $50k-75k, 397.8% for AGIs $75k-100k, 453.3% for AGIs $100k-200k, 1101.5% for AGIs over 200k)
Earned income credit: $1,822 (reported on 8.8% of returns)
Here:
$1,822
State:
$2,148
(% of AGI for various income ranges: 65.3% for AGIs below $25k, 49.1% for AGIs $25k-50k)
Percentage of individuals using paid preparers for their 2020 taxes: 92.9%
Here:
93%
State:
92%
(% for various income ranges: 89.8% for AGIs below $25k, 93.5% for AGIs $25k-50k, 93.7% for AGIs $50k-75k, 93.3% for AGIs $75k-100k, 93.8% for AGIs $100k-200k, 97.4% for AGIs over 200k)
Averages for the 2012 tax year for zip code 07607, filed in 2013:
Average Adjusted Gross Income (AGI) in 2012: $70,431 (Individual Income Tax Returns)
Here:
$70,431
State:
$79,688
Salary/wage: $65,978 (reported on 83.2% of returns)
Here:
$65,978
State:
$68,122
(% of AGI for various income ranges: 65.4% for AGIs below $25k, 75.5% for AGIs $25k-50k, 79.1% for AGIs $50k-75k, 76.1% for AGIs $75k-100k, 83.1% for AGIs $100k-200k, 72.2% for AGIs over 200k)
Taxable interest for individuals: $1,233 (reported on 44.0% of returns)
This zip code:
$1,233
New Jersey:
$2,193
(% of AGI for various income ranges: 1.9% for AGIs below $25k, 1.0% for AGIs $25k-50k, 1.0% for AGIs $50k-75k, 0.8% for AGIs $75k-100k, 0.5% for AGIs $100k-200k, 0.7% for AGIs over 200k)
Ordinary dividends: $3,681 (reported on 28.2% of returns)
Here:
$3,681
State:
$6,828
(% of AGI for various income ranges: 2.3% for AGIs below $25k, 1.7% for AGIs $25k-50k, 0.9% for AGIs $50k-75k, 1.8% for AGIs $75k-100k, 1.1% for AGIs $100k-200k, 2.2% for AGIs over 200k)
Net capital gain/loss in AGI: +$5,534 (reported on 19.5% of returns)
Here:
+$5,534
State:
+$15,358
(% of AGI for various income ranges: 0.4% for AGIs $75k-100k, 0.5% for AGIs $100k-200k, 7.2% for AGIs over 200k)
Profit/loss from business: +$14,621 (reported on 14.2% of returns)
Here:
+$14,621
State:
+$19,577
(% of AGI for various income ranges: 8.8% for AGIs below $25k, 5.1% for AGIs $25k-50k, 3.1% for AGIs $50k-75k, 2.8% for AGIs $75k-100k, 1.9% for AGIs $100k-200k, 2.3% for AGIs over 200k)
Taxable individual retirement arrangement distribution: $13,647 (reported on 11.6% of returns)
07607:
$13,647
New Jersey:
$18,214
(% of AGI for various income ranges: 4.3% for AGIs below $25k, 2.4% for AGIs $25k-50k, 2.7% for AGIs $50k-75k, 2.3% for AGIs $75k-100k, 2.8% for AGIs $100k-200k)
Self-employment retirement plans: $11,750 (reported on 0.8% of returns)
07607:
$11,750
New Jersey:
$24,511
Total itemized deductions: $25,192 (24% of AGI, reported on 48.7% of returns)
Here:
$25,192
State:
$30,827
Here:
23.7% of AGI
State:
21.2% of AGI
(% of AGI for various income ranges: 20.2% for AGIs below $25k, 17.2% for AGIs $25k-50k, 15.9% for AGIs $50k-75k, 17.8% for AGIs $75k-100k, 18.8% for AGIs $100k-200k, 14.7% for AGIs over 200k)
Charity contributions: $2,241 (reported on 41.2% of returns)
Here:
$2,241
State:
$3,451
(% of AGI for various income ranges: 0.9% for AGIs below $25k, 1.2% for AGIs $25k-50k, 1.2% for AGIs $50k-75k, 1.5% for AGIs $75k-100k, 1.4% for AGIs $100k-200k, 1.2% for AGIs over 200k)
Taxes paid: $12,390 (reported on 48.3% of returns)
07607:
$12,390
State:
$15,801
(% of AGI for various income ranges: 8.5% for AGIs below $25k, 6.7% for AGIs $25k-50k, 6.9% for AGIs $50k-75k, 8.2% for AGIs $75k-100k, 9.3% for AGIs $100k-200k, 9.3% for AGIs over 200k)
Earned income credit: $1,909 (reported on 9.1% of returns)
Here:
$1,909
State:
$2,182
(% of AGI for various income ranges: 3.9% for AGIs below $25k, 0.7% for AGIs $25k-50k)
Percentage of individuals using paid preparers for their 2012 taxes: 69.8%
Here:
70%
State:
65%
(% for various income ranges: 65.9% for AGIs below $25k, 70.1% for AGIs $25k-50k, 67.9% for AGIs $50k-75k, 73.7% for AGIs $75k-100k, 71.9% for AGIs $100k-200k, 80.0% for AGIs over 200k)
Averages for the 2004 tax year for zip code 07607, filed in 2005:
Average Adjusted Gross Income (AGI) in 2004: $56,746 (Individual Income Tax Returns)
Here:
$56,746
State:
$64,921
Salary/wage: $54,642 (reported on 83.1% of returns)
Here:
$54,642
State:
$57,755
(% of AGI for various income ranges: 89.9% for AGIs below $10k, 64.0% for AGIs $10k-25k, 79.8% for AGIs $25k-50k, 78.7% for AGIs $50k-75k, 84.6% for AGIs $75k-100k, 80.3% for AGIs over 100k)
Taxable interest for individuals: $1,425 (reported on 61.3% of returns)
This zip code:
$1,425
New Jersey:
$2,068
(% of AGI for various income ranges: 7.8% for AGIs below $10k, 4.9% for AGIs $10k-25k, 2.0% for AGIs $25k-50k, 2.2% for AGIs $50k-75k, 1.1% for AGIs $75k-100k, 0.7% for AGIs over 100k)
Taxable dividends: $2,667 (reported on 35.5% of returns)
Here:
$2,667
State:
$3,959
(% of AGI for various income ranges: 5.7% for AGIs below $10k, 3.3% for AGIs $10k-25k, 1.5% for AGIs $25k-50k, 2.0% for AGIs $50k-75k, 1.4% for AGIs $75k-100k, 1.5% for AGIs over 100k)
Net capital gain/loss: +$5,073 (reported on 26.7% of returns)
Here:
+$5,073
State:
+$13,591
(% of AGI for various income ranges: -2.0% for AGIs below $10k, -0.3% for AGIs $10k-25k, 0.3% for AGIs $25k-50k, 0.6% for AGIs $50k-75k, 1.0% for AGIs $75k-100k, 5.0% for AGIs over 100k)
Profit/loss from business: +$14,176 (reported on 13.8% of returns)
Here:
+$14,176
State:
+$17,520
(% of AGI for various income ranges: 9.4% for AGIs below $10k, 8.0% for AGIs $10k-25k, 3.6% for AGIs $25k-50k, 3.1% for AGIs $50k-75k, 2.5% for AGIs $75k-100k, 3.3% for AGIs over 100k)
IRA payment deduction: $3,247 (reported on 3.9% of returns)
07607:
$3,247
New Jersey:
$3,270
(% of AGI for various income ranges: 0.4% for AGIs $10k-25k, 0.3% for AGIs $25k-50k, 0.3% for AGIs $50k-75k, 0.2% for AGIs $75k-100k, 0.1% for AGIs over 100k)
Self-employed pension: $14,405 (reported on 0.8% of returns)
Here:
$14,405
New Jersey:
$17,258
Total itemized deductions: $20,031 (24% of AGI, reported on 50.1% of returns)
Here:
$20,031
State:
$23,924
Here:
24.0% of AGI
State:
21.1% of AGI
(% of AGI for various income ranges: 31.2% for AGIs below $10k, 21.1% for AGIs $10k-25k, 16.9% for AGIs $25k-50k, 18.6% for AGIs $50k-75k, 19.4% for AGIs $75k-100k, 16.0% for AGIs over 100k)
Charity contributions deductions: $2,209 (3% of AGI, reported on 46.0% of returns)
Here:
$2,209
State:
$3,242
Here:
2.6% of AGI
State:
2.7% of AGI
(% of AGI for various income ranges: 1.3% for AGIs below $10k, 1.8% for AGIs $10k-25k, 1.5% for AGIs $25k-50k, 1.9% for AGIs $50k-75k, 2.0% for AGIs $75k-100k, 1.7% for AGIs over 100k)
Total tax: $8,229 (reported on 82.6% of returns)
07607:
$8,229
State:
$12,321
(% of AGI for various income ranges: 3.2% for AGIs below $10k, 4.6% for AGIs $10k-25k, 7.6% for AGIs $25k-50k, 9.6% for AGIs $50k-75k, 10.6% for AGIs $75k-100k, 16.2% for AGIs over 100k)
Earned income credit: $1,421 (reported on 6.5% of returns)
Here:
$1,421
State:
$1,711
Percentage of individuals using paid preparers for their 2004 taxes: 67.2%
Here:
67%
State:
65%
(% for various income ranges: 60.8% for AGIs below $10k, 65.0% for AGIs $10k-25k, 66.9% for AGIs $25k-50k, 69.0% for AGIs $50k-75k, 70.5% for AGIs $75k-100k, 71.9% for AGIs over 100k)
Likely homosexual households (counted as self-reported same-sex unmarried-partner households)
Lesbian couples: 0.1% of all households
Gay men: 0.0% of all households
Household received Food Stamps/SNAP in the past 12 months: 257 Household did not receive Food Stamps/SNAP in the past 12 months: 3,515
Women who had a birth in the past 12 months: 112 (107 now married, 6 unmarried) Women who did not have a birth in the past 12 months: 1,973 (942 now married, 1,028 unmarried)
Housing units in zip code 07607 with a mortgage: 1,612 (124 second mortgage, 104 both second mortgage and home equity loan) Houses without a mortgage: 84
Median monthly owner costs for units with a mortgage: $2,843 Median monthly owner costs for units without a mortgage: $1,134
Residents with income below the poverty level in 2022:
This zip code:
4.1%
Whole state:
9.7%
Residents with income below 50% of the poverty level in 2022:
This zip code:
3.0%
Whole state:
5.2%
Median number of rooms in houses and condos:
Here:
6.7
State:
6.8
Median number of rooms in apartments:
Here:
4.2
State:
3.9
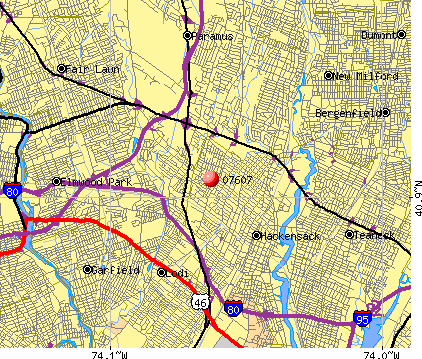
Notable locations in this zip code not listed on our city pages
Notable locations in zip code 07607: Maywood Fire Department Station 2 (A), Maywood Fire Department Station 1 (B), Maywood First Aid and Emergency Squad (C), Maywood Boro Hall (D), Maywood Public Library (E). Display/hide their locations on the map
Churches in zip code 07607 include: Zion Lutheran Church (A), Japanese Christian Church (B), Crossroads Community Church (C), Lutheran Church of the Redeemer (D), Our Lady Queen of Peace Church (E), First Presbyterian Church (F), Jehovahs Witnesses Kingdom Hall (G), Saint Martins Episcopal Church (H). Display/hide their locations on the map
In group quarters: 37 (-1 institutionalized population)
Size of family households: 1,048 2-persons, 675 3-persons, 589 4-persons, 222 5-persons, 123 6-persons, 16 7-or-more-persons
Size of nonfamily households: 865 1-person, 237 2-persons, 8 3-persons
1,370 married couples with children.
173 single-parent households (27 men, 146 women).
63.3% of residents of 07607 zip code speak English at home.
16.9% of residents speak Spanish at home (71% very well, 20% well, 7% not well, 2% not at all).
7.8% of residents speak other Indo-European language at home (68% very well, 17% well, 15% not well).
10.0% of residents speak Asian or Pacific Island language at home (54% very well, 19% well, 21% not well, 6% not at all).
1.9% of residents speak other language at home (60% very well, 25% well, 11% not well, 4% not at all).
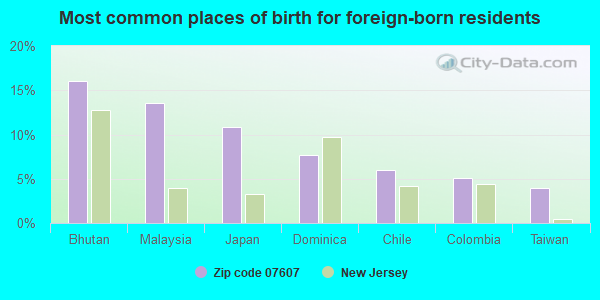
Foreign born population: 2,498 (24.8%) (73.7% of them are naturalized citizens)
This zip code:
24.8%
Whole state:
23.5%
16%Bhutan
14%Malaysia
11%Japan
8%Dominica
6%Chile
5%Colombia
4%Taiwan
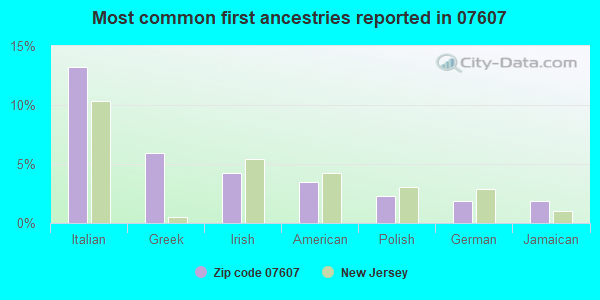
13%Italian
6%Greek
4%Irish
3%American
2%Polish
2%German
2%Jamaican
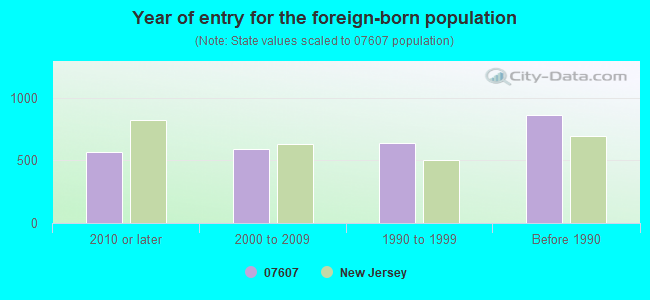
Year of entry for the foreign-born population
5672010 or later
5892000 to 2009
6411990 to 1999
863Before 1990
Facilities with environmental interests located in this zip code:
FEDERAL EXPRESS CORP (29 ESSEX STREET in MAYWOOD, NJ)
STATE MASTER (New Jersey environmental info) - NJEMS-35293900008, EPCRA, NJEMS-48088, National Pollutant Discharge Elimination System Permit National Pollutant Discharge Elimination System NON-MAJOR (Tracking pollutant discharge elimination systems) - permit (Resource Conservation and Recovery Act (tracking hazardous waste)) Business SIC classification: AIR COURIER SERVICES Organizations: MAYWOOD JOINT VENTURE (CONTACT/OWNER)
CIRCUIT REPRODUCTIONS CO INC (219 HAERGESELL AVENUE in MAYWOOD, NJ)
STATE MASTER (New Jersey environmental info) - NJEMS-63941100000, EPCRA, NJEMS-NJD986609279, HAZARDOUS WASTE PROGRAM HAZARDOUS WASTE BIENNIAL REPORTER (Resource Conservation and Recovery Act (tracking hazardous waste)) Large Quantity Generators, more that 1000 kg of hazardous waste/month (Resource Conservation and Recovery Act (tracking hazardous waste)) Business SIC classification: PRINTED CIRCUIT BOARDS Business NAICS classification: BARE PRINTED CIRCUIT BOARD MANUFACTURING. Organizations: CIRCUIT REPRODUCTION CO, CIRCUIT REPRODUCTION COMPANY INC (CONTACT/OPERATOR)
Alternative names: CIRCUIT REPRODUCTION CO INC
PARK AVE MOTOR CORP (250 W PASSAIC ST in MAYWOOD, NJ)
STATE MASTER (New Jersey environmental info) - NJEMS-010009, STATE CLEANUP SITE, NJEMS-030905, NJEMS-40154900000, EPCRA (Resource Conservation and Recovery Act (tracking hazardous waste)) Business SIC classification: MOTOR VEHICLE DEALERS (NEW AND USED) Organizations: PARK AVENUE BMW, SOMMERHALTER RW (CONTACT/OWNER)
PHARMA QUALITY SERVICES (230 W PASSAIC ST GROUND FLOOR in MAYWOOD, NJ)
STATE MASTER (New Jersey environmental info) - NJEMS-NJR000030734, HAZARDOUS WASTE PROGRAM Conditionally Exempt Small Quantity Generators, less than 100 kg/month of hazardous waste (Resource Conservation and Recovery Act (tracking hazardous waste)) - notification Organizations: PHARNA QUALITY SERVICE, ELLSWORTH INC (CONTACT/OWNER)
FIT & FASHION TAILORS (44 W PLEASANT AVE in MAYWOOD, NJ)
STATE MASTER (New Jersey environmental info) - NJEMS-91879300000, EPCRA, NJEMS-G000038020, STATE CLEANUP SITE, NJEMS-L0282, AIR PROGRAM Small Quantity Generators, between 100 kg and 1000 kg of hazardous waste/month (Resource Conservation and Recovery Act (tracking hazardous waste)) - notification Business SIC classification: DRYCLEANING PLANTS, EXCEPT RUG CLEANING Organizations: FIT N FASHION TAILORS, IMER RECI (CONTACT/OWNER)
CHEVRON 204081 (239 N RTE 17 in MAYWOOD, NJ)
Large Quantity Generators, more that 1000 kg of hazardous waste/month (Resource Conservation and Recovery Act (tracking hazardous waste)) Organizations: CFL (CONTACT/OPERATOR)
, CFI (CONTACT/OWNER)
NEW JERSEY BELL TELEPHONE CO (113 ESSEX ST in MAYWOOD, NJ)
(Resource Conservation and Recovery Act (tracking hazardous waste))
HESS STATION #30321 (RTE 17 & BECKER AVE in MAYWOOD, NJ)
Small Quantity Generators, between 100 kg and 1000 kg of hazardous waste/month (Resource Conservation and Recovery Act (tracking hazardous waste)) - notification Organizations: AMERADA HESS CORP (CONTACT/OWNER)
AMF WHITELY DIVISION (29 ESSEX STREET in MAYWOOD, NJ)
(Resource Conservation and Recovery Act (tracking hazardous waste))
Housing units lacking complete kitchen facilities: 1.3%
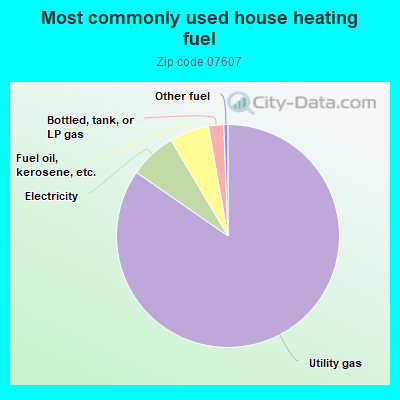
84.5%Utility gas
6.8%Electricity
5.7%Fuel oil, kerosene, etc.
2.2%Bottled, tank, or LP gas
0.6%Other fuel
Population in 1990: 9,473. Population change in the 1990s: +50 (+0.5%).
Place of birth for U.S.-born residents:
This state: 4,733
Northeast: 1,892
Midwest: 82
South: 212
West: 421
68% of the 07607 zip code residents lived in the same house 5 years ago. Out of people who lived in different houses, 63% lived in this county. Out of people who lived in different counties, 50% lived in New Jersey.
86% of the 07607 zip code residents lived in the same house 1 year ago. Out of people who lived in different houses, 54% moved from this county. Out of people who lived in different houses, 7% moved from different county within same state. Out of people who lived in different houses, 35% moved from different state. Out of people who lived in different houses, 4% moved from abroad.
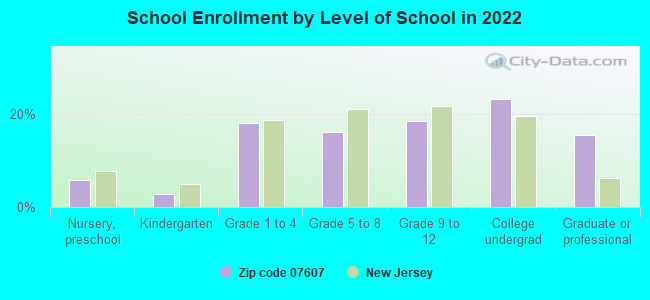
Private vs. public school enrollment:
Students in private schools in grades 1 to 8 (elementary and middle school): 44
Here:
5.6%
New Jersey:
12.3%
Students in private schools in grades 9 to 12 (high school): 110
Here:
25.4%
New Jersey:
13.1%
Students in private undergraduate colleges: 268
Here:
49.0%
New Jersey:
33.2%
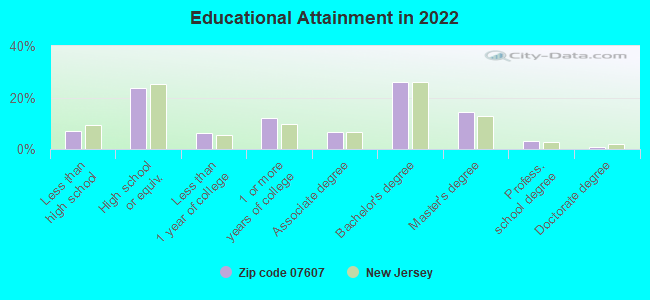
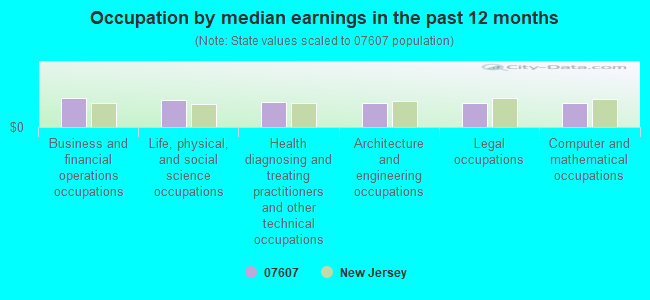
Occupation by median earnings in the past 12 months ($)
110,825Business and financial operations occupations
100,873Life, physical, and social science occupations
94,457Health diagnosing and treating practitioners and other technical occupations
92,331Architecture and engineering occupations
91,361Legal occupations
88,848Computer and mathematical occupations
Companies with federal contracts located in this zip code:
SOCIETY FOR EXPERIMENTAL BIOLO (197 W SPRING VALLEY AVE in MAYWOOD, NJ)
$2,902 with Army for Newspapers and Periodicals. Signed on 2004-10-27. Completion date: 2004-11-10.
Top industries in this zip code by the number of employees in 2005:
2002 - 2018 National Fire Incident Reporting System (NFIRS) incidents
According to the data from the years 2002 - 2018 the average number of fire incidents per year is 17. The highest number of reported fires - 34 took place in 2006, and the least - 2 in 2002. The data has a rising trend.
When looking into fire subcategories, the most incidents belonged to: Structure Fires (58.9%), and Outside Fires (17.7%).
Fire incident types reported to NFIRS in Zip Code 07607


 Nearest zip codes: 07662, 07601, 07663, 07644, 07661, 07604.


 According to the data from the years 2002 - 2018 the average number of fire incidents per year is 17. The highest number of reported fires - 34 took place in 2006, and the least - 2 in 2002. The data has a rising trend.
 When looking into fire subcategories, the most incidents belonged to: Structure Fires (58.9%), and Outside Fires (17.7%).