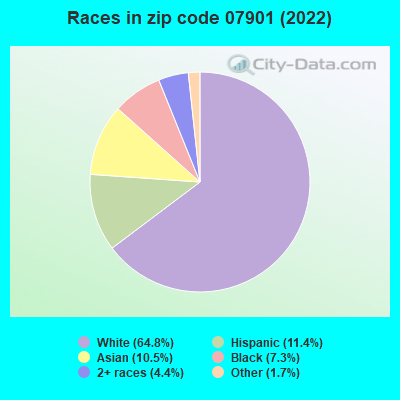
Estimated zip code population in 2022: 24,314 Zip code population in 2010: 22,806 Zip code population in 2000: 22,634
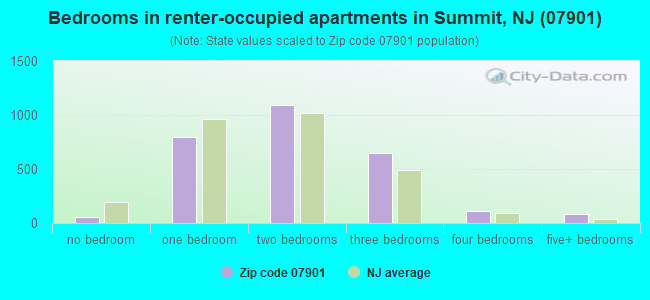
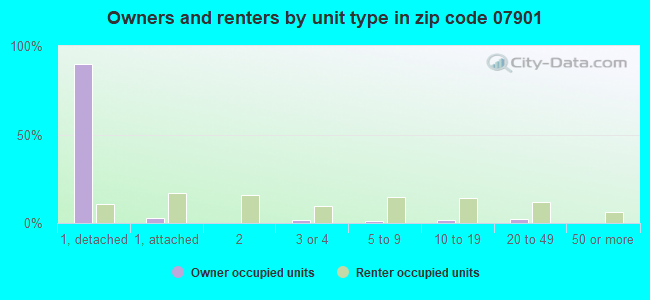
Houses and condos: 9,321 Renter-occupied apartments: 2,811
% of renters here:
31%
State:
35%
March 2022 cost of living index in zip code 07901: 116.7 (more than average, U.S. average is 100)
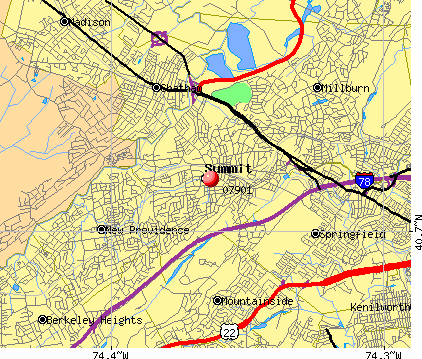
Land area: 6.3 sq. mi. Water area: 0.1 sq. mi.
Population density: 3,842 people per square mile
(average).
OSM Map
Google Map
MSN Map
OSM Map
General Map
Google Map
MSN Map
OSM Map
Google Map
MSN Map
OSM Map
Google Map
MSN Map
Please wait while loading the map...
Real estate property taxes paid for housing units in 2022:
This zip code:
1.0% ($9,521)
New Jersey:
2.1% ($8,897)
Median real estate property taxes paid for housing units with mortgages in 2022: $9,557 (1.0%) Median real estate property taxes paid for housing units with no mortgage in 2022: $9,483 (1.0%)
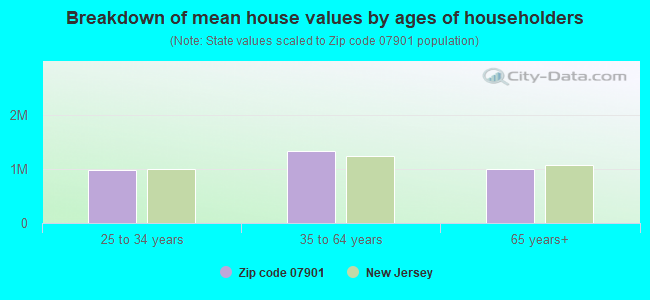
Estimated median house/condo value in 2022: $966,467
07901:
$966,467
New Jersey:
$428,900
According to our research of New Jersey and other state lists, there was 1 registered sex offender living in 07901 zip code as of April 27, 2024. The ratio of all residents to sex offenders in zip code 07901 is 23,609 to 1. The ratio of registered sex offenders to all residents in this zip code is much lower than the state average.
Median resident age:
This zip code:
41.0 years
New Jersey median age:
40.4 years
Average household size:
This zip code:
2.7 people
New Jersey:
2.6 people
Averages for the 2020 tax year for zip code 07901, filed in 2021:
Average Adjusted Gross Income (AGI) in 2020: $381,474 (Individual Income Tax Returns)
Here:
$381,474
State:
$95,247
Salary/wage: $265,295 (reported on 80.0% of returns)
Here:
$265,295
State:
$80,635
(% of AGI for various income ranges: 1260.5% for AGIs below $25k, 4034.4% for AGIs $25k-50k, 7246.1% for AGIs $50k-75k, 10442.1% for AGIs $75k-100k, 21020.4% for AGIs $100k-200k, 226907.2% for AGIs over 200k)
Taxable interest for individuals: $12,473 (reported on 53.2% of returns)
This zip code:
$12,473
New Jersey:
$2,414
(% of AGI for various income ranges: 35.3% for AGIs below $25k, 60.9% for AGIs $25k-50k, 109.5% for AGIs $50k-75k, 170.8% for AGIs $75k-100k, 297.7% for AGIs $100k-200k, 7636.2% for AGIs over 200k)
Ordinary dividends: $24,626 (reported on 54.0% of returns)
Here:
$24,626
State:
$8,057
(% of AGI for various income ranges: 173.6% for AGIs below $25k, 211.6% for AGIs $25k-50k, 316.1% for AGIs $50k-75k, 801.8% for AGIs $75k-100k, 1200.5% for AGIs $100k-200k, 14282.8% for AGIs over 200k)
Net capital gain/loss in AGI: +$158,981 (reported on 49.7% of returns)
Here:
+$158,981
State:
+$25,022
(% of AGI for various income ranges: 122.5% for AGIs below $25k, 179.9% for AGIs $25k-50k, 278.7% for AGIs $50k-75k, 453.6% for AGIs $75k-100k, 1199.8% for AGIs $100k-200k, 95376.4% for AGIs over 200k)
Profit/loss from business: +$38,129 (reported on 19.6% of returns)
Here:
+$38,129
State:
+$18,035
(% of AGI for various income ranges: 332.3% for AGIs below $25k, 384.0% for AGIs $25k-50k, 372.5% for AGIs $50k-75k, 542.8% for AGIs $75k-100k, 1223.5% for AGIs $100k-200k, 6797.4% for AGIs over 200k)
Taxable individual retirement arrangement distribution: $40,017 (reported on 9.7% of returns)
07901:
$40,017
New Jersey:
$21,558
(% of AGI for various income ranges: 58.7% for AGIs below $25k, 112.2% for AGIs $25k-50k, 326.6% for AGIs $50k-75k, 513.3% for AGIs $75k-100k, 1075.2% for AGIs $100k-200k, 3163.4% for AGIs over 200k)
Self-employed (Keogh) retirement plans: $42,552 (reported on 4.0% of returns)
07901:
$42,552
New Jersey:
$30,844
(% of AGI for various income ranges: 35.8% for AGIs $25k-50k, 85.7% for AGIs $100k-200k, 1993.1% for AGIs over 200k)
Total itemized deductions: $50,298 (reported on 30.3% of returns)
Here:
$50,298
State:
$32,863
(% of AGI for various income ranges: 211.4% for AGIs below $25k, 381.5% for AGIs $25k-50k, 628.4% for AGIs $50k-75k, 1122.3% for AGIs $75k-100k, 1915.3% for AGIs $100k-200k, 15430.1% for AGIs over 200k)
Charity contributions: $18,614 (reported on 27.0% of returns)
Here:
$18,614
State:
$7,880
(% of AGI for various income ranges: 9.0% for AGIs below $25k, 29.9% for AGIs $25k-50k, 62.1% for AGIs $50k-75k, 128.5% for AGIs $75k-100k, 266.8% for AGIs $100k-200k, 5789.6% for AGIs over 200k)
Taxes paid: $9,806 (reported on 30.3% of returns)
07901:
$9,806
State:
$9,183
(% of AGI for various income ranges: 59.2% for AGIs below $25k, 93.1% for AGIs $25k-50k, 178.5% for AGIs $50k-75k, 327.4% for AGIs $75k-100k, 612.0% for AGIs $100k-200k, 2665.5% for AGIs over 200k)
Earned income credit: $1,918 (reported on 5.0% of returns)
Here:
$1,918
State:
$2,148
(% of AGI for various income ranges: 61.7% for AGIs below $25k, 45.7% for AGIs $25k-50k)
Percentage of individuals using paid preparers for their 2020 taxes: 91.8%
Here:
92%
State:
92%
(% for various income ranges: 86.3% for AGIs below $25k, 90.0% for AGIs $25k-50k, 90.2% for AGIs $50k-75k, 93.2% for AGIs $75k-100k, 92.8% for AGIs $100k-200k, 95.7% for AGIs over 200k)
Averages for the 2012 tax year for zip code 07901, filed in 2013:
Average Adjusted Gross Income (AGI) in 2012: $276,338 (Individual Income Tax Returns)
Here:
$276,338
State:
$79,688
Salary/wage: $221,350 (reported on 79.0% of returns)
Here:
$221,350
State:
$68,122
(% of AGI for various income ranges: 63.8% for AGIs below $25k, 71.9% for AGIs $25k-50k, 68.2% for AGIs $50k-75k, 67.4% for AGIs $75k-100k, 72.0% for AGIs $100k-200k, 62.0% for AGIs over 200k)
Taxable interest for individuals: $8,505 (reported on 57.2% of returns)
This zip code:
$8,505
New Jersey:
$2,193
(% of AGI for various income ranges: 2.0% for AGIs below $25k, 1.4% for AGIs $25k-50k, 1.4% for AGIs $50k-75k, 1.5% for AGIs $75k-100k, 1.1% for AGIs $100k-200k, 1.8% for AGIs over 200k)
Ordinary dividends: $22,345 (reported on 52.5% of returns)
Here:
$22,345
State:
$6,828
(% of AGI for various income ranges: 11.2% for AGIs below $25k, 3.4% for AGIs $25k-50k, 4.8% for AGIs $50k-75k, 4.8% for AGIs $75k-100k, 4.0% for AGIs $100k-200k, 4.2% for AGIs over 200k)
Net capital gain/loss in AGI: +$62,487 (reported on 46.0% of returns)
Here:
+$62,487
State:
+$15,358
(% of AGI for various income ranges: 1.0% for AGIs below $25k, 1.9% for AGIs $25k-50k, 0.9% for AGIs $50k-75k, 1.4% for AGIs $75k-100k, 2.1% for AGIs $100k-200k, 12.0% for AGIs over 200k)
Profit/loss from business: +$37,244 (reported on 17.9% of returns)
Here:
+$37,244
State:
+$19,577
(% of AGI for various income ranges: 11.7% for AGIs below $25k, 5.6% for AGIs $25k-50k, 4.6% for AGIs $50k-75k, 3.8% for AGIs $75k-100k, 4.4% for AGIs $100k-200k, 1.9% for AGIs over 200k)
Taxable individual retirement arrangement distribution: $37,912 (reported on 13.3% of returns)
07901:
$37,912
New Jersey:
$18,214
(% of AGI for various income ranges: 3.6% for AGIs below $25k, 2.9% for AGIs $25k-50k, 3.2% for AGIs $50k-75k, 5.5% for AGIs $75k-100k, 4.6% for AGIs $100k-200k, 1.4% for AGIs over 200k)
Self-employment retirement plans: $33,363 (reported on 4.0% of returns)
07901:
$33,363
New Jersey:
$24,511
(% of AGI for various income ranges: 0.3% for AGIs $50k-75k, 0.4% for AGIs $100k-200k, 0.5% for AGIs over 200k)
Total itemized deductions: $82,195 (18% of AGI, reported on 56.7% of returns)
Here:
$82,195
State:
$30,827
Here:
17.8% of AGI
State:
21.2% of AGI
(% of AGI for various income ranges: 21.9% for AGIs below $25k, 17.4% for AGIs $25k-50k, 17.8% for AGIs $50k-75k, 19.9% for AGIs $75k-100k, 21.4% for AGIs $100k-200k, 16.2% for AGIs over 200k)
Charity contributions: $11,623 (reported on 50.8% of returns)
Here:
$11,623
State:
$3,451
(% of AGI for various income ranges: 0.7% for AGIs below $25k, 1.2% for AGIs $25k-50k, 1.5% for AGIs $50k-75k, 1.7% for AGIs $75k-100k, 1.9% for AGIs $100k-200k, 2.2% for AGIs over 200k)
Taxes paid: $53,010 (reported on 56.6% of returns)
07901:
$53,010
State:
$15,801
(% of AGI for various income ranges: 9.8% for AGIs below $25k, 6.6% for AGIs $25k-50k, 7.6% for AGIs $50k-75k, 8.7% for AGIs $75k-100k, 11.2% for AGIs $100k-200k, 11.1% for AGIs over 200k)
Earned income credit: $1,883 (reported on 5.6% of returns)
Here:
$1,883
State:
$2,182
(% of AGI for various income ranges: 2.9% for AGIs below $25k, 0.6% for AGIs $25k-50k)
Percentage of individuals using paid preparers for their 2012 taxes: 68.7%
Here:
69%
State:
65%
(% for various income ranges: 64.3% for AGIs below $25k, 64.2% for AGIs $25k-50k, 67.9% for AGIs $50k-75k, 68.0% for AGIs $75k-100k, 65.7% for AGIs $100k-200k, 77.4% for AGIs over 200k)
Averages for the 2004 tax year for zip code 07901, filed in 2005:
Average Adjusted Gross Income (AGI) in 2004: $224,157 (Individual Income Tax Returns)
Here:
$224,157
State:
$64,921
Salary/wage: $199,871 (reported on 76.6% of returns)
Here:
$199,871
State:
$57,755
(% of AGI for various income ranges: 159.1% for AGIs below $10k, 61.1% for AGIs $10k-25k, 72.5% for AGIs $25k-50k, 68.8% for AGIs $50k-75k, 68.9% for AGIs $75k-100k, 68.1% for AGIs over 100k)
Taxable interest for individuals: $5,293 (reported on 69.6% of returns)
This zip code:
$5,293
New Jersey:
$2,068
(% of AGI for various income ranges: 58.1% for AGIs below $10k, 4.5% for AGIs $10k-25k, 2.6% for AGIs $25k-50k, 3.1% for AGIs $50k-75k, 2.5% for AGIs $75k-100k, 1.4% for AGIs over 100k)
Taxable dividends: $12,563 (reported on 59.8% of returns)
Here:
$12,563
State:
$3,959
(% of AGI for various income ranges: 62.2% for AGIs below $10k, 5.5% for AGIs $10k-25k, 3.5% for AGIs $25k-50k, 4.4% for AGIs $50k-75k, 4.5% for AGIs $75k-100k, 3.2% for AGIs over 100k)
Net capital gain/loss: +$42,988 (reported on 52.7% of returns)
Here:
+$42,988
State:
+$13,591
(% of AGI for various income ranges: -18.1% for AGIs below $10k, 2.9% for AGIs $10k-25k, 1.4% for AGIs $25k-50k, 1.2% for AGIs $50k-75k, 1.8% for AGIs $75k-100k, 11.0% for AGIs over 100k)
Profit/loss from business: +$38,789 (reported on 16.5% of returns)
Here:
+$38,789
State:
+$17,520
(% of AGI for various income ranges: 8.6% for AGIs below $10k, 10.0% for AGIs $10k-25k, 5.0% for AGIs $25k-50k, 4.2% for AGIs $50k-75k, 4.7% for AGIs $75k-100k, 2.6% for AGIs over 100k)
IRA payment deduction: $3,541 (reported on 3.1% of returns)
07901:
$3,541
New Jersey:
$3,270
(% of AGI for various income ranges: 0.9% for AGIs below $10k, 0.4% for AGIs $10k-25k, 0.3% for AGIs $25k-50k, 0.2% for AGIs $50k-75k, 0.2% for AGIs $75k-100k, 0.0% for AGIs over 100k)
Self-employed pension: $26,688 (reported on 4.3% of returns)
Here:
$26,688
New Jersey:
$17,258
(% of AGI for various income ranges: 0.1% for AGIs $25k-50k, 0.4% for AGIs $50k-75k, 0.3% for AGIs $75k-100k, 0.5% for AGIs over 100k)
Total itemized deductions: $57,555 (15% of AGI, reported on 55.9% of returns)
Here:
$57,555
State:
$23,924
Here:
15.2% of AGI
State:
21.1% of AGI
(% of AGI for various income ranges: 49.1% for AGIs below $10k, 22.8% for AGIs $10k-25k, 17.3% for AGIs $25k-50k, 19.5% for AGIs $50k-75k, 21.6% for AGIs $75k-100k, 13.7% for AGIs over 100k)
Charity contributions deductions: $9,773 (2% of AGI, reported on 52.1% of returns)
Here:
$9,773
State:
$3,242
Here:
2.4% of AGI
State:
2.7% of AGI
(% of AGI for various income ranges: 2.2% for AGIs below $10k, 1.5% for AGIs $10k-25k, 1.8% for AGIs $25k-50k, 2.0% for AGIs $50k-75k, 2.5% for AGIs $75k-100k, 2.3% for AGIs over 100k)
Total tax: $63,389 (reported on 82.9% of returns)
07901:
$63,389
State:
$12,321
(% of AGI for various income ranges: 7.8% for AGIs below $10k, 5.3% for AGIs $10k-25k, 8.1% for AGIs $25k-50k, 10.8% for AGIs $50k-75k, 12.1% for AGIs $75k-100k, 24.8% for AGIs over 100k)
Earned income credit: $1,449 (reported on 3.5% of returns)
Here:
$1,449
State:
$1,711
Percentage of individuals using paid preparers for their 2004 taxes: 68.0%
Here:
68%
State:
65%
(% for various income ranges: 65.5% for AGIs below $10k, 64.7% for AGIs $10k-25k, 62.3% for AGIs $25k-50k, 63.6% for AGIs $50k-75k, 65.1% for AGIs $75k-100k, 74.4% for AGIs over 100k)
Household received Food Stamps/SNAP in the past 12 months: 167 Household did not receive Food Stamps/SNAP in the past 12 months: 8,673
Women who had a birth in the past 12 months: 232 (203 now married, 30 unmarried) Women who did not have a birth in the past 12 months: 5,513 (2,719 now married, 2,785 unmarried)
Housing units in zip code 07901 with a mortgage: 4,222 (491 second mortgage, 34 home equity loan, 464 both second mortgage and home equity loan) Houses without a mortgage: 188
Median monthly owner costs for units with a mortgage: $3,744 Median monthly owner costs for units without a mortgage: $1,425
Residents with income below the poverty level in 2022:
This zip code:
4.7%
Whole state:
9.7%
Residents with income below 50% of the poverty level in 2022:
This zip code:
1.5%
Whole state:
5.2%
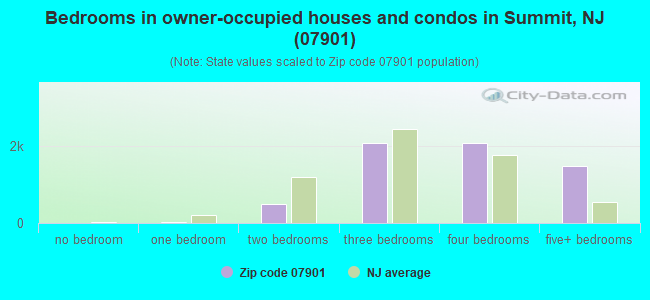
Median number of rooms in houses and condos:
Here:
10.0
State:
6.8
Median number of rooms in apartments:
Here:
4.1
State:
3.9
Notable locations in this zip code not listed on our city pages
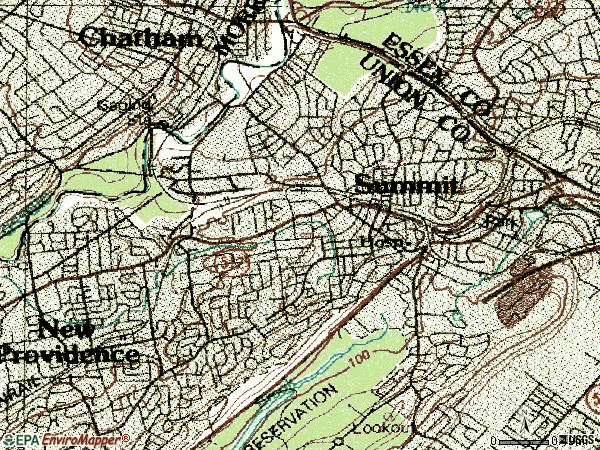
Notable locations in zip code 07901: Summit Station (A), Huntley Station (B), Summit Sub-Station (C), Free Public Library of Summit (D), Basset Building (E), Central Building (F), City of Summit Municipal Building (G), Summit Volunteer First Aid Squad (H), Schering - Plough Emergency Fire / Rescue Brigade (I), Summit Fire Department (J), Summit Playhouse (K). Display/hide their locations on the map
Churches in zip code 07901 include: Pilgrim Baptist Church (A), Temple Sinai (B), Calvary Episcopal Church (C), Oaks Memorial Church (D), First Church of Christ Scientist (E), Jewish Community Center (F), Fountain Baptist Church (G), Wallace Chapel African Methodist Episcopal Zion Church (H), Mount Olive Temple (I). Display/hide their locations on the map
Parks in zip code 07901 include: Soldiers Memorial Field (1), Metro Homes Field (2), Tatlock Sports Complex (3), Edison Recreation Center (4), Watchung Reservation (5). Display/hide their locations on the map
In group quarters: 187 (-1 institutionalized population)
Size of family households: 2,417 2-persons, 1,551 3-persons, 1,698 4-persons, 823 5-persons, 119 6-persons
Size of nonfamily households: 1,794 1-person, 504 2-persons
5,129 married couples with children.
757 single-parent households (127 men, 630 women).
72.4% of residents of 07901 zip code speak English at home.
10.4% of residents speak Spanish at home (52% very well, 23% well, 15% not well, 10% not at all).
9.4% of residents speak other Indo-European language at home (84% very well, 8% well, 5% not well, 3% not at all).
6.1% of residents speak Asian or Pacific Island language at home (74% very well, 20% well, 5% not well).
1.4% of residents speak other language at home (73% very well, 27% well).
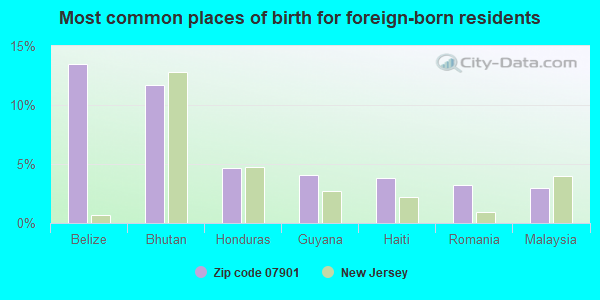
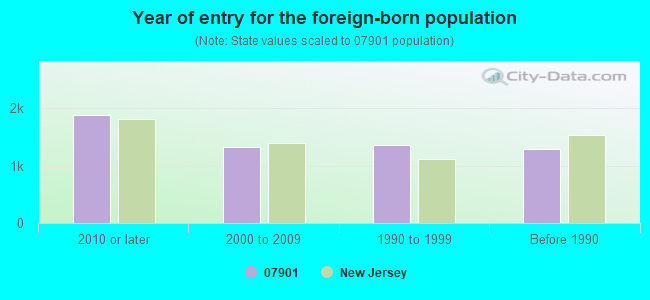
Foreign born population: 5,563 (22.9%) (52.3% of them are naturalized citizens)
Major facilities with environmental interests located in this zip code:
NOVARTIS PHARMACEUTICALS CORPORATION (556 MORRIS AVENUE in SUMMIT, NJ)
AIR MINOR (AIRS/AFS) ENFORCEMENT/COMPLIANCE ACTIVITY (Integrated Compliance Information System) - ICIS-02-1994-0100, FORMAL ENFORCEMENT ACTION, ICIS-02-2001-1008, (Integrated Compliance Information System) - ICIS-02-1994-0100, FORMAL ENFORCEMENT ACTION, ICIS-02-2001-1008, ENFORCEMENT/COMPLIANCE ACTIVITY (Integrated Compliance Information System) CRITERIA AND HAZARDOUS AIR POLLUTANT INVENTORY (Inventory of air pollution sources) AIR MAJOR ("Best Available" air pollution technologies tracking) HAZARDOUS WASTE BIENNIAL REPORTER (Resource Conservation and Recovery Act (tracking hazardous waste)) Large Quantity Generators, more that 1000 kg of hazardous waste/month (Resource Conservation and Recovery Act (tracking hazardous waste)) TSD (Resource Conservation and Recovery Act (tracking hazardous waste)) (Resource Conservation and Recovery Act (tracking hazardous waste)) TRI REPORTER (Tracking of toxic chemicals releasing facilities) Business SIC classification: MEDICINAL CHEMICALS AND BOTANICAL PRODUCTS; PHARMACEUTICAL PREPARATIONS Business NAICS classification: PHARMACEUTICAL PREPARATION MANUFACTURING. Alternative names: CIBA-GEIGY CORP., CIBA-GEIGY CORP., NOVARTIS PHARMACEUTICALS DIV, UNION COUNTY OF
HOSOKAWA MICRON POWDER SYSTEMS (10 CHATHAM ROAD in SUMMIT, NJ)
AIR MINOR (AIRS/AFS) STATE MASTER (New Jersey environmental info) - NJEMS-40984, AIR PROGRAM, NJEMS-47696, National Pollutant Discharge Elimination System Permit, NJEMS-67254700000, EPCRA National Pollutant Discharge Elimination System NON-MAJOR (Tracking pollutant discharge elimination systems) - permit (Resource Conservation and Recovery Act (tracking hazardous waste)) Business SIC classification: CONSTRUCTION MACHINERY AND EQUIPMENT; SPECIAL INDUSTRY MACHINERY; GENERAL INDUSTRIAL MACHINERY AND EQUIPMENT Organizations: HOSOKOWA MICRON POWDER SYTEMS, HOSKOWA MICRON POWDER SYSTEMS (CONTACT/OWNER)
Alternative names: HOSOKAWA MICRON POWDER SYTEMS, HOSOKOWA MICRON POWDER SYTEMS
GETTY SERVICE STATION #57359 (36 RIVER ROAD in SUMMIT, NJ)
STATE MASTER (New Jersey environmental info) - NJEMS-007941, STATE CLEANUP SITE, NJEMS-47115, National Pollutant Discharge Elimination System Permit, NJEMS-48262900001, EPCRA, NJEMS-92658100000, NJEMS-A4328, AIR PROGRAM (Resource Conservation and Recovery Act (tracking hazardous waste)) Business SIC classification: GASOLINE SERVICE STATIONS Organizations: EXXON MOBIL CORP, EXXON MOBIL FUELS MARKETING CO (CONTACT/OWNER)
, GETTY PETROLEUM MARKETING INC (CONTACT/OWNER)
Alternative names: EXXON SERVICE STATION-36259, EXXON SERVICE STATION #36259, TERRACE EXXON
EXXON SERVICE STATION #33411 FORMER (31 EUCLID AVE in SUMMIT, NJ)
STATE MASTER (New Jersey environmental info) - NJEMS-000142, STATE CLEANUP SITE, NJEMS-257629, National Pollutant Discharge Elimination System Permit, NJEMS-42197, AIR PROGRAM, NJEMS-56666300000, EPCRA National Pollutant Discharge Elimination System NON-MAJOR (Tracking pollutant discharge elimination systems) - permit Business SIC classification: GASOLINE SERVICE STATIONS; GENERAL AUTOMOTIVE REPAIR SHOPS Organizations: GEOLOGIC SERVICES CORP, EXXON MOBIL RESEARCH & ENGINEERING CO, EXXONMOBIL RESEARCH & ENG CO (CONTACT/OPERATOR)
, FLYNN RAYMOND (CONTACT/OWNER)
Alternative names: EXXONMOBIL RESEARCH & ENG CO, FORMER EXXON FACILITY 33411, RAYMOND F FLYNNS GARAGE
NJ TRANSIT AUTH RAIL OPER SUMMIT (40 UNION PLACE in SUMMIT, NJ)
STATE MASTER (New Jersey environmental info) - NJEMS-41983, AIR PROGRAM, NJEMS-NJ0000061846, HAZARDOUS WASTE PROGRAM HAZARDOUS WASTE BIENNIAL REPORTER (Resource Conservation and Recovery Act (tracking hazardous waste)) Large Quantity Generators, more that 1000 kg of hazardous waste/month (Resource Conservation and Recovery Act (tracking hazardous waste)) Business NAICS classification: COMMUTER RAIL SYSTEMS. Organizations: NJ TRANSIT CORP (CONTACT/OPERATOR)
Alternative names: NJ TRANSIT MORRIS & ESSEX, NJ TRANSIT MORRIS & ESSEX LINE
NOVARTIS CONSUMER HEALTHJ, INC. (560 MORRIS AVE in SUMMIT, NJ)
ENFORCEMENT/COMPLIANCE ACTIVITY (Integrated Compliance Information System) - ICIS-HQ-2001-3031, FORMAL ENFORCEMENT ACTION (Integrated Compliance Information System) - ICIS-HQ-2001-3031, FORMAL ENFORCEMENT ACTION
371 SPRINGFIELD AVENUE (371 SPRINGFIELD AVE in SUMMIT, NJ)
(Integrated Compliance Information System) - ICIS-02-1988-0841, FORMAL ENFORCEMENT ACTION STATE MASTER (New Jersey environmental info) - NJEMS-G000023921, STATE CLEANUP SITE Alternative names: TOP-TEX INC
AIRCAST INC (19 CHATHAM RD in SUMMIT, NJ)
AIR MINOR (AIRS/AFS) STATE MASTER (New Jersey environmental info) - NJEMS-41999600002, EPCRA, NJEMS-G000002123, STATE CLEANUP SITE (Resource Conservation and Recovery Act (tracking hazardous waste)) Business SIC classification: ORTHOPEDIC, PROSTHETIC, AND SURGICAL APPLIANCES AND SUPPLIES Alternative names: HOLMAN LABEL CO
OVERLOOK HOSPITAL (99 BEAUVOIR AVENUE in SUMMIT, NJ)
STATE MASTER (New Jersey environmental info) - NJEMS-020136, STATE CLEANUP SITE, NJEMS-132729, REFUSE DISPOSAL, NJEMS-246044, NJEMS-40668, AIR PROGRAM, NJEMS-NJD030239297, HAZARDOUS WASTE PROGRAM Small Quantity Generators, between 100 kg and 1000 kg of hazardous waste/month (Resource Conservation and Recovery Act (tracking hazardous waste)) Business SIC classification: AUTOMATIC CONTROLS FOR REGULATING RESIDENTIAL AND COMMERCIAL ENVIRONMENTS AND APPLIANCES Organizations: MCDONOUGH KEITH, AHS HOSPITAL CORP (CONTACT/OPERATOR)
1ST UNION NATIONAL BANK VACANT BUILDING (27 SUMMIT AVE in SUMMIT, NJ)
STATE MASTER (New Jersey environmental info) - NJEMS-033705, STATE CLEANUP SITE, NJEMS-NJR000030619, HAZARDOUS WASTE PROGRAM Large Quantity Generators, more that 1000 kg of hazardous waste/month (Resource Conservation and Recovery Act (tracking hazardous waste)) - notification Organizations: FIRST UNION NATIONAL BANK Alternative names: FIRST UNION NATIONAL BANK
BAKER ROBERT C M (65 LENOX RD in SUMMIT, NJ)
STATE MASTER (New Jersey environmental info) - NJEMS-G000044379, STATE CLEANUP SITE, NJEMS-NJR000031930, HAZARDOUS WASTE PROGRAM Large Quantity Generators, more that 1000 kg of hazardous waste/month (Resource Conservation and Recovery Act (tracking hazardous waste)) - notification Organizations: ROBERT C M BAKER (CONTACT/OWNER)
BARNES CHEVROLET INC (36 RIVER ROAD #42 in SUMMIT, NJ)
STATE MASTER (New Jersey environmental info) - NJEMS-000043, STATE CLEANUP SITE, NJEMS-18325500000, EPCRA, NJEMS-NJD079328605, HAZARDOUS WASTE PROGRAM (Resource Conservation and Recovery Act (tracking hazardous waste)) Business SIC classification: MOTOR VEHICLE DEALERS (NEW AND USED) Organizations: RIVER ROAD AUTO Alternative names: BARNES CHEVROLET INCOPORATED
Housing units lacking complete plumbing facilities: 0.1% Housing units lacking complete kitchen facilities: 0.6%
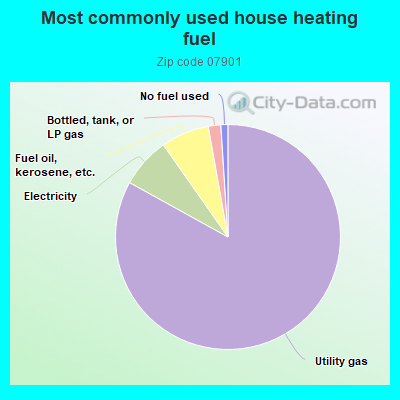
82.8%Utility gas
7.2%Electricity
6.9%Fuel oil, kerosene, etc.
1.8%Bottled, tank, or LP gas
1.0%No fuel used
Population in 1990: 20,151. Population change in the 1990s: +2,483 (+12.3%).
Place of birth for U.S.-born residents:
This state: 9,368
Northeast: 5,757
Midwest: 1,283
South: 1,003
West: 1,148
63% of the 07901 zip code residents lived in the same house 5 years ago. Out of people who lived in different houses, 40% lived in this county. Out of people who lived in different counties, 50% lived in New Jersey.
91% of the 07901 zip code residents lived in the same house 1 year ago. Out of people who lived in different houses, 30% moved from this county. Out of people who lived in different houses, 18% moved from different county within same state. Out of people who lived in different houses, 44% moved from different state. Out of people who lived in different houses, 14% moved from abroad.
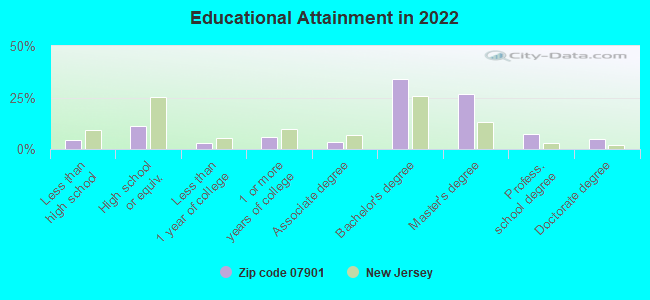
Private vs. public school enrollment:
Students in private schools in grades 1 to 8 (elementary and middle school): 351
Here:
12.6%
New Jersey:
12.3%
Students in private schools in grades 9 to 12 (high school): 438
Here:
23.8%
New Jersey:
13.1%
Students in private undergraduate colleges: 316
Here:
35.7%
New Jersey:
33.2%
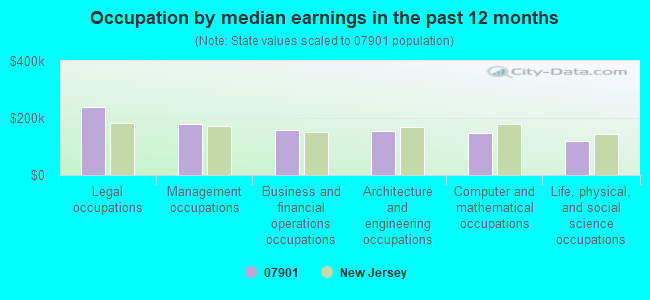
Occupation by median earnings in the past 12 months ($)
237,991Legal occupations
180,316Management occupations
158,208Business and financial operations occupations
154,723Architecture and engineering occupations
148,083Computer and mathematical occupations
120,657Life, physical, and social science occupations
Companies with federal contracts located in this zip code (SUMMIT, NJ):
SECURE PRODUCTS L.P. (436 SPRINGFIELD AVENUE; small business) : $1,136,000 in 2 contractsfrom 1999 to 2000
$568,000 with Army for Chemicals. Signed on 2000-03-22. Completion date: 2000-04-21.
$568,000, same as above.Signed on 1999-12-15. Completion date: 2000-01-18.
SUMMIT APPLIED RESEARCH INC (164 CANOE BROOK PKWY; small business) : $471,218 in 5 contractsfrom 2001 to 2005
Contracts for Other Defense -- Applied Research and Exploratory Development (R&D), Other Defense -- Advanced Development (R&D) by Navy Signed by year:2000: $0; 2001: $99,696; 2002: $0; 2003: $196,689; 2004: $125,025; 2005: $49,808; 2006: $0.
Biggest contracts:
$196,689 with Navy for Other Defense -- Applied Research and Exploratory Development (R&D). Signed on 2003-03-04. Completion date: 2004-03-21.
$99,696, same as above.Signed on 2001-03-22. Completion date: 2001-09-30.
$75,025, same as above.Signed on 2004-01-14. Completion date: 2004-03-21.
$50,000 with Navy for Other Defense -- Advanced Development (R&D). Signed on 2004-06-14. Completion date: 2004-12-31.
HOSOKAWA MICRON INTERNATIONAL (10 CHATHAM RD) : $155,225 in 3 contractsfrom 2003 to 2004
$144,450 with Navy for Chemical and Pharmaceutical Products Manufacturing Machinery. Signed on 2003-09-30. Completion date: 2004-06-30.
$11,025, same as above.Signed on 2004-05-25. Completion date: 2004-05-27.
-$250, same as above.Signed on 2004-01-21. Completion date: 2004-03-21.
HI-TEC FINANCIAL SERVICES, INC (35 BEECHWOOD ROAD, SUITE 2) : $130,444 in 4 contractsfrom 1999 to 2002
$47,638 with Air Force for Lease or Rental of Equipment -- Medical, Dental, and Veterinary Equipment and Supplies. Taking place in FL. Signed on 2002-01-08. Completion date: 2002-09-30.
$29,300, same as above.Signed on 1999-11-23. Completion date: 2000-09-30.
$27,396, same as above.Signed on 2000-10-17. Completion date: 2001-09-30.
$26,110, same as above.Signed on 2002-10-01. Completion date: 2003-03-15.
CELANESE AMERICAS CORPORATION (90 MORRIS AVE; small business)
$50,305 with Defense Logistics Agency for Switches. Signed on 2001-10-17. Completion date: 2002-06-04.
bridget bly (21 LOCUST DRIVE; small business)
$28,800 with Offices, Boards and Divisions (includes Attorney General, Deputy Attorney General, etc.) for Expert Witness. Signed on 2005-02-22. Completion date: 2005-12-31.
LEAR SIEGLER DIVERSIFIED HOLDI (469 MORRIS AVE) : -$161,746 in 12 contractsfrom 1999 to 2005
Contracts for Electrical and Electronic assemblies, Boards, Cards, and Associated Hardware, Maintenance, Repair and Rebuilding of Equipment -- Aircraft Components and Accessories, Combination and Miscellaneous Instruments by Air Force Signed by year:2000: $108,890; 2001: $0; 2002: $0; 2003: $0; 2004: -$217,456; 2005: -$205,062; 2006: $0.
Biggest contracts:
$151,882 with Air Force for Electrical and Electronic assemblies, Boards, Cards, and Associated Hardware. Taking place in CA. Signed on 1999-11-09. Completion date: 2003-05-31.
$108,890, same as above.Signed on 2000-01-27. Completion date: 2003-05-31.
-$10,518, same as above.Signed on 2005-03-08. Completion date: 2003-05-31.
-$14,484 with Air Force for Maintenance, Repair and Rebuilding of Equipment -- Aircraft Components and Accessories. Taking place in CA. Signed on 2005-02-08. Completion date: 2005-06-30.
Top industries in this zip code by the number of employees in 2005:
Health Care and Social Assistance: Offices of Physicians (except Mental Health Specialists) (250-499: 1, 50-99: 2, 20-49: 4, 10-19: 4, 5-9: 23, 1-4: 16)
Finance and Insurance: Investment Banking and Securities Dealing (250-499: 1, 100-249: 1, 20-49: 2, 10-19: 1, 5-9: 1, 1-4: 3)
Arts, Entertainment, and Recreation: Fitness and Recreational Sports Centers (250-499: 1, 50-99: 1, 1-4: 2)
Other Services (except Public Administration): Religious Organizations (50-99: 4, 10-19: 4, 5-9: 2, 1-4: 2)
Finance and Insurance: Sales Financing (250-499: 1, 1-4: 1)
Educational Services: Elementary and Secondary Schools (100-249: 2, 20-49: 1)
Professional, Scientific, and Technical Services: Research and Development in the Physical, Engineering, and Life Sciences (100-249: 1, 20-49: 2, 10-19: 1, 1-4: 3)
Administrative and Support and Waste Management and Remediation Services: Temporary Help Services (100-249: 1, 50-99: 1, 5-9: 1, 1-4: 2)
People in group quarters in 2010:
75 people in mental (psychiatric) hospitals and psychiatric units in other hospitals
46 people in other noninstitutional facilities
People in group quarters in 2000:
9 people in religious group quarters
6 people in other group homes
2 people in other noninstitutional group quarters
Fatal accident statistics in 2014:
Fatal accident count: 1
Vehicles involved in fatal accidents: 2
Fatal accidents caused by drunken drivers: 1
Fatalities: 2
Persons involved in fatal accidents: 3
Pedestrians involved in fatal accidents: 0
Fatal accident statistics in 2013:
Fatal accident count: 1
Vehicles involved in fatal accidents: 1
Fatal accidents caused by drunken drivers: 0
Fatalities: 1
Persons involved in fatal accidents: 1
Pedestrians involved in fatal accidents: 0
Home Mortgage Disclosure Act Aggregated Statistics For Year 2009 (Based on 6 full and 8 partial tracts)
A) FHA, FSA/RHS & VA Home Purchase Loans
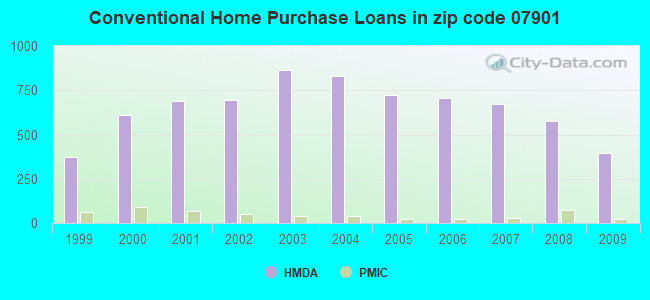
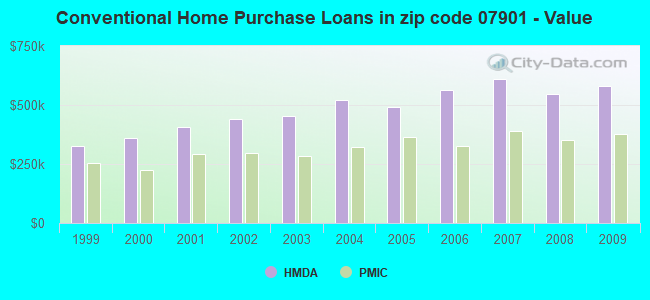
B) Conventional Home Purchase Loans
C) Refinancings
D) Home Improvement Loans
F) Non-occupant Loans on < 5 Family Dwellings (A B C & D)
Number
Average Value
Number
Average Value
Number
Average Value
Number
Average Value
Number
Average Value
LOANS ORIGINATED
59
$452,640
394
$578,932
1,495
$456,915
42
$257,857
31
$252,675
APPLICATIONS APPROVED, NOT ACCEPTED
5
$378,424
43
$603,796
127
$407,504
2
$703,525
8
$376,321
APPLICATIONS DENIED
4
$356,738
51
$587,082
307
$495,755
26
$186,435
7
$511,371
APPLICATIONS WITHDRAWN
6
$534,212
61
$566,378
220
$430,476
8
$165,175
19
$323,189
FILES CLOSED FOR INCOMPLETENESS
2
$429,625
3
$341,277
70
$454,545
0
$0
2
$367,545
Aggregated Statistics For Year 2008 (Based on 6 full and 8 partial tracts)
A) FHA, FSA/RHS & VA Home Purchase Loans
B) Conventional Home Purchase Loans
C) Refinancings
D) Home Improvement Loans
E) Loans on Dwellings For 5+ Families
F) Non-occupant Loans on < 5 Family Dwellings (A B C & D)
Number
Average Value
Number
Average Value
Number
Average Value
Number
Average Value
Number
Average Value
Number
Average Value
LOANS ORIGINATED
16
$451,931
574
$545,183
547
$439,830
49
$229,475
4
$420,850
72
$299,767
APPLICATIONS APPROVED, NOT ACCEPTED
0
$0
102
$437,392
110
$400,328
24
$119,862
0
$0
12
$282,484
APPLICATIONS DENIED
5
$412,542
75
$781,508
180
$441,479
29
$172,548
0
$0
20
$290,423
APPLICATIONS WITHDRAWN
0
$0
96
$559,860
110
$582,809
7
$402,417
0
$0
18
$367,592
FILES CLOSED FOR INCOMPLETENESS
2
$332,555
21
$571,640
32
$444,150
3
$32,187
0
$0
2
$1,097,775
Aggregated Statistics For Year 2007 (Based on 6 full and 8 partial tracts)
A) FHA, FSA/RHS & VA Home Purchase Loans
B) Conventional Home Purchase Loans
C) Refinancings
D) Home Improvement Loans
E) Loans on Dwellings For 5+ Families
F) Non-occupant Loans on < 5 Family Dwellings (A B C & D)
Number
Average Value
Number
Average Value
Number
Average Value
Number
Average Value
Number
Average Value
Number
Average Value
LOANS ORIGINATED
2
$372,090
673
$611,972
546
$462,021
103
$165,649
14
$3,944,504
56
$394,666
APPLICATIONS APPROVED, NOT ACCEPTED
0
$0
81
$493,100
107
$367,776
24
$137,388
4
$12,475,430
17
$308,234
APPLICATIONS DENIED
0
$0
76
$543,717
237
$399,074
41
$214,558
2
$2,100,000
46
$331,500
APPLICATIONS WITHDRAWN
0
$0
67
$518,638
106
$401,440
14
$235,018
0
$0
16
$363,226
FILES CLOSED FOR INCOMPLETENESS
0
$0
12
$896,812
38
$518,659
0
$0
0
$0
0
$0
Aggregated Statistics For Year 2006 (Based on 6 full and 8 partial tracts)
A) FHA, FSA/RHS & VA Home Purchase Loans
B) Conventional Home Purchase Loans
C) Refinancings
D) Home Improvement Loans
E) Loans on Dwellings For 5+ Families
F) Non-occupant Loans on < 5 Family Dwellings (A B C & D)
Number
Average Value
Number
Average Value
Number
Average Value
Number
Average Value
Number
Average Value
Number
Average Value
LOANS ORIGINATED
1
$202,410
708
$561,660
687
$399,417
120
$181,568
6
$2,900,000
75
$494,954
APPLICATIONS APPROVED, NOT ACCEPTED
0
$0
55
$551,587
120
$319,663
26
$194,532
0
$0
6
$288,867
APPLICATIONS DENIED
0
$0
72
$470,335
222
$339,275
38
$242,483
2
$999,000
21
$372,510
APPLICATIONS WITHDRAWN
0
$0
107
$469,308
160
$341,937
20
$180,254
0
$0
19
$368,640
FILES CLOSED FOR INCOMPLETENESS
0
$0
21
$439,711
52
$363,525
4
$320,380
0
$0
4
$308,510
Aggregated Statistics For Year 2005 (Based on 6 full and 8 partial tracts)
B) Conventional Home Purchase Loans
C) Refinancings
D) Home Improvement Loans
E) Loans on Dwellings For 5+ Families
F) Non-occupant Loans on < 5 Family Dwellings (A B C & D)
G) Loans On Manufactured Home Dwelling (A B C & D)
Number
Average Value
Number
Average Value
Number
Average Value
Number
Average Value
Number
Average Value
Number
Average Value
LOANS ORIGINATED
724
$491,134
806
$388,826
132
$186,868
4
$1,599,640
94
$355,189
0
$0
APPLICATIONS APPROVED, NOT ACCEPTED
79
$480,652
131
$309,426
20
$109,709
0
$0
12
$232,083
0
$0
APPLICATIONS DENIED
94
$386,444
200
$358,808
65
$124,579
0
$0
25
$250,677
0
$0
APPLICATIONS WITHDRAWN
95
$445,875
249
$370,853
19
$299,342
4
$473,568
21
$299,070
0
$0
FILES CLOSED FOR INCOMPLETENESS
22
$514,791
46
$356,238
4
$294,922
0
$0
8
$401,021
2
$513,500
Aggregated Statistics For Year 2004 (Based on 6 full and 8 partial tracts)
A) FHA, FSA/RHS & VA Home Purchase Loans
B) Conventional Home Purchase Loans
C) Refinancings
D) Home Improvement Loans
E) Loans on Dwellings For 5+ Families
F) Non-occupant Loans on < 5 Family Dwellings (A B C & D)
Number
Average Value
Number
Average Value
Number
Average Value
Number
Average Value
Number
Average Value
Number
Average Value
LOANS ORIGINATED
0
$0
831
$520,840
922
$346,038
127
$152,016
6
$1,002,933
106
$281,326
APPLICATIONS APPROVED, NOT ACCEPTED
0
$0
94
$507,625
120
$328,416
30
$200,116
2
$960,000
7
$395,370
APPLICATIONS DENIED
0
$0
91
$398,167
175
$308,181
62
$130,233
0
$0
26
$233,957
APPLICATIONS WITHDRAWN
1
$150,880
113
$544,366
163
$335,932
20
$188,925
2
$92,250
10
$498,050
FILES CLOSED FOR INCOMPLETENESS
0
$0
17
$479,039
26
$336,882
2
$76,865
0
$0
2
$156,825
Aggregated Statistics For Year 2003 (Based on 6 full and 8 partial tracts)
A) FHA, FSA/RHS & VA Home Purchase Loans
B) Conventional Home Purchase Loans
C) Refinancings
D) Home Improvement Loans
E) Loans on Dwellings For 5+ Families
F) Non-occupant Loans on < 5 Family Dwellings (A B C & D)
Number
Average Value
Number
Average Value
Number
Average Value
Number
Average Value
Number
Average Value
Number
Average Value
LOANS ORIGINATED
6
$146,557
866
$455,136
3,125
$341,489
65
$92,739
6
$2,519,657
138
$253,878
APPLICATIONS APPROVED, NOT ACCEPTED
0
$0
108
$498,688
345
$297,702
34
$75,411
0
$0
10
$418,239
APPLICATIONS DENIED
0
$0
58
$383,433
279
$337,020
39
$107,507
0
$0
18
$258,804
APPLICATIONS WITHDRAWN
0
$0
100
$520,826
316
$306,025
7
$24,674
0
$0
12
$233,145
FILES CLOSED FOR INCOMPLETENESS
2
$340,720
18
$341,733
63
$395,629
9
$99,451
0
$0
6
$362,998
Aggregated Statistics For Year 2002 (Based on 6 full and 6 partial tracts)
A) FHA, FSA/RHS & VA Home Purchase Loans
B) Conventional Home Purchase Loans
C) Refinancings
D) Home Improvement Loans
E) Loans on Dwellings For 5+ Families
F) Non-occupant Loans on < 5 Family Dwellings (A B C & D)
Number
Average Value
Number
Average Value
Number
Average Value
Number
Average Value
Number
Average Value
Number
Average Value
LOANS ORIGINATED
6
$223,398
695
$442,424
2,326
$347,231
179
$108,336
12
$813,860
119
$303,718
APPLICATIONS APPROVED, NOT ACCEPTED
0
$0
89
$431,832
280
$272,296
53
$67,705
0
$0
7
$158,539
APPLICATIONS DENIED
0
$0
30
$619,230
269
$262,322
77
$88,530
0
$0
22
$220,765
APPLICATIONS WITHDRAWN
0
$0
69
$394,093
211
$325,372
19
$67,521
2
$800,000
11
$235,786
FILES CLOSED FOR INCOMPLETENESS
2
$164,930
9
$380,523
68
$306,582
8
$116,288
0
$0
2
$122,300
Aggregated Statistics For Year 2001 (Based on 6 full and 6 partial tracts)
A) FHA, FSA/RHS & VA Home Purchase Loans
B) Conventional Home Purchase Loans
C) Refinancings
D) Home Improvement Loans
E) Loans on Dwellings For 5+ Families
F) Non-occupant Loans on < 5 Family Dwellings (A B C & D)
Number
Average Value
Number
Average Value
Number
Average Value
Number
Average Value
Number
Average Value
Number
Average Value
LOANS ORIGINATED
10
$206,579
690
$406,800
1,177
$313,837
87
$81,350
8
$1,544,338
81
$212,211
APPLICATIONS APPROVED, NOT ACCEPTED
0
$0
66
$456,238
155
$219,716
26
$117,363
0
$0
13
$208,963
APPLICATIONS DENIED
2
$128,130
36
$343,028
208
$244,434
42
$49,496
2
$831,385
18
$195,169
APPLICATIONS WITHDRAWN
0
$0
85
$324,254
140
$265,352
32
$41,464
0
$0
16
$314,177
FILES CLOSED FOR INCOMPLETENESS
0
$0
8
$527,362
53
$239,017
2
$266,650
0
$0
0
$0
Aggregated Statistics For Year 2000 (Based on 6 full and 6 partial tracts)
A) FHA, FSA/RHS & VA Home Purchase Loans
B) Conventional Home Purchase Loans
C) Refinancings
D) Home Improvement Loans
E) Loans on Dwellings For 5+ Families
F) Non-occupant Loans on < 5 Family Dwellings (A B C & D)
Number
Average Value
Number
Average Value
Number
Average Value
Number
Average Value
Number
Average Value
Number
Average Value
LOANS ORIGINATED
4
$228,302
608
$359,228
225
$272,363
66
$68,778
6
$1,014,848
29
$283,711
APPLICATIONS APPROVED, NOT ACCEPTED
0
$0
54
$339,244
59
$163,272
56
$77,491
0
$0
4
$234,235
APPLICATIONS DENIED
2
$192,050
32
$339,791
97
$210,754
21
$25,113
0
$0
10
$142,695
APPLICATIONS WITHDRAWN
2
$216,055
56
$422,308
86
$234,548
24
$55,892
2
$575,000
0
$0
FILES CLOSED FOR INCOMPLETENESS
0
$0
12
$362,249
44
$243,625
7
$56,880
2
$1,725,000
0
$0
Aggregated Statistics For Year 1999 (Based on 3 full and 2 partial tracts)
A) FHA, FSA/RHS & VA Home Purchase Loans
B) Conventional Home Purchase Loans
C) Refinancings
D) Home Improvement Loans
E) Loans on Dwellings For 5+ Families
F) Non-occupant Loans on < 5 Family Dwellings (A B C & D)
2003 - 2018 National Fire Incident Reporting System (NFIRS) incidents
Based on the data from the years 2003 - 2018 the average number of fires per year is 102. The highest number of fires - 147 took place in 2008, and the least - 1 in 2006. The data has a rising trend.
When looking into fire subcategories, the most incidents belonged to: Structure Fires (64.0%), and Outside Fires (20.4%).
Fire incident types reported to NFIRS in Zip Code 07901


 Nearest zip codes: 07092, 07081, 07974, 07078, 07928, 07041.


 Based on the data from the years 2003 - 2018 the average number of fires per year is 102. The highest number of fires - 147 took place in 2008, and the least - 1 in 2006. The data has a rising trend.
 When looking into fire subcategories, the most incidents belonged to: Structure Fires (64.0%), and Outside Fires (20.4%).