Estimated zip code population in 2022: 3,521 Zip code population in 2010: 2,672 Zip code population in 2000: 713
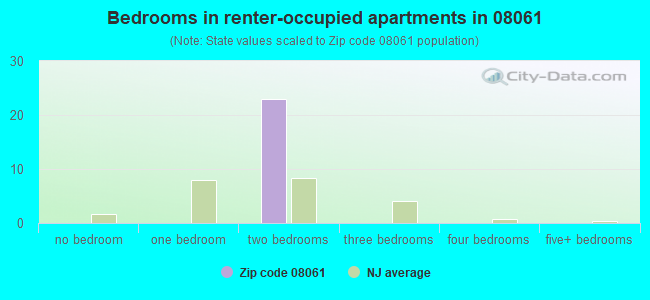
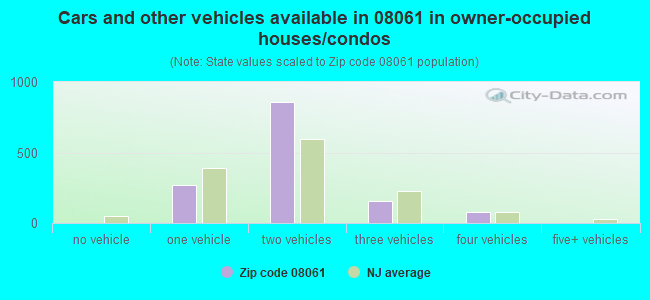
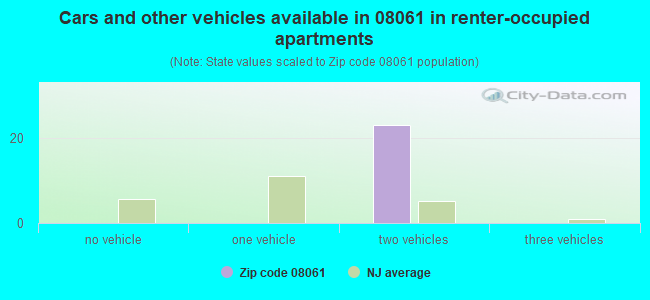
Houses and condos: 1,393 Renter-occupied apartments: 23
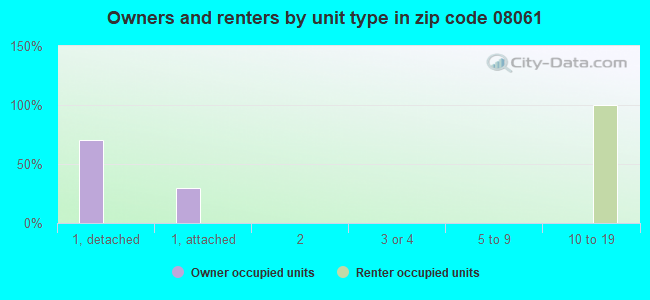
% of renters here:
2%
State:
35%
March 2022 cost of living index in zip code 08061: 98.6 (near average, U.S. average is 100)
Land area: 1.4 sq. mi. Water area: 0.3 sq. mi.
Population density: 2,509 people per square mile
(average).
OSM Map
Google Map
MSN Map
OSM Map
General Map
Google Map
MSN Map
OSM Map
Google Map
MSN Map
OSM Map
Google Map
MSN Map
Please wait while loading the map...
Real estate property taxes paid for housing units in 2022:
This zip code:
2.4% ($8,621)
New Jersey:
2.1% ($8,897)
Median real estate property taxes paid for housing units with mortgages in 2022: $8,615 (2.4%) Median real estate property taxes paid for housing units with no mortgage in 2022: $8,787 (2.4%)
Business Search- 14 Million verified businesses
Males: 1,597
(45.4%)
Females: 1,923
(54.6%)
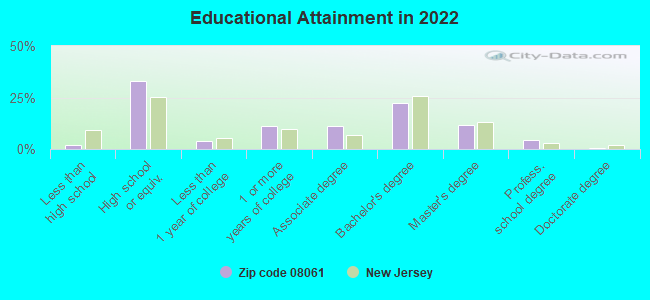
For population 25 years and over in 08061:
High school or higher: 97.4%
Bachelor's degree or higher: 38.5%
Graduate or professional degree: 16.5%
Unemployed: 2.5%
Mean travel time to work (commute): 27.0 minutes
For population 15 years and over in 08061:
Never married: 19.9%
Now married: 72.3%
Separated: 2.0%
Widowed: 3.1%
Divorced: 2.8%
Zip code 08061 compared to state average:
Unemployed percentage below state average.
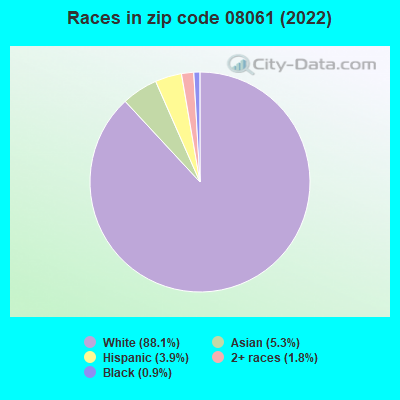
Black race population percentage significantly below state average.
Hispanic race population percentage significantly below state average.
Foreign-born population percentage significantly below state average.
Renting percentage significantly below state average.
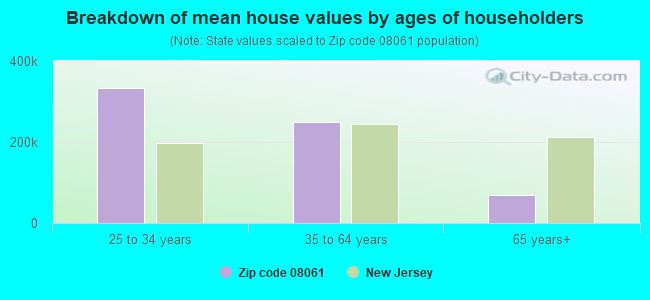
Estimated median house/condo value in 2022: $357,524
08061:
$357,524
New Jersey:
$428,900
According to our research of New Jersey and other state lists, there was 1 registered sex offender living in 08061 zip code as of April 28, 2024. The ratio of all residents to sex offenders in zip code 08061 is 3,116 to 1. The ratio of registered sex offenders to all residents in this zip code is lower than the state average.
Median resident age:
This zip code:
39.7 years
New Jersey median age:
40.4 years
Average household size:
This zip code:
2.6 people
New Jersey:
2.6 people
Averages for the 2020 tax year for zip code 08061, filed in 2021:
Average Adjusted Gross Income (AGI) in 2020: $108,926 (Individual Income Tax Returns)
Here:
$108,926
State:
$95,247
Salary/wage: $91,230 (reported on 91.4% of returns)
Here:
$91,230
State:
$80,635
(% of AGI for various income ranges: 1215.7% for AGIs below $25k, 4123.8% for AGIs $25k-50k, 5948.9% for AGIs $50k-75k, 9392.1% for AGIs $75k-100k, 20848.7% for AGIs $100k-200k, 49028.8% for AGIs over 200k)
Taxable interest for individuals: $675 (reported on 32.1% of returns)
This zip code:
$675
New Jersey:
$2,414
(% of AGI for various income ranges: 6.5% for AGIs below $25k, 10.6% for AGIs $25k-50k, 12.8% for AGIs $50k-75k, 16.4% for AGIs $75k-100k, 43.7% for AGIs $100k-200k, 177.5% for AGIs over 200k)
Ordinary dividends: $2,092 (reported on 24.7% of returns)
Here:
$2,092
State:
$8,057
(% of AGI for various income ranges: 6.1% for AGIs below $25k, 13.1% for AGIs $25k-50k, 72.8% for AGIs $50k-75k, 42.1% for AGIs $75k-100k, 90.7% for AGIs $100k-200k, 425.0% for AGIs over 200k)
Net capital gain/loss in AGI: +$7,500 (reported on 19.8% of returns)
Here:
+$7,500
State:
+$25,022
(% of AGI for various income ranges: 50.0% for AGIs $25k-50k, 51.1% for AGIs $50k-75k, 67.1% for AGIs $75k-100k, 146.7% for AGIs $100k-200k, 2120.0% for AGIs over 200k)
Profit/loss from business: +$16,695 (reported on 13.6% of returns)
Here:
+$16,695
State:
+$18,035
(% of AGI for various income ranges: 103.9% for AGIs below $25k, 111.9% for AGIs $25k-50k, 180.0% for AGIs $50k-75k, 172.9% for AGIs $75k-100k, 469.0% for AGIs $100k-200k, 1602.5% for AGIs over 200k)
Taxable individual retirement arrangement distribution: $17,230 (reported on 6.2% of returns)
08061:
$17,230
New Jersey:
$21,558
(% of AGI for various income ranges: 57.0% for AGIs below $25k, 343.3% for AGIs $50k-75k, 324.7% for AGIs $100k-200k)
Total itemized deductions: $26,376 (reported on 17.9% of returns)
Here:
$26,376
State:
$32,863
(% of AGI for various income ranges: 281.2% for AGIs $25k-50k, 506.1% for AGIs $50k-75k, 966.4% for AGIs $75k-100k, 974.3% for AGIs $100k-200k, 2515.0% for AGIs over 200k)
Charity contributions: $5,152 (reported on 14.2% of returns)
Here:
$5,152
State:
$7,880
(% of AGI for various income ranges: 56.1% for AGIs $50k-75k, 100.0% for AGIs $75k-100k, 148.0% for AGIs $100k-200k, 625.0% for AGIs over 200k)
Taxes paid: $9,266 (reported on 17.9% of returns)
08061:
$9,266
State:
$9,183
(% of AGI for various income ranges: 104.4% for AGIs $25k-50k, 195.0% for AGIs $50k-75k, 385.7% for AGIs $75k-100k, 344.7% for AGIs $100k-200k, 743.8% for AGIs over 200k)
Earned income credit: $2,209 (reported on 6.8% of returns)
Here:
$2,209
State:
$2,148
(% of AGI for various income ranges: 57.4% for AGIs below $25k, 69.4% for AGIs $25k-50k)
Percentage of individuals using paid preparers for their 2020 taxes: 94.4%
Here:
94%
State:
92%
(% for various income ranges: 90.9% for AGIs below $25k, 95.5% for AGIs $25k-50k, 95.5% for AGIs $50k-75k, 94.7% for AGIs $75k-100k, 95.9% for AGIs $100k-200k, 94.1% for AGIs over 200k)
Averages for the 2012 tax year for zip code 08061, filed in 2013:
Average Adjusted Gross Income (AGI) in 2012: $85,537 (Individual Income Tax Returns)
Here:
$85,537
State:
$79,688
Salary/wage: $77,860 (reported on 90.8% of returns)
Here:
$77,860
State:
$68,122
(% of AGI for various income ranges: 73.4% for AGIs below $25k, 80.4% for AGIs $25k-50k, 84.1% for AGIs $50k-75k, 90.1% for AGIs $75k-100k, 91.4% for AGIs $100k-200k, 53.8% for AGIs over 200k)
Taxable interest for individuals: $527 (reported on 39.4% of returns)
This zip code:
$527
New Jersey:
$2,193
(% of AGI for various income ranges: 0.5% for AGIs below $25k, 0.4% for AGIs $25k-50k, 0.4% for AGIs $50k-75k, 0.2% for AGIs $75k-100k, 0.2% for AGIs $100k-200k, 0.2% for AGIs over 200k)
Ordinary dividends: $1,458 (reported on 21.8% of returns)
Here:
$1,458
State:
$6,828
(% of AGI for various income ranges: 1.8% for AGIs below $25k, 0.6% for AGIs $25k-50k, 0.8% for AGIs $50k-75k, 0.1% for AGIs $75k-100k, 0.2% for AGIs $100k-200k, 0.4% for AGIs over 200k)
Net capital gain/loss in AGI: +$857 (reported on 14.8% of returns)
Here:
+$857
State:
+$15,358
(% of AGI for various income ranges: 0.6% for AGIs $50k-75k, 0.6% for AGIs over 200k)
Profit/loss from business: +$16,640 (reported on 10.6% of returns)
Here:
+$16,640
State:
+$19,577
(% of AGI for various income ranges: 14.9% for AGIs below $25k, 1.0% for AGIs $50k-75k, 1.5% for AGIs $75k-100k, 2.8% for AGIs $100k-200k)
Taxable individual retirement arrangement distribution: $12,189 (reported on 6.3% of returns)
08061:
$12,189
New Jersey:
$18,214
(% of AGI for various income ranges: 7.4% for AGIs below $25k, 3.4% for AGIs $50k-75k, 0.7% for AGIs $100k-200k)
Total itemized deductions: $24,891 (21% of AGI, reported on 62.7% of returns)
Here:
$24,891
State:
$30,827
Here:
21.3% of AGI
State:
21.2% of AGI
(% of AGI for various income ranges: 11.6% for AGIs below $25k, 15.6% for AGIs $25k-50k, 20.1% for AGIs $50k-75k, 22.6% for AGIs $75k-100k, 18.9% for AGIs $100k-200k, 13.4% for AGIs over 200k)
Charity contributions: $2,059 (reported on 55.6% of returns)
Here:
$2,059
State:
$3,451
(% of AGI for various income ranges: 1.5% for AGIs $25k-50k, 1.3% for AGIs $50k-75k, 1.4% for AGIs $75k-100k, 1.5% for AGIs $100k-200k, 1.1% for AGIs over 200k)
Taxes paid: $11,782 (reported on 62.7% of returns)
08061:
$11,782
State:
$15,801
(% of AGI for various income ranges: 4.6% for AGIs below $25k, 6.1% for AGIs $25k-50k, 8.6% for AGIs $50k-75k, 9.4% for AGIs $75k-100k, 8.9% for AGIs $100k-200k, 8.8% for AGIs over 200k)
Earned income credit: $1,917 (reported on 8.5% of returns)
Here:
$1,917
State:
$2,182
(% of AGI for various income ranges: 4.5% for AGIs below $25k, 1.0% for AGIs $25k-50k)
Percentage of individuals using paid preparers for their 2012 taxes: 57.7%
Here:
58%
State:
65%
(% for various income ranges: 50.0% for AGIs below $25k, 59.1% for AGIs $25k-50k, 59.1% for AGIs $50k-75k, 57.1% for AGIs $75k-100k, 61.9% for AGIs $100k-200k, 60.0% for AGIs over 200k)
Averages for the 2004 tax year for zip code 08061, filed in 2005:
Average Adjusted Gross Income (AGI) in 2004: $65,639 (Individual Income Tax Returns)
Here:
$65,639
State:
$64,921
Salary/wage: $63,323 (reported on 88.6% of returns)
Here:
$63,323
State:
$57,755
(% of AGI for various income ranges: 119.0% for AGIs below $10k, 58.5% for AGIs $10k-25k, 85.1% for AGIs $25k-50k, 86.6% for AGIs $50k-75k, 93.9% for AGIs $75k-100k, 82.1% for AGIs over 100k)
Taxable interest for individuals: $661 (reported on 52.5% of returns)
This zip code:
$661
New Jersey:
$2,068
(% of AGI for various income ranges: 5.6% for AGIs below $10k, 1.0% for AGIs $10k-25k, 0.3% for AGIs $25k-50k, 0.3% for AGIs $50k-75k, 0.3% for AGIs $75k-100k, 0.6% for AGIs over 100k)
Taxable dividends: $1,148 (reported on 29.0% of returns)
Here:
$1,148
State:
$3,959
(% of AGI for various income ranges: 2.8% for AGIs below $10k, 1.7% for AGIs $10k-25k, 0.1% for AGIs $25k-50k, 0.3% for AGIs $50k-75k, 0.4% for AGIs $75k-100k, 0.6% for AGIs over 100k)
Net capital gain/loss: +$3,025 (reported on 20.4% of returns)
Here:
+$3,025
State:
+$13,591
(% of AGI for various income ranges: -2.8% for AGIs below $10k, -1.0% for AGIs $10k-25k, -0.1% for AGIs $25k-50k, -0.2% for AGIs $50k-75k, -0.2% for AGIs $75k-100k, 2.4% for AGIs over 100k)
Profit/loss from business: +$7,752 (reported on 13.1% of returns)
Here:
+$7,752
State:
+$17,520
(% of AGI for various income ranges: 9.9% for AGIs $10k-25k, 4.2% for AGIs $25k-50k, 1.3% for AGIs $50k-75k, 0.5% for AGIs $75k-100k, 1.0% for AGIs over 100k)
IRA payment deduction: $2,722 (reported on 2.3% of returns)
08061:
$2,722
New Jersey:
$3,270
Total itemized deductions: $20,834 (23% of AGI, reported on 61.8% of returns)
Here:
$20,834
State:
$23,924
Here:
23.0% of AGI
State:
21.1% of AGI
(% of AGI for various income ranges: 27.6% for AGIs below $10k, 18.7% for AGIs $10k-25k, 20.7% for AGIs $25k-50k, 22.8% for AGIs $50k-75k, 21.8% for AGIs $75k-100k, 17.1% for AGIs over 100k)
Charity contributions deductions: $2,451 (3% of AGI, reported on 55.6% of returns)
Here:
$2,451
State:
$3,242
Here:
2.6% of AGI
State:
2.7% of AGI
(% of AGI for various income ranges: 1.6% for AGIs $10k-25k, 2.2% for AGIs $25k-50k, 1.9% for AGIs $50k-75k, 2.4% for AGIs $75k-100k, 2.0% for AGIs over 100k)
Total tax: $9,120 (reported on 84.3% of returns)
08061:
$9,120
State:
$12,321
(% of AGI for various income ranges: 3.5% for AGIs below $10k, 4.5% for AGIs $10k-25k, 6.6% for AGIs $25k-50k, 8.3% for AGIs $50k-75k, 9.2% for AGIs $75k-100k, 16.0% for AGIs over 100k)
Earned income credit: $1,650 (reported on 7.8% of returns)
Here:
$1,650
State:
$1,711
Percentage of individuals using paid preparers for their 2004 taxes: 61.8%
Here:
62%
State:
65%
(% for various income ranges: 51.4% for AGIs below $10k, 61.4% for AGIs $10k-25k, 62.7% for AGIs $25k-50k, 66.1% for AGIs $50k-75k, 65.2% for AGIs $75k-100k, 62.3% for AGIs over 100k)
Household received Food Stamps/SNAP in the past 12 months: 0 Household did not receive Food Stamps/SNAP in the past 12 months: 1,351
Women who had a birth in the past 12 months: 53 (54 now married, 0 unmarried) Women who did not have a birth in the past 12 months: 906 (564 now married, 338 unmarried)
Housing units in zip code 08061 with a mortgage: 1,132 (59 second mortgage, 42 both second mortgage and home equity loan) Houses without a mortgage: 9
Median monthly owner costs for units with a mortgage: $2,648 Median monthly owner costs for units without a mortgage: $1,087
Residents with income below the poverty level in 2022:
This zip code:
0.3%
Whole state:
9.7%
Median number of rooms in houses and condos:
Here:
7.2
State:
6.8
Notable locations in this zip code not listed on our city pages
Size of family households: 500 2-persons, 371 3-persons, 175 4-persons, 73 5-persons
Size of nonfamily households: 163 1-person, 82 2-persons
702 married couples with children.
104 single-parent households (104 women).
91.0% of residents of 08061 zip code speak English at home.
2.3% of residents speak Spanish at home (100% very well).
1.3% of residents speak other Indo-European language at home (100% very well).
5.0% of residents speak Asian or Pacific Island language at home (67% very well, 14% well, 19% not well).
Foreign born population: 179 (5.1%) (87.0% of them are naturalized citizens)
This zip code:
5.1%
Whole state:
23.5%
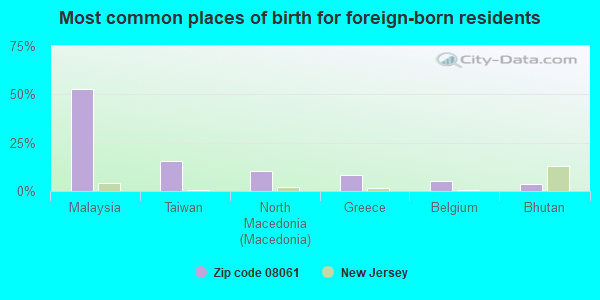
53%Malaysia
16%Taiwan
10%North Macedonia (Macedonia)
8%Greece
5%Belgium
3%Bhutan
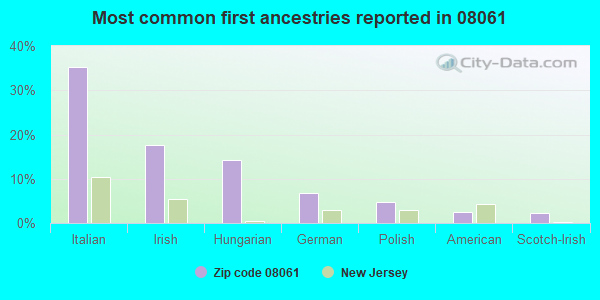
35%Italian
18%Irish
14%Hungarian
7%German
5%Polish
2%American
2%Scotch-Irish
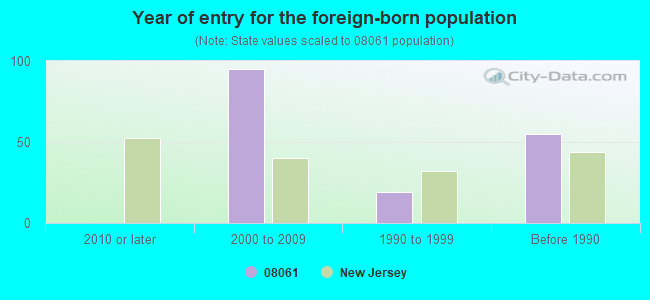
Year of entry for the foreign-born population
02010 or later
952000 to 2009
191990 to 1999
55Before 1990
Facilities with environmental interests located in this zip code:
A T & T (BERKLEY & BARNSBORO ROAD in MOUNT ROYAL, NJ)
Conditionally Exempt Small Quantity Generators, less than 100 kg/month of hazardous waste (Resource Conservation and Recovery Act (tracking hazardous waste)) - notification Organizations: A T & T COMMUNICATIONS (CONTACT/OWNER)
Alternative names: A T & T - NJ2350
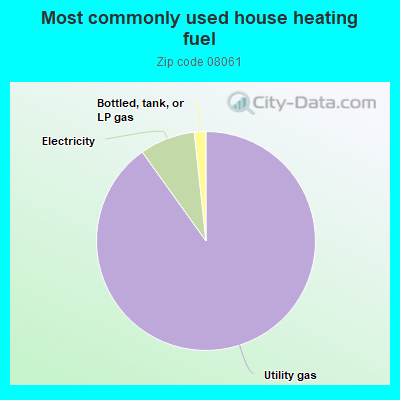
90.2%Utility gas
8.2%Electricity
1.7%Bottled, tank, or LP gas
Population in 1990: 239. Population change in the 1990s: +474 (+198.3%).
Place of birth for U.S.-born residents:
This state: 1,963
Northeast: 962
Midwest: 40
South: 334
West: 43
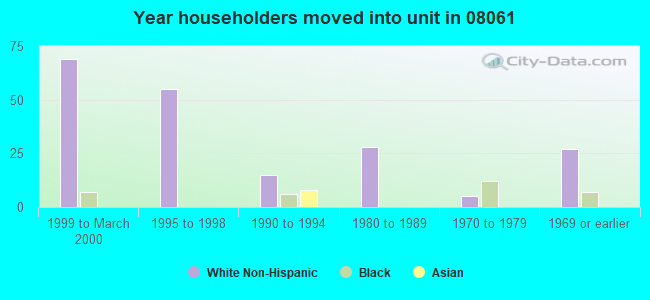
42% of the 08061 zip code residents lived in the same house 5 years ago. Out of people who lived in different houses, 60% lived in this county. Out of people who lived in different counties, 50% lived in New Jersey.
94% of the 08061 zip code residents lived in the same house 1 year ago. Out of people who lived in different houses, 72% moved from this county. Out of people who lived in different houses, 22% moved from different county within same state.
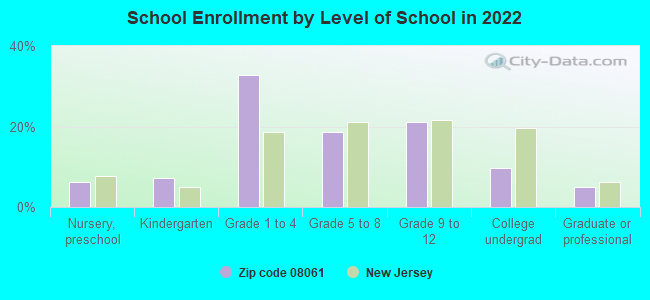
Private vs. public school enrollment:
Students in private schools in grades 1 to 8 (elementary and middle school): 69
Here:
17.7%
New Jersey:
12.3%
Students in private schools in grades 9 to 12 (high school):
Here:
0.0%
New Jersey:
13.1%
Students in private undergraduate colleges:
Here:
0.0%
New Jersey:
33.2%
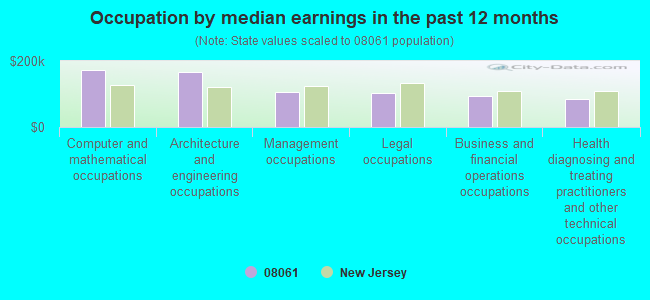
Occupation by median earnings in the past 12 months ($)
171,719Computer and mathematical occupations
165,170Architecture and engineering occupations
105,861Management occupations
102,478Legal occupations
95,131Business and financial operations occupations
85,455Health diagnosing and treating practitioners and other technical occupations
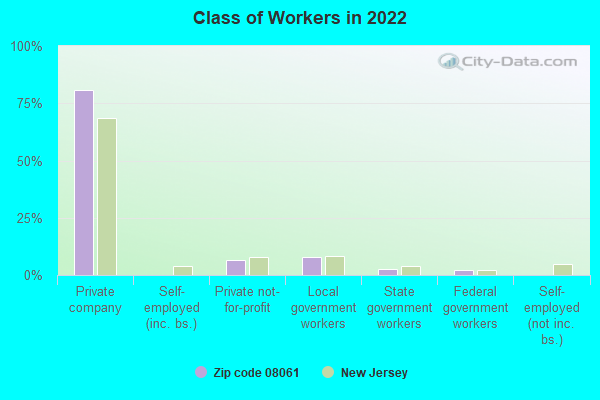
Top industries in this zip code by the number of employees in 2005:
Administrative and Support and Waste Management and Remediation Services: Office Administrative Services (20-49 employees: 1 establishment)
Construction: Land Subdivision (10-19: 1)
Construction: New Single-Family Housing Construction (except Operative Builders) (10-19: 1)
Accommodation and Food Services: Limited-Service Restaurants (5-9: 1, 1-4: 1)
Other Services (except Public Administration): General Automotive Repair (5-9: 1)
Administrative and Support and Waste Management and Remediation Services: Landscaping Services (1-4: 2)
Professional, Scientific, and Technical Services: Advertising Agencies (1-4: 1)
Fatal accident statistics in 2011:
Fatal accident count: 1
Vehicles involved in fatal accidents: 1
Fatal accidents caused by drunken drivers: 1
Fatalities: 1
Persons involved in fatal accidents: 1
Pedestrians involved in fatal accidents: 0
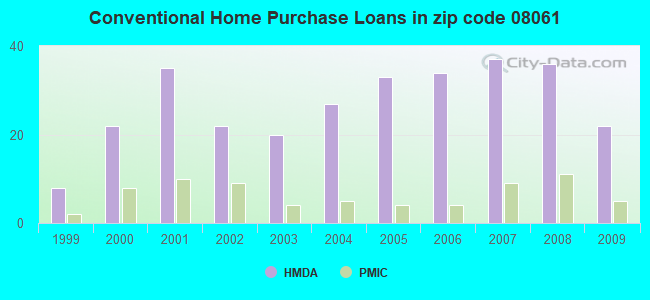
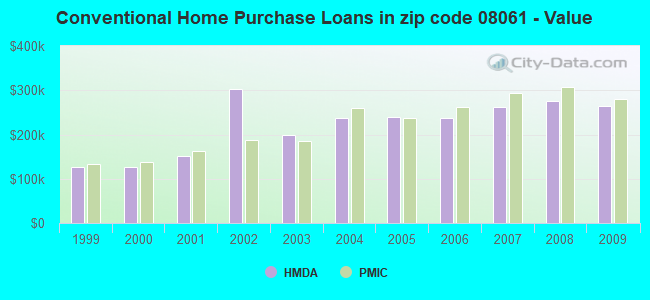
Home Mortgage Disclosure Act Aggregated Statistics For Year 2009 (Based on 4 partial tracts)
A) FHA, FSA/RHS & VA Home Purchase Loans
B) Conventional Home Purchase Loans
C) Refinancings
D) Home Improvement Loans
F) Non-occupant Loans on < 5 Family Dwellings (A B C & D)
Number
Average Value
Number
Average Value
Number
Average Value
Number
Average Value
Number
Average Value
LOANS ORIGINATED
15
$240,517
22
$263,361
56
$247,920
3
$119,093
1
$230,200
APPLICATIONS APPROVED, NOT ACCEPTED
1
$229,430
1
$234,680
4
$284,155
0
$0
0
$0
APPLICATIONS DENIED
3
$299,977
2
$289,335
22
$271,864
3
$69,363
0
$0
APPLICATIONS WITHDRAWN
4
$225,060
4
$262,355
13
$268,457
0
$0
0
$0
FILES CLOSED FOR INCOMPLETENESS
0
$0
0
$0
4
$262,085
0
$0
0
$0
Aggregated Statistics For Year 2008 (Based on 4 partial tracts)
A) FHA, FSA/RHS & VA Home Purchase Loans
B) Conventional Home Purchase Loans
C) Refinancings
D) Home Improvement Loans
F) Non-occupant Loans on < 5 Family Dwellings (A B C & D)
Number
Average Value
Number
Average Value
Number
Average Value
Number
Average Value
Number
Average Value
LOANS ORIGINATED
5
$283,258
36
$275,983
27
$233,687
7
$41,654
1
$235,150
APPLICATIONS APPROVED, NOT ACCEPTED
0
$0
3
$259,523
3
$305,643
1
$68,020
0
$0
APPLICATIONS DENIED
1
$342,130
3
$287,040
15
$239,558
3
$35,610
0
$0
APPLICATIONS WITHDRAWN
1
$271,010
6
$301,728
6
$251,148
0
$0
0
$0
FILES CLOSED FOR INCOMPLETENESS
0
$0
1
$234,060
2
$358,055
0
$0
0
$0
Aggregated Statistics For Year 2007 (Based on 4 partial tracts)
A) FHA, FSA/RHS & VA Home Purchase Loans
B) Conventional Home Purchase Loans
C) Refinancings
D) Home Improvement Loans
F) Non-occupant Loans on < 5 Family Dwellings (A B C & D)
Number
Average Value
Number
Average Value
Number
Average Value
Number
Average Value
Number
Average Value
LOANS ORIGINATED
2
$199,125
37
$262,619
28
$192,240
14
$59,179
1
$183,660
APPLICATIONS APPROVED, NOT ACCEPTED
0
$0
4
$221,928
6
$218,347
3
$67,920
0
$0
APPLICATIONS DENIED
0
$0
4
$293,818
14
$261,804
5
$68,766
0
$0
APPLICATIONS WITHDRAWN
0
$0
7
$260,191
10
$226,427
0
$0
1
$199,120
FILES CLOSED FOR INCOMPLETENESS
0
$0
2
$151,355
2
$257,330
0
$0
0
$0
Aggregated Statistics For Year 2006 (Based on 4 partial tracts)
A) FHA, FSA/RHS & VA Home Purchase Loans
B) Conventional Home Purchase Loans
C) Refinancings
D) Home Improvement Loans
F) Non-occupant Loans on < 5 Family Dwellings (A B C & D)
Number
Average Value
Number
Average Value
Number
Average Value
Number
Average Value
Number
Average Value
LOANS ORIGINATED
1
$239,940
34
$237,929
32
$198,362
13
$52,338
4
$177,402
APPLICATIONS APPROVED, NOT ACCEPTED
0
$0
8
$269,178
6
$167,663
1
$47,310
0
$0
APPLICATIONS DENIED
0
$0
6
$260,810
10
$252,168
4
$71,078
0
$0
APPLICATIONS WITHDRAWN
0
$0
10
$237,636
10
$257,378
1
$33,080
0
$0
FILES CLOSED FOR INCOMPLETENESS
0
$0
2
$187,915
2
$372,200
0
$0
0
$0
Aggregated Statistics For Year 2005 (Based on 4 partial tracts)
A) FHA, FSA/RHS & VA Home Purchase Loans
B) Conventional Home Purchase Loans
C) Refinancings
D) Home Improvement Loans
F) Non-occupant Loans on < 5 Family Dwellings (A B C & D)
Number
Average Value
Number
Average Value
Number
Average Value
Number
Average Value
Number
Average Value
LOANS ORIGINATED
1
$136,050
33
$239,616
36
$175,948
13
$53,206
1
$172,220
APPLICATIONS APPROVED, NOT ACCEPTED
0
$0
3
$233,087
6
$179,723
2
$48,005
0
$0
APPLICATIONS DENIED
0
$0
4
$196,265
12
$175,768
6
$75,033
0
$0
APPLICATIONS WITHDRAWN
0
$0
4
$176,748
15
$197,259
3
$107,860
0
$0
FILES CLOSED FOR INCOMPLETENESS
0
$0
1
$106,520
2
$270,550
0
$0
0
$0
Aggregated Statistics For Year 2004 (Based on 4 partial tracts)
A) FHA, FSA/RHS & VA Home Purchase Loans
B) Conventional Home Purchase Loans
C) Refinancings
D) Home Improvement Loans
F) Non-occupant Loans on < 5 Family Dwellings (A B C & D)
Number
Average Value
Number
Average Value
Number
Average Value
Number
Average Value
Number
Average Value
LOANS ORIGINATED
1
$157,850
27
$237,340
37
$161,591
14
$47,716
1
$113,790
APPLICATIONS APPROVED, NOT ACCEPTED
0
$0
4
$198,545
8
$173,731
2
$48,545
0
$0
APPLICATIONS DENIED
0
$0
2
$298,610
14
$170,369
2
$77,610
0
$0
APPLICATIONS WITHDRAWN
0
$0
4
$209,522
10
$181,717
1
$117,340
1
$181,190
FILES CLOSED FOR INCOMPLETENESS
0
$0
1
$128,780
2
$193,945
0
$0
0
$0
Aggregated Statistics For Year 2003 (Based on 4 partial tracts)
A) FHA, FSA/RHS & VA Home Purchase Loans
B) Conventional Home Purchase Loans
C) Refinancings
D) Home Improvement Loans
F) Non-occupant Loans on < 5 Family Dwellings (A B C & D)
Number
Average Value
Number
Average Value
Number
Average Value
Number
Average Value
Number
Average Value
LOANS ORIGINATED
2
$131,795
20
$198,104
81
$151,731
7
$36,883
2
$136,665
APPLICATIONS APPROVED, NOT ACCEPTED
0
$0
4
$197,810
13
$143,754
1
$31,690
0
$0
APPLICATIONS DENIED
0
$0
1
$201,440
16
$178,176
3
$30,097
0
$0
APPLICATIONS WITHDRAWN
0
$0
3
$236,847
15
$152,539
0
$0
0
$0
FILES CLOSED FOR INCOMPLETENESS
0
$0
0
$0
2
$232,830
0
$0
0
$0
Aggregated Statistics For Year 2002 (Based on 4 partial tracts)
A) FHA, FSA/RHS & VA Home Purchase Loans
B) Conventional Home Purchase Loans
C) Refinancings
D) Home Improvement Loans
F) Non-occupant Loans on < 5 Family Dwellings (A B C & D)
Number
Average Value
Number
Average Value
Number
Average Value
Number
Average Value
Number
Average Value
LOANS ORIGINATED
3
$1,439,533
22
$303,831
46
$207,228
8
$28,871
1
$140,070
APPLICATIONS APPROVED, NOT ACCEPTED
0
$0
2
$181,500
8
$135,275
2
$47,695
0
$0
APPLICATIONS DENIED
0
$0
1
$185,520
8
$126,250
3
$33,703
0
$0
APPLICATIONS WITHDRAWN
0
$0
2
$167,820
8
$121,071
2
$25,275
0
$0
FILES CLOSED FOR INCOMPLETENESS
0
$0
1
$102,650
2
$127,545
0
$0
0
$0
Aggregated Statistics For Year 2001 (Based on 4 partial tracts)
A) FHA, FSA/RHS & VA Home Purchase Loans
B) Conventional Home Purchase Loans
C) Refinancings
D) Home Improvement Loans
F) Non-occupant Loans on < 5 Family Dwellings (A B C & D)
Number
Average Value
Number
Average Value
Number
Average Value
Number
Average Value
Number
Average Value
LOANS ORIGINATED
3
$144,447
35
$151,111
30
$114,074
8
$22,610
1
$39,270
APPLICATIONS APPROVED, NOT ACCEPTED
0
$0
3
$112,910
6
$84,540
2
$40,505
0
$0
APPLICATIONS DENIED
0
$0
2
$209,870
9
$95,217
3
$21,953
0
$0
APPLICATIONS WITHDRAWN
1
$93,690
3
$150,427
9
$130,654
0
$0
0
$0
FILES CLOSED FOR INCOMPLETENESS
0
$0
0
$0
2
$120,590
0
$0
0
$0
Aggregated Statistics For Year 2000 (Based on 4 partial tracts)
A) FHA, FSA/RHS & VA Home Purchase Loans
B) Conventional Home Purchase Loans
C) Refinancings
D) Home Improvement Loans
F) Non-occupant Loans on < 5 Family Dwellings (A B C & D)
Number
Average Value
Number
Average Value
Number
Average Value
Number
Average Value
Number
Average Value
LOANS ORIGINATED
5
$151,848
22
$125,493
6
$107,730
7
$26,017
1
$51,480
APPLICATIONS APPROVED, NOT ACCEPTED
1
$86,890
2
$140,610
2
$95,310
3
$35,043
0
$0
APPLICATIONS DENIED
0
$0
1
$216,440
5
$60,480
3
$18,087
0
$0
APPLICATIONS WITHDRAWN
0
$0
2
$139,295
5
$98,882
0
$0
0
$0
FILES CLOSED FOR INCOMPLETENESS
0
$0
0
$0
1
$59,680
0
$0
0
$0
Aggregated Statistics For Year 1999 (Based on 2 partial tracts)
Detailed PMIC statistics for the following Tracts:5006.00
2003 - 2018 National Fire Incident Reporting System (NFIRS) incidents
Based on the data from the years 2003 - 2018 the average number of fires per year is 7. The highest number of reported fires - 17 took place in 2017, and the least - 2 in 2012. The data has a rising trend.
When looking into fire subcategories, the most reports belonged to: Structure Fires (58.0%), and Mobile Property/Vehicle Fires (22.3%).
Fire incident types reported to NFIRS in Zip Code 08061


 Nearest zip codes: 08020, 08051, 08066, 08056, 08090, 08086.
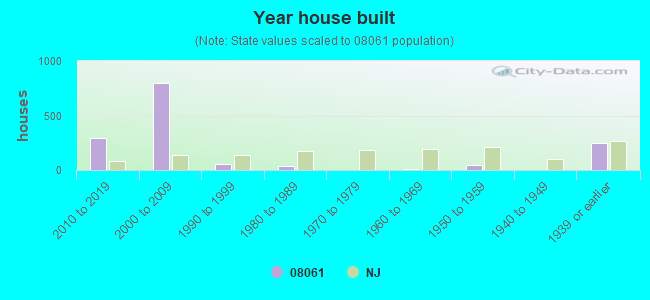


 Based on the data from the years 2003 - 2018 the average number of fires per year is 7. The highest number of reported fires - 17 took place in 2017, and the least - 2 in 2012. The data has a rising trend.
 When looking into fire subcategories, the most reports belonged to: Structure Fires (58.0%), and Mobile Property/Vehicle Fires (22.3%).