Estimated zip code population in 2022: 9,856 Zip code population in 2010: 8,358 Zip code population in 2000: 8,586
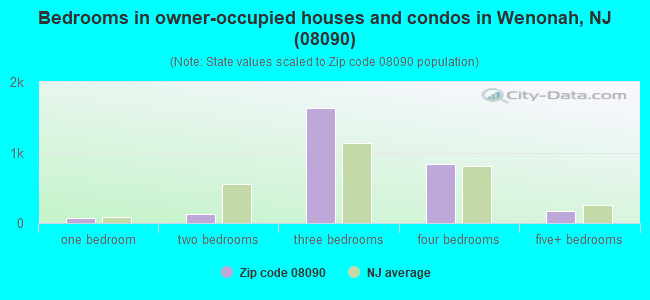
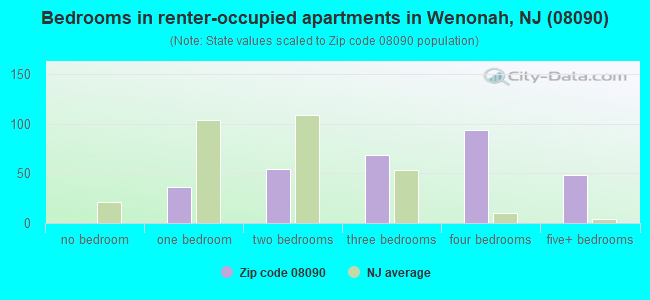
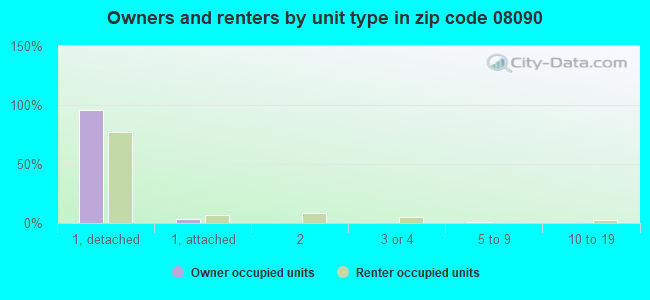
Houses and condos: 3,213 Renter-occupied apartments: 311
% of renters here:
10%
State:
35%
March 2022 cost of living index in zip code 08090: 100.2 (near average, U.S. average is 100)
Land area: 2.6 sq. mi. Water area: 0.0 sq. mi.
Population density: 3,845 people per square mile
(average).
OSM Map
Google Map
MSN Map
OSM Map
General Map
Google Map
MSN Map
OSM Map
Google Map
MSN Map
OSM Map
Google Map
MSN Map
Please wait while loading the map...
Real estate property taxes paid for housing units in 2022:
This zip code:
2.5% ($6,723)
New Jersey:
2.1% ($8,897)
Median real estate property taxes paid for housing units with mortgages in 2022: $6,910 (2.5%) Median real estate property taxes paid for housing units with no mortgage in 2022: $6,390 (2.7%)
Business Search- 14 Million verified businesses
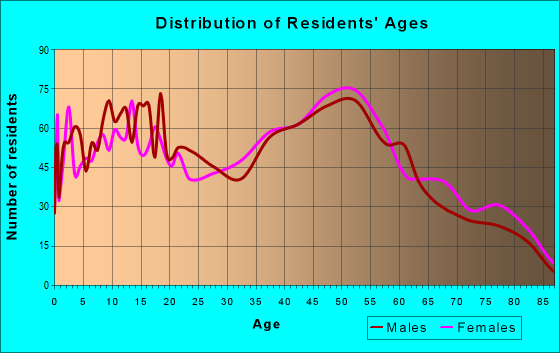
Males: 5,152
(52.3%)
Females: 4,704
(47.7%)
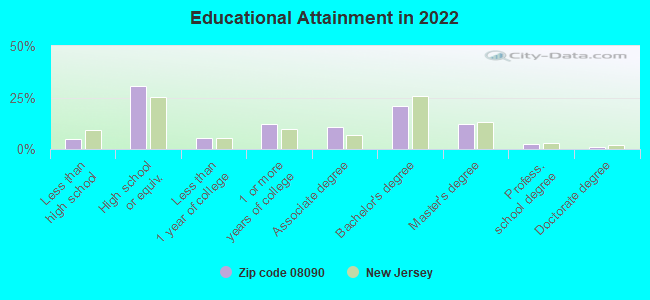
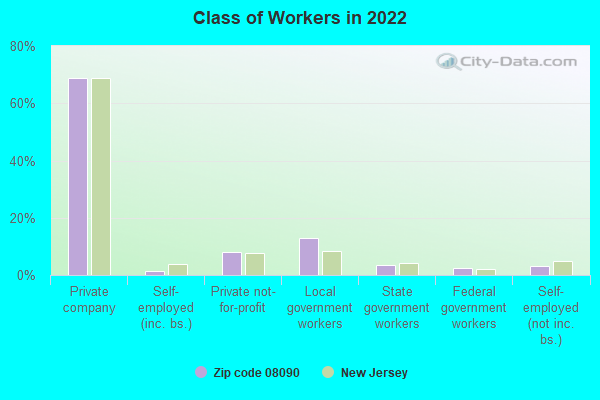
For population 25 years and over in 08090:
High school or higher: 94.6%
Bachelor's degree or higher: 36.2%
Graduate or professional degree: 15.4%
Unemployed: 3.1%
Mean travel time to work (commute): 26.4 minutes
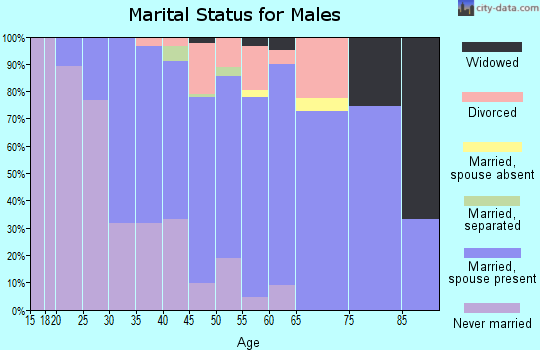
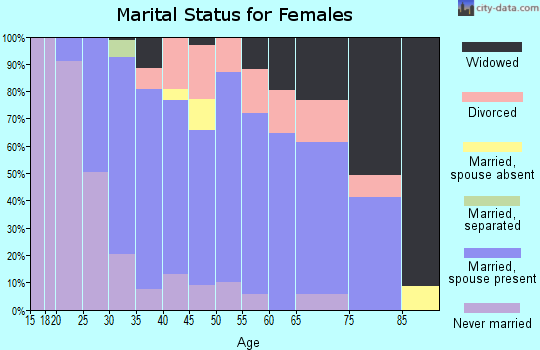
For population 15 years and over in 08090:
Never married: 35.9%
Now married: 51.1%
Separated: 1.5%
Widowed: 5.3%
Divorced: 6.3%
Zip code 08090 compared to state average:
Median house value below state average.
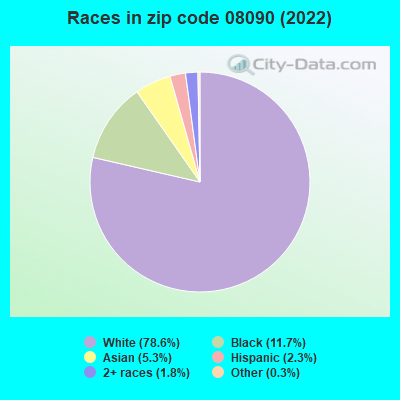
Hispanic race population percentage significantly below state average.
Median age below state average.
Foreign-born population percentage significantly below state average.
Renting percentage significantly below state average.
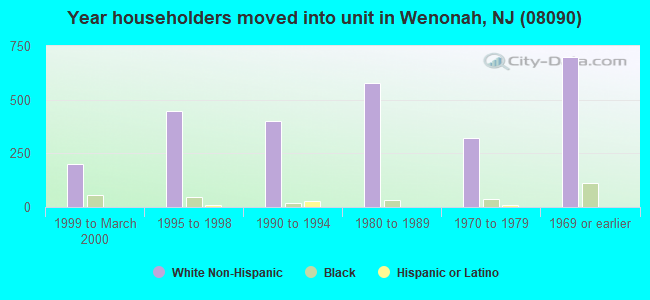
Length of stay since moving in significantly above state average.
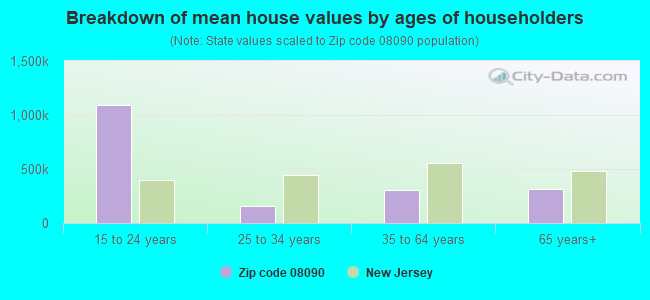
Estimated median house/condo value in 2022: $264,136
08090:
$264,136
New Jersey:
$428,900
According to our research of New Jersey and other state lists, there were 4 registered sex offenders living in 08090 zip code as of April 27, 2024. The ratio of all residents to sex offenders in zip code 08090 is 2,142 to 1. The ratio of registered sex offenders to all residents in this zip code is near the state average.
Median resident age:
This zip code:
34.0 years
New Jersey median age:
40.4 years
Average household size:
This zip code:
3.1 people
New Jersey:
2.6 people
Averages for the 2020 tax year for zip code 08090, filed in 2021:
Average Adjusted Gross Income (AGI) in 2020: $77,150 (Individual Income Tax Returns)
Here:
$77,150
State:
$95,247
Salary/wage: $67,740 (reported on 84.8% of returns)
Here:
$67,740
State:
$80,635
(% of AGI for various income ranges: 1135.0% for AGIs below $25k, 3426.1% for AGIs $25k-50k, 6104.4% for AGIs $50k-75k, 9693.9% for AGIs $75k-100k, 18100.7% for AGIs $100k-200k, 62196.2% for AGIs over 200k)
Taxable interest for individuals: $1,221 (reported on 28.9% of returns)
This zip code:
$1,221
New Jersey:
$2,414
(% of AGI for various income ranges: 14.7% for AGIs below $25k, 15.9% for AGIs $25k-50k, 32.5% for AGIs $50k-75k, 23.7% for AGIs $75k-100k, 75.6% for AGIs $100k-200k, 823.8% for AGIs over 200k)
Ordinary dividends: $4,998 (reported on 19.4% of returns)
Here:
$4,998
State:
$8,057
(% of AGI for various income ranges: 18.3% for AGIs below $25k, 35.2% for AGIs $25k-50k, 61.6% for AGIs $50k-75k, 82.2% for AGIs $75k-100k, 154.9% for AGIs $100k-200k, 3040.0% for AGIs over 200k)
Net capital gain/loss in AGI: +$11,772 (reported on 15.9% of returns)
Here:
+$11,772
State:
+$25,022
(% of AGI for various income ranges: 12.3% for AGIs below $25k, 16.9% for AGIs $25k-50k, 55.3% for AGIs $50k-75k, 71.0% for AGIs $75k-100k, 221.8% for AGIs $100k-200k, 7992.5% for AGIs over 200k)
Profit/loss from business: +$12,576 (reported on 11.0% of returns)
Here:
+$12,576
State:
+$18,035
(% of AGI for various income ranges: 42.4% for AGIs below $25k, 43.5% for AGIs $25k-50k, 56.4% for AGIs $50k-75k, 119.0% for AGIs $75k-100k, 259.6% for AGIs $100k-200k, 4191.2% for AGIs over 200k)
Taxable individual retirement arrangement distribution: $18,960 (reported on 9.5% of returns)
08090:
$18,960
New Jersey:
$21,558
(% of AGI for various income ranges: 62.1% for AGIs below $25k, 126.0% for AGIs $25k-50k, 234.0% for AGIs $50k-75k, 255.6% for AGIs $75k-100k, 469.5% for AGIs $100k-200k, 2141.2% for AGIs over 200k)
Total itemized deductions: $25,409 (reported on 12.8% of returns)
Here:
$25,409
State:
$32,863
(% of AGI for various income ranges: 220.4% for AGIs $25k-50k, 473.1% for AGIs $50k-75k, 723.7% for AGIs $75k-100k, 729.8% for AGIs $100k-200k, 4193.8% for AGIs over 200k)
Charity contributions: $4,333 (reported on 10.1% of returns)
Here:
$4,333
State:
$7,880
(% of AGI for various income ranges: 21.2% for AGIs $25k-50k, 33.5% for AGIs $50k-75k, 70.5% for AGIs $75k-100k, 114.7% for AGIs $100k-200k, 883.8% for AGIs over 200k)
Taxes paid: $8,928 (reported on 12.8% of returns)
08090:
$8,928
State:
$9,183
(% of AGI for various income ranges: 81.5% for AGIs $25k-50k, 199.3% for AGIs $50k-75k, 287.8% for AGIs $75k-100k, 281.4% for AGIs $100k-200k, 858.8% for AGIs over 200k)
Earned income credit: $1,915 (reported on 9.0% of returns)
Here:
$1,915
State:
$2,148
(% of AGI for various income ranges: 52.9% for AGIs below $25k, 49.6% for AGIs $25k-50k)
Percentage of individuals using paid preparers for their 2020 taxes: 92.7%
Here:
93%
State:
92%
(% for various income ranges: 91.8% for AGIs below $25k, 93.8% for AGIs $25k-50k, 91.9% for AGIs $50k-75k, 94.7% for AGIs $75k-100k, 92.6% for AGIs $100k-200k, 91.3% for AGIs over 200k)
Averages for the 2012 tax year for zip code 08090, filed in 2013:
Average Adjusted Gross Income (AGI) in 2012: $65,618 (Individual Income Tax Returns)
Here:
$65,618
State:
$79,688
Salary/wage: $56,696 (reported on 84.0% of returns)
Here:
$56,696
State:
$68,122
(% of AGI for various income ranges: 67.7% for AGIs below $25k, 72.2% for AGIs $25k-50k, 77.6% for AGIs $50k-75k, 81.7% for AGIs $75k-100k, 80.4% for AGIs $100k-200k, 46.8% for AGIs over 200k)
Taxable interest for individuals: $1,154 (reported on 34.6% of returns)
This zip code:
$1,154
New Jersey:
$2,193
(% of AGI for various income ranges: 1.3% for AGIs below $25k, 0.7% for AGIs $25k-50k, 0.5% for AGIs $50k-75k, 0.3% for AGIs $75k-100k, 0.5% for AGIs $100k-200k, 0.9% for AGIs over 200k)
Ordinary dividends: $3,484 (reported on 21.4% of returns)
Here:
$3,484
State:
$6,828
(% of AGI for various income ranges: 1.5% for AGIs below $25k, 1.0% for AGIs $25k-50k, 1.0% for AGIs $50k-75k, 1.0% for AGIs $75k-100k, 1.2% for AGIs $100k-200k, 1.2% for AGIs over 200k)
Net capital gain/loss in AGI: +$4,007 (reported on 13.3% of returns)
Here:
+$4,007
State:
+$15,358
(% of AGI for various income ranges: 0.3% for AGIs $25k-50k, 0.6% for AGIs $100k-200k, 3.3% for AGIs over 200k)
Profit/loss from business: +$16,426 (reported on 10.3% of returns)
Here:
+$16,426
State:
+$19,577
(% of AGI for various income ranges: 3.9% for AGIs below $25k, 2.6% for AGIs $25k-50k, 1.1% for AGIs $50k-75k, 1.0% for AGIs $75k-100k, 2.2% for AGIs $100k-200k, 5.6% for AGIs over 200k)
Taxable individual retirement arrangement distribution: $14,243 (reported on 11.5% of returns)
08090:
$14,243
New Jersey:
$18,214
(% of AGI for various income ranges: 4.5% for AGIs below $25k, 2.8% for AGIs $25k-50k, 2.1% for AGIs $50k-75k, 2.1% for AGIs $75k-100k, 3.7% for AGIs $100k-200k)
Self-employment retirement plans: $24,400 (reported on 0.5% of returns)
08090:
$24,400
New Jersey:
$24,511
(% of AGI for various income ranges: 1.5% for AGIs $25k-50k)
Total itemized deductions: $22,117 (21% of AGI, reported on 48.6% of returns)
Here:
$22,117
State:
$30,827
Here:
21.4% of AGI
State:
21.2% of AGI
(% of AGI for various income ranges: 13.5% for AGIs below $25k, 14.9% for AGIs $25k-50k, 17.8% for AGIs $50k-75k, 17.7% for AGIs $75k-100k, 17.5% for AGIs $100k-200k, 13.8% for AGIs over 200k)
Charity contributions: $2,308 (reported on 42.0% of returns)
Here:
$2,308
State:
$3,451
(% of AGI for various income ranges: 0.8% for AGIs below $25k, 1.3% for AGIs $25k-50k, 1.5% for AGIs $50k-75k, 1.6% for AGIs $75k-100k, 1.8% for AGIs $100k-200k, 1.0% for AGIs over 200k)
Taxes paid: $10,463 (reported on 48.6% of returns)
08090:
$10,463
State:
$15,801
(% of AGI for various income ranges: 4.3% for AGIs below $25k, 5.9% for AGIs $25k-50k, 7.3% for AGIs $50k-75k, 7.8% for AGIs $75k-100k, 8.5% for AGIs $100k-200k, 9.1% for AGIs over 200k)
Earned income credit: $1,836 (reported on 10.3% of returns)
Here:
$1,836
State:
$2,182
(% of AGI for various income ranges: 3.9% for AGIs below $25k, 0.6% for AGIs $25k-50k)
Percentage of individuals using paid preparers for their 2012 taxes: 53.8%
Here:
54%
State:
65%
(% for various income ranges: 46.5% for AGIs below $25k, 51.2% for AGIs $25k-50k, 52.2% for AGIs $50k-75k, 58.3% for AGIs $75k-100k, 64.7% for AGIs $100k-200k, 81.8% for AGIs over 200k)
Averages for the 2004 tax year for zip code 08090, filed in 2005:
Average Adjusted Gross Income (AGI) in 2004: $54,902 (Individual Income Tax Returns)
Here:
$54,902
State:
$64,921
Salary/wage: $49,678 (reported on 86.9% of returns)
Here:
$49,678
State:
$57,755
(% of AGI for various income ranges: 84.2% for AGIs below $10k, 69.4% for AGIs $10k-25k, 77.6% for AGIs $25k-50k, 85.5% for AGIs $50k-75k, 87.6% for AGIs $75k-100k, 71.7% for AGIs over 100k)
Taxable interest for individuals: $1,273 (reported on 48.6% of returns)
This zip code:
$1,273
New Jersey:
$2,068
(% of AGI for various income ranges: 3.8% for AGIs below $10k, 1.9% for AGIs $10k-25k, 1.7% for AGIs $25k-50k, 1.0% for AGIs $50k-75k, 0.7% for AGIs $75k-100k, 1.0% for AGIs over 100k)
Taxable dividends: $2,090 (reported on 26.5% of returns)
Here:
$2,090
State:
$3,959
(% of AGI for various income ranges: 2.6% for AGIs below $10k, 1.7% for AGIs $10k-25k, 1.2% for AGIs $25k-50k, 0.8% for AGIs $50k-75k, 0.6% for AGIs $75k-100k, 1.1% for AGIs over 100k)
Net capital gain/loss: +$9,599 (reported on 17.5% of returns)
Here:
+$9,599
State:
+$13,591
(% of AGI for various income ranges: -1.3% for AGIs below $10k, 0.8% for AGIs $10k-25k, 0.2% for AGIs $25k-50k, 0.6% for AGIs $50k-75k, 0.7% for AGIs $75k-100k, 7.4% for AGIs over 100k)
Profit/loss from business: +$12,559 (reported on 10.3% of returns)
Here:
+$12,559
State:
+$17,520
(% of AGI for various income ranges: 1.8% for AGIs below $10k, 3.4% for AGIs $10k-25k, 2.0% for AGIs $25k-50k, 1.7% for AGIs $50k-75k, 1.8% for AGIs $75k-100k, 3.0% for AGIs over 100k)
IRA payment deduction: $2,971 (reported on 2.5% of returns)
08090:
$2,971
New Jersey:
$3,270
(% of AGI for various income ranges: 0.3% for AGIs $25k-50k, 0.2% for AGIs $50k-75k, 0.1% for AGIs $75k-100k, 0.1% for AGIs over 100k)
Self-employed pension: $10,227 (reported on 0.5% of returns)
Here:
$10,227
New Jersey:
$17,258
Total itemized deductions: $18,377 (21% of AGI, reported on 48.7% of returns)
Here:
$18,377
State:
$23,924
Here:
21.3% of AGI
State:
21.1% of AGI
(% of AGI for various income ranges: 9.6% for AGIs below $10k, 12.3% for AGIs $10k-25k, 15.4% for AGIs $25k-50k, 19.0% for AGIs $50k-75k, 17.5% for AGIs $75k-100k, 15.4% for AGIs over 100k)
Charity contributions deductions: $2,286 (3% of AGI, reported on 45.0% of returns)
Here:
$2,286
State:
$3,242
Here:
2.6% of AGI
State:
2.7% of AGI
(% of AGI for various income ranges: 0.3% for AGIs below $10k, 1.1% for AGIs $10k-25k, 1.7% for AGIs $25k-50k, 2.2% for AGIs $50k-75k, 2.2% for AGIs $75k-100k, 1.8% for AGIs over 100k)
Total tax: $7,602 (reported on 81.9% of returns)
08090:
$7,602
State:
$12,321
(% of AGI for various income ranges: 1.9% for AGIs below $10k, 4.2% for AGIs $10k-25k, 7.3% for AGIs $25k-50k, 8.4% for AGIs $50k-75k, 10.0% for AGIs $75k-100k, 16.8% for AGIs over 100k)
Earned income credit: $1,503 (reported on 8.4% of returns)
Here:
$1,503
State:
$1,711
Percentage of individuals using paid preparers for their 2004 taxes: 55.7%
Here:
56%
State:
65%
(% for various income ranges: 43.1% for AGIs below $10k, 53.5% for AGIs $10k-25k, 55.6% for AGIs $25k-50k, 59.8% for AGIs $50k-75k, 59.5% for AGIs $75k-100k, 66.9% for AGIs over 100k)
Likely homosexual households (counted as self-reported same-sex unmarried-partner households)
Lesbian couples: 0.5% of all households
Gay men: 1.1% of all households
Household received Food Stamps/SNAP in the past 12 months: 182 Household did not receive Food Stamps/SNAP in the past 12 months: 2,962
Women who had a birth in the past 12 months: 68 (70 now married, 0 unmarried) Women who did not have a birth in the past 12 months: 2,238 (842 now married, 1,398 unmarried)
Housing units in zip code 08090 with a mortgage: 2,040 (215 second mortgage, 8 home equity loan, 183 both second mortgage and home equity loan) Houses without a mortgage: 221
Median monthly owner costs for units with a mortgage: $2,031 Median monthly owner costs for units without a mortgage: $927
Residents with income below the poverty level in 2022:
This zip code:
9.4%
Whole state:
9.7%
Residents with income below 50% of the poverty level in 2022:
This zip code:
7.9%
Whole state:
5.2%
Median number of rooms in houses and condos:
Here:
7.5
State:
6.8
Median number of rooms in apartments:
Here:
6.5
State:
3.9
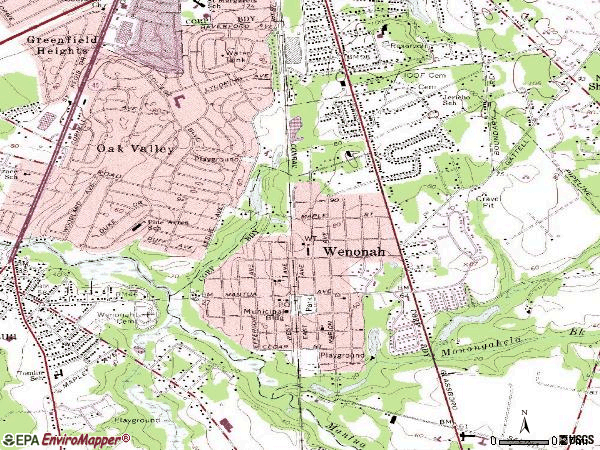
Notable locations in this zip code not listed on our city pages
Notable locations in zip code 08090: Deptford Fire District Battalion 1 Oak Valley Fire Company Princeton Boulevard Station (A), Wenonah Fire Department (B). Display/hide their locations on the map
In group quarters: 25 (-1 institutionalized population)
Size of family households: 820 2-persons, 563 3-persons, 714 4-persons, 229 5-persons, 127 6-persons, 50 7-or-more-persons
Size of nonfamily households: 497 1-person, 123 2-persons, 21 3-persons
1,214 married couples with children.
1,204 single-parent households (394 men, 810 women).
92.0% of residents of 08090 zip code speak English at home.
2.2% of residents speak Spanish at home (61% very well, 26% well, 13% not well).
1.5% of residents speak other Indo-European language at home (74% very well, 17% well, 10% not well).
3.2% of residents speak Asian or Pacific Island language at home (40% very well, 60% well).
0.5% of residents speak other language at home (100% very well).
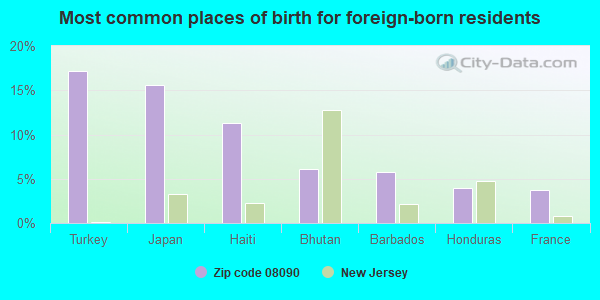
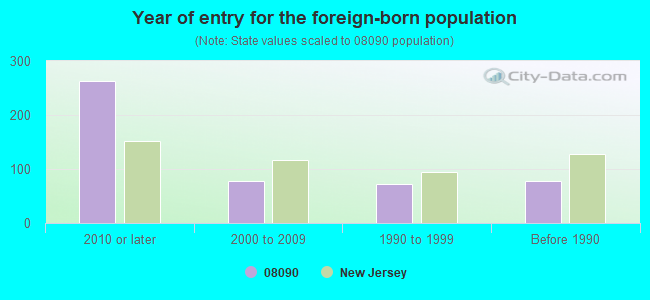
Foreign born population: 378 (3.8%) (51.5% of them are naturalized citizens)
This zip code:
3.8%
Whole state:
23.5%
17%Turkey
16%Japan
11%Haiti
6%Bhutan
6%Barbados
4%Honduras
4%France
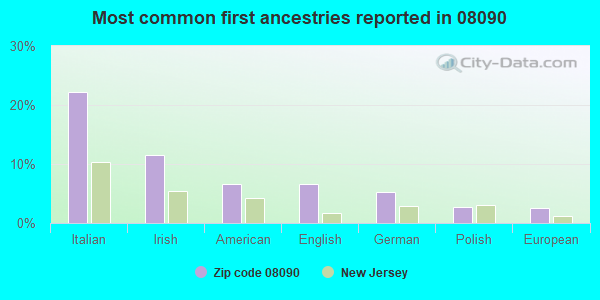
22%Italian
12%Irish
7%American
7%English
5%German
3%Polish
3%European
Year of entry for the foreign-born population
2632010 or later
782000 to 2009
731990 to 1999
77Before 1990
Facilities with environmental interests located in this zip code:
NEWTON TOOL & MFG CO (GLASSBORO RD in WENONAH, NJ)
STATE MASTER (New Jersey environmental info) - NJEMS-G000002737, STATE CLEANUP SITE, NJEMS-NJX000305789, HAZARDOUS WASTE PROGRAM (Resource Conservation and Recovery Act (tracking hazardous waste)) Business NAICS classification: SPECIAL DIE AND TOOL, DIE SET, JIG, AND FIXTURE MANUFACTURING. Alternative names: NEWTON TOOL/MFG.CO.
OAK VALLEY (525 COLLEGE BLVD in WENONAH, NJ)
(National Center for Education Statistics) - STATE ID-120 Organizations: DEPTFORD TWP (SCHOOL DISTRICT)
PINE ACRES (720 PURDUE AVE in WENONAH, NJ)
(National Center for Education Statistics) - STATE ID-130 Organizations: DEPTFORD TWP (SCHOOL DISTRICT)
Housing units lacking complete plumbing facilities: 1.4% Housing units lacking complete kitchen facilities: 1.1%
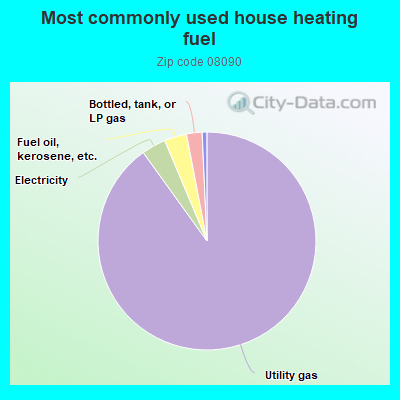
89.7%Utility gas
3.6%Electricity
3.3%Fuel oil, kerosene, etc.
2.3%Bottled, tank, or LP gas
0.7%No fuel used
Population in 1990: 9,129.
Place of birth for U.S.-born residents:
This state: 5,948
Northeast: 2,870
Midwest: 164
South: 284
West: 116
76% of the 08090 zip code residents lived in the same house 5 years ago. Out of people who lived in different houses, 59% lived in this county. Out of people who lived in different counties, 50% lived in New Jersey.
92% of the 08090 zip code residents lived in the same house 1 year ago. Out of people who lived in different houses, 42% moved from this county. Out of people who lived in different houses, 26% moved from different county within same state. Out of people who lived in different houses, 24% moved from different state. Out of people who lived in different houses, 10% moved from abroad.
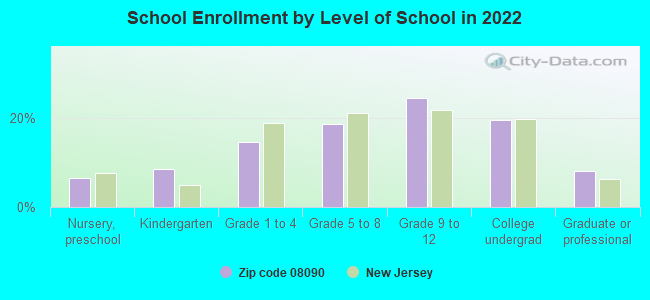
Private vs. public school enrollment:
Students in private schools in grades 1 to 8 (elementary and middle school): 65
Here:
9.0%
New Jersey:
12.3%
Students in private schools in grades 9 to 12 (high school): 108
Here:
20.3%
New Jersey:
13.1%
Students in private undergraduate colleges: 105
Here:
24.9%
New Jersey:
33.2%
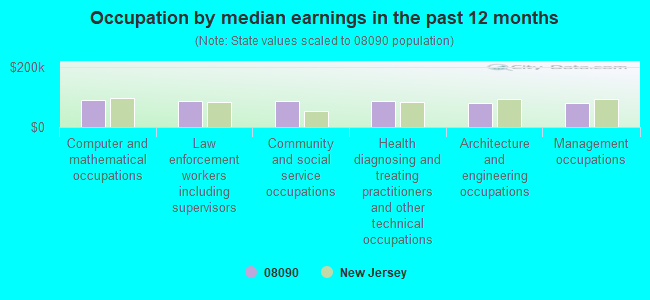
Occupation by median earnings in the past 12 months ($)
90,816Computer and mathematical occupations
86,599Law enforcement workers including supervisors
85,813Community and social service occupations
85,559Health diagnosing and treating practitioners and other technical occupations
80,333Architecture and engineering occupations
78,830Management occupations
Top industries in this zip code by the number of employees in 2005:
Administrative and Support and Waste Management and Remediation Services: Temporary Help Services (100-249 employees: 1 establishment, 50-99 employees: 1 establishment)
Other Services (except Public Administration): Beauty Salons (10-19: 4, 5-9: 2)
Health Care and Social Assistance: Offices of Physicians (except Mental Health Specialists) (20-49: 2)
Accommodation and Food Services: Full-Service Restaurants (20-49: 1, 5-9: 1)
Wholesale Trade: Sporting and Recreational Goods and Supplies Merchant Wholesalers (20-49: 1)
Educational Services: Exam Preparation and Tutoring (20-49: 1)
Construction: Other Building Equipment Contractors (20-49: 1)
Health Care and Social Assistance: Child Day Care Services (20-49: 1)
Health Care and Social Assistance: Offices of Dentists (10-19: 1, 5-9: 1)
People in group quarters in 2010:
28 people in nursing facilities/skilled-nursing facilities
5 people in group homes intended for adults
People in group quarters in 2000:
34 people in other noninstitutional group quarters
6 people in homes for the mentally retarded
Fatal accident statistics in 2014:
Fatal accident count: 1
Vehicles involved in fatal accidents: 1
Fatal accidents caused by drunken drivers: 1
Fatalities: 1
Persons involved in fatal accidents: 1
Pedestrians involved in fatal accidents: 1
Fatal accident statistics in 2010:
Fatal accident count: 1
Vehicles involved in fatal accidents: 2
Fatal accidents caused by drunken drivers: 0
Fatalities: 1
Persons involved in fatal accidents: 3
Pedestrians involved in fatal accidents: 0
Home Mortgage Disclosure Act Aggregated Statistics For Year 2009 (Based on 4 full and 2 partial tracts)
A) FHA, FSA/RHS & VA Home Purchase Loans
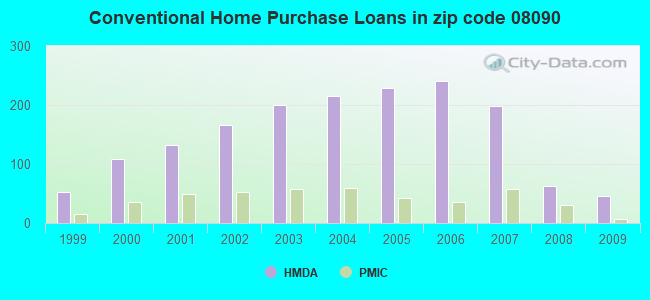
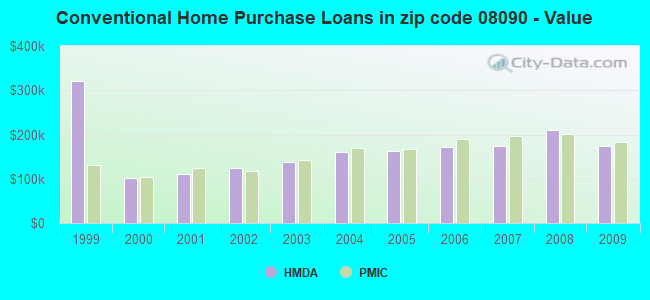
B) Conventional Home Purchase Loans
C) Refinancings
D) Home Improvement Loans
F) Non-occupant Loans on < 5 Family Dwellings (A B C & D)
Number
Average Value
Number
Average Value
Number
Average Value
Number
Average Value
Number
Average Value
LOANS ORIGINATED
55
$177,989
46
$174,895
419
$191,435
35
$61,630
10
$136,185
APPLICATIONS APPROVED, NOT ACCEPTED
0
$0
6
$424,363
38
$206,581
8
$45,105
0
$0
APPLICATIONS DENIED
4
$164,778
4
$251,715
196
$210,396
27
$81,344
4
$26,178
APPLICATIONS WITHDRAWN
6
$157,498
8
$178,225
106
$190,975
3
$47,843
2
$98,880
FILES CLOSED FOR INCOMPLETENESS
2
$243,595
0
$0
27
$200,431
4
$56,855
0
$0
Aggregated Statistics For Year 2008 (Based on 4 full and 2 partial tracts)
A) FHA, FSA/RHS & VA Home Purchase Loans
B) Conventional Home Purchase Loans
C) Refinancings
D) Home Improvement Loans
F) Non-occupant Loans on < 5 Family Dwellings (A B C & D)
Number
Average Value
Number
Average Value
Number
Average Value
Number
Average Value
Number
Average Value
LOANS ORIGINATED
39
$202,191
62
$211,094
299
$174,986
60
$74,739
13
$176,568
APPLICATIONS APPROVED, NOT ACCEPTED
10
$189,289
9
$148,282
44
$176,832
16
$49,038
2
$16,810
APPLICATIONS DENIED
4
$174,522
24
$242,057
162
$180,550
70
$44,548
20
$93,042
APPLICATIONS WITHDRAWN
12
$182,861
16
$226,493
83
$184,778
0
$0
8
$163,099
FILES CLOSED FOR INCOMPLETENESS
2
$155,240
6
$202,413
23
$243,891
3
$71,527
2
$209,570
Aggregated Statistics For Year 2007 (Based on 4 full and 2 partial tracts)
A) FHA, FSA/RHS & VA Home Purchase Loans
B) Conventional Home Purchase Loans
C) Refinancings
D) Home Improvement Loans
E) Loans on Dwellings For 5+ Families
F) Non-occupant Loans on < 5 Family Dwellings (A B C & D)
Number
Average Value
Number
Average Value
Number
Average Value
Number
Average Value
Number
Average Value
Number
Average Value
LOANS ORIGINATED
21
$183,100
199
$174,270
402
$154,611
176
$44,158
2
$433,830
31
$132,770
APPLICATIONS APPROVED, NOT ACCEPTED
2
$181,940
29
$150,608
88
$170,539
26
$33,363
0
$0
10
$177,783
APPLICATIONS DENIED
0
$0
24
$192,801
230
$165,669
86
$32,531
0
$0
19
$61,211
APPLICATIONS WITHDRAWN
2
$194,795
16
$178,749
130
$176,940
21
$95,469
0
$0
0
$0
FILES CLOSED FOR INCOMPLETENESS
0
$0
8
$215,540
61
$194,847
0
$0
0
$0
4
$181,445
Aggregated Statistics For Year 2006 (Based on 4 full and 2 partial tracts)
A) FHA, FSA/RHS & VA Home Purchase Loans
B) Conventional Home Purchase Loans
C) Refinancings
D) Home Improvement Loans
F) Non-occupant Loans on < 5 Family Dwellings (A B C & D)
G) Loans On Manufactured Home Dwelling (A B C & D)
Number
Average Value
Number
Average Value
Number
Average Value
Number
Average Value
Number
Average Value
Number
Average Value
LOANS ORIGINATED
24
$192,576
241
$171,121
583
$140,614
171
$51,017
36
$155,554
2
$78,345
APPLICATIONS APPROVED, NOT ACCEPTED
0
$0
25
$120,579
92
$153,726
38
$47,772
2
$143,520
2
$49,440
APPLICATIONS DENIED
0
$0
32
$189,490
243
$161,203
110
$40,698
13
$36,211
4
$16,315
APPLICATIONS WITHDRAWN
3
$138,590
20
$137,476
218
$165,484
15
$49,773
5
$70,340
0
$0
FILES CLOSED FOR INCOMPLETENESS
0
$0
3
$462,267
70
$179,040
2
$98,880
0
$0
0
$0
Aggregated Statistics For Year 2005 (Based on 4 full and 2 partial tracts)
A) FHA, FSA/RHS & VA Home Purchase Loans
B) Conventional Home Purchase Loans
C) Refinancings
D) Home Improvement Loans
E) Loans on Dwellings For 5+ Families
F) Non-occupant Loans on < 5 Family Dwellings (A B C & D)
G) Loans On Manufactured Home Dwelling (A B C & D)
Number
Average Value
Number
Average Value
Number
Average Value
Number
Average Value
Number
Average Value
Number
Average Value
Number
Average Value
LOANS ORIGINATED
13
$170,093
229
$162,431
566
$133,194
163
$46,995
4
$1,313,870
32
$144,333
0
$0
APPLICATIONS APPROVED, NOT ACCEPTED
0
$0
15
$156,754
91
$126,385
26
$71,296
0
$0
4
$135,098
2
$14,830
APPLICATIONS DENIED
2
$153,125
19
$163,577
198
$152,716
125
$48,971
0
$0
6
$1,990
0
$0
APPLICATIONS WITHDRAWN
3
$220,093
29
$181,702
204
$142,974
20
$130,897
0
$0
7
$146,297
0
$0
FILES CLOSED FOR INCOMPLETENESS
4
$192,012
6
$245,842
31
$156,010
2
$67,285
0
$0
2
$51,420
0
$0
Aggregated Statistics For Year 2004 (Based on 4 full and 2 partial tracts)
A) FHA, FSA/RHS & VA Home Purchase Loans
B) Conventional Home Purchase Loans
C) Refinancings
D) Home Improvement Loans
E) Loans on Dwellings For 5+ Families
F) Non-occupant Loans on < 5 Family Dwellings (A B C & D)
G) Loans On Manufactured Home Dwelling (A B C & D)
Number
Average Value
Number
Average Value
Number
Average Value
Number
Average Value
Number
Average Value
Number
Average Value
Number
Average Value
LOANS ORIGINATED
27
$152,556
215
$159,368
535
$124,278
160
$45,779
2
$115,690
32
$137,812
2
$23,825
APPLICATIONS APPROVED, NOT ACCEPTED
12
$27,286
27
$130,259
97
$100,258
45
$48,360
0
$0
12
$30,937
0
$0
APPLICATIONS DENIED
2
$143,485
18
$87,925
282
$110,557
116
$33,528
0
$0
25
$49,952
8
$75,396
APPLICATIONS WITHDRAWN
2
$135,365
29
$163,719
234
$126,877
13
$53,594
0
$0
4
$140,410
0
$0
FILES CLOSED FOR INCOMPLETENESS
0
$0
6
$121,115
19
$151,989
4
$125,082
0
$0
2
$138,430
0
$0
Aggregated Statistics For Year 2003 (Based on 4 full and 2 partial tracts)
A) FHA, FSA/RHS & VA Home Purchase Loans
B) Conventional Home Purchase Loans
C) Refinancings
D) Home Improvement Loans
E) Loans on Dwellings For 5+ Families
F) Non-occupant Loans on < 5 Family Dwellings (A B C & D)
Number
Average Value
Number
Average Value
Number
Average Value
Number
Average Value
Number
Average Value
Number
Average Value
LOANS ORIGINATED
35
$128,364
200
$138,338
983
$107,225
104
$37,103
2
$296,640
21
$107,747
APPLICATIONS APPROVED, NOT ACCEPTED
0
$0
22
$150,491
144
$107,183
38
$30,692
0
$0
2
$115,690
APPLICATIONS DENIED
2
$162,660
10
$138,985
307
$101,157
69
$18,194
0
$0
3
$21,733
APPLICATIONS WITHDRAWN
3
$139,947
17
$85,811
247
$112,506
16
$31,554
0
$0
8
$80,596
FILES CLOSED FOR INCOMPLETENESS
0
$0
4
$91,925
19
$133,303
2
$36,235
0
$0
2
$138,430
Aggregated Statistics For Year 2002 (Based on 4 full and 2 partial tracts)
A) FHA, FSA/RHS & VA Home Purchase Loans
B) Conventional Home Purchase Loans
C) Refinancings
D) Home Improvement Loans
F) Non-occupant Loans on < 5 Family Dwellings (A B C & D)
Number
Average Value
Number
Average Value
Number
Average Value
Number
Average Value
Number
Average Value
LOANS ORIGINATED
49
$118,922
166
$123,169
527
$112,254
118
$28,869
16
$129,375
APPLICATIONS APPROVED, NOT ACCEPTED
2
$44,505
10
$112,742
69
$98,086
36
$29,414
2
$69,425
APPLICATIONS DENIED
4
$145,878
15
$90,279
205
$92,417
85
$16,426
14
$66,393
APPLICATIONS WITHDRAWN
0
$0
13
$78,848
207
$96,457
8
$45,865
4
$87,612
FILES CLOSED FOR INCOMPLETENESS
0
$0
4
$120,555
28
$145,238
6
$41,193
0
$0
Aggregated Statistics For Year 2001 (Based on 4 full and 2 partial tracts)
A) FHA, FSA/RHS & VA Home Purchase Loans
B) Conventional Home Purchase Loans
C) Refinancings
D) Home Improvement Loans
F) Non-occupant Loans on < 5 Family Dwellings (A B C & D)
Number
Average Value
Number
Average Value
Number
Average Value
Number
Average Value
Number
Average Value
LOANS ORIGINATED
81
$101,206
133
$109,652
349
$95,296
129
$26,486
11
$71,895
APPLICATIONS APPROVED, NOT ACCEPTED
0
$0
10
$68,165
58
$92,094
37
$24,504
2
$76,255
APPLICATIONS DENIED
2
$133,605
17
$103,522
181
$68,004
71
$11,734
5
$46,340
APPLICATIONS WITHDRAWN
10
$92,636
22
$116,200
121
$86,443
29
$21,518
4
$135,142
FILES CLOSED FOR INCOMPLETENESS
0
$0
4
$94,038
27
$112,713
4
$20,610
0
$0
Aggregated Statistics For Year 2000 (Based on 4 full and 2 partial tracts)
A) FHA, FSA/RHS & VA Home Purchase Loans
B) Conventional Home Purchase Loans
C) Refinancings
D) Home Improvement Loans
F) Non-occupant Loans on < 5 Family Dwellings (A B C & D)
Number
Average Value
Number
Average Value
Number
Average Value
Number
Average Value
Number
Average Value
LOANS ORIGINATED
52
$102,802
109
$102,715
135
$68,567
118
$23,948
6
$59,225
APPLICATIONS APPROVED, NOT ACCEPTED
4
$133,655
6
$74,733
44
$67,654
52
$18,157
3
$67,533
APPLICATIONS DENIED
0
$0
8
$81,045
159
$59,455
74
$27,169
5
$41,618
APPLICATIONS WITHDRAWN
6
$97,892
11
$94,614
90
$81,718
13
$30,368
6
$82,108
FILES CLOSED FOR INCOMPLETENESS
2
$76,385
0
$0
28
$84,622
4
$7,910
0
$0
Aggregated Statistics For Year 1999 (Based on 2 full and 1 partial tracts)
A) FHA, FSA/RHS & VA Home Purchase Loans
B) Conventional Home Purchase Loans
C) Refinancings
D) Home Improvement Loans
E) Loans on Dwellings For 5+ Families
F) Non-occupant Loans on < 5 Family Dwellings (A B C & D)
2002 - 2018 National Fire Incident Reporting System (NFIRS) incidents
According to the data from the years 2002 - 2018 the average number of fire incidents per year is 26. The highest number of reported fires - 43 took place in 2008, and the least - 4 in 2002. The data has a rising trend.
When looking into fire subcategories, the most reports belonged to: Structure Fires (37.0%), and Outside Fires (32.5%).
Fire incident types reported to NFIRS in Zip Code 08090


 Nearest zip codes: 08097, 08051, 08096, 08080, 08061, 08093.


 According to the data from the years 2002 - 2018 the average number of fire incidents per year is 26. The highest number of reported fires - 43 took place in 2008, and the least - 4 in 2002. The data has a rising trend.
 When looking into fire subcategories, the most reports belonged to: Structure Fires (37.0%), and Outside Fires (32.5%).