Estimated zip code population in 2022: 6,961 Zip code population in 2010: 7,092 Zip code population in 2000: 7,172
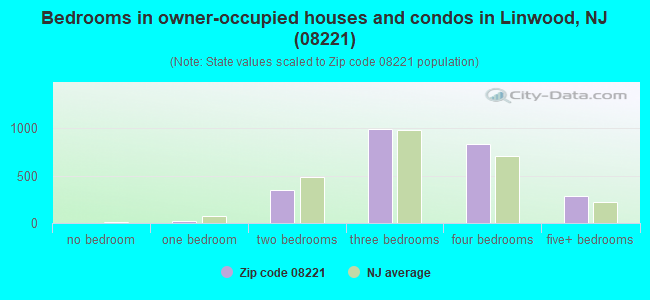
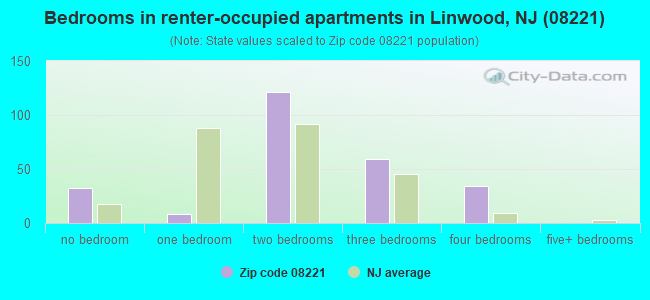
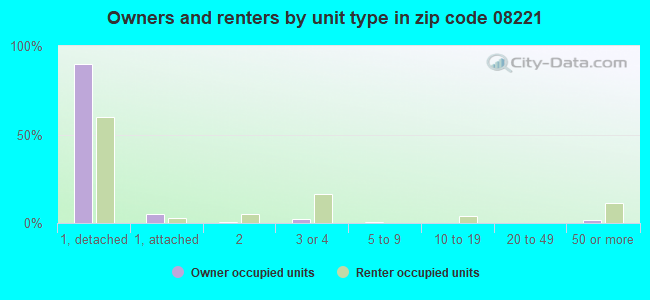
Houses and condos: 2,909 Renter-occupied apartments: 261
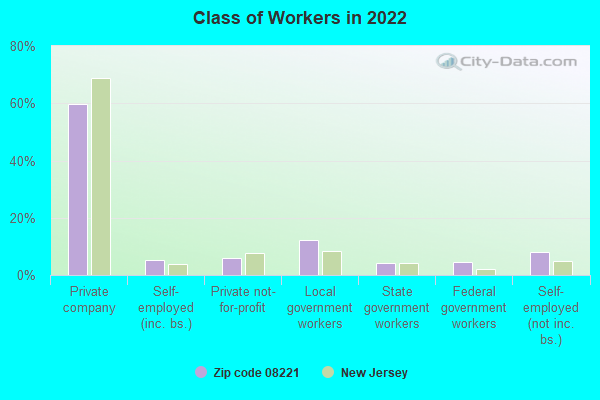
% of renters here:
10%
State:
35%
March 2022 cost of living index in zip code 08221: 102.9 (near average, U.S. average is 100)
Land area: 3.9 sq. mi. Water area: 0.4 sq. mi.
Population density: 1,787 people per square mile
(low).
OSM Map
Google Map
MSN Map
OSM Map
General Map
Google Map
MSN Map
OSM Map
Google Map
MSN Map
OSM Map
Google Map
MSN Map
Please wait while loading the map...
Real estate property taxes paid for housing units in 2022:
This zip code:
2.6% ($9,309)
New Jersey:
2.1% ($8,897)
Median real estate property taxes paid for housing units with mortgages in 2022: $9,460 (2.5%) Median real estate property taxes paid for housing units with no mortgage in 2022: $9,015 (2.8%)
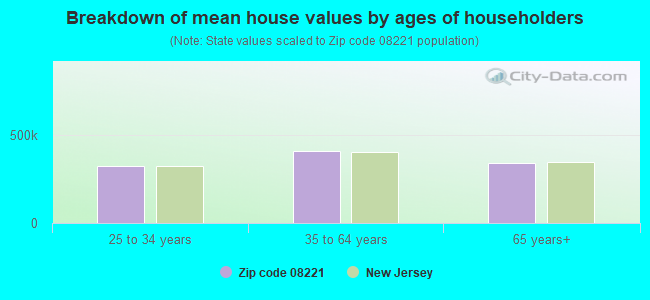
Estimated median house/condo value in 2022: $361,904
08221:
$361,904
New Jersey:
$428,900
According to our research of New Jersey and other state lists, there were 2 registered sex offenders living in 08221 zip code as of April 27, 2024. The ratio of all residents to sex offenders in zip code 08221 is 3,555 to 1. The ratio of registered sex offenders to all residents in this zip code is lower than the state average.
Median resident age:
This zip code:
48.7 years
New Jersey median age:
40.4 years
Average household size:
This zip code:
2.5 people
New Jersey:
2.6 people
Averages for the 2020 tax year for zip code 08221, filed in 2021:
Average Adjusted Gross Income (AGI) in 2020: $116,932 (Individual Income Tax Returns)
Here:
$116,932
State:
$95,247
Salary/wage: $89,422 (reported on 77.8% of returns)
Here:
$89,422
State:
$80,635
(% of AGI for various income ranges: 1261.9% for AGIs below $25k, 3665.1% for AGIs $25k-50k, 6023.4% for AGIs $50k-75k, 9343.6% for AGIs $75k-100k, 19648.1% for AGIs $100k-200k, 86842.7% for AGIs over 200k)
Taxable interest for individuals: $2,337 (reported on 43.3% of returns)
This zip code:
$2,337
New Jersey:
$2,414
(% of AGI for various income ranges: 34.2% for AGIs below $25k, 66.0% for AGIs $25k-50k, 73.8% for AGIs $50k-75k, 132.3% for AGIs $75k-100k, 198.3% for AGIs $100k-200k, 1424.0% for AGIs over 200k)
Ordinary dividends: $8,653 (reported on 38.0% of returns)
Here:
$8,653
State:
$8,057
(% of AGI for various income ranges: 108.1% for AGIs below $25k, 150.9% for AGIs $25k-50k, 211.6% for AGIs $50k-75k, 315.0% for AGIs $75k-100k, 636.7% for AGIs $100k-200k, 5023.3% for AGIs over 200k)
Net capital gain/loss in AGI: +$20,729 (reported on 34.5% of returns)
Here:
+$20,729
State:
+$25,022
(% of AGI for various income ranges: 25.2% for AGIs below $25k, 92.6% for AGIs $25k-50k, 219.1% for AGIs $50k-75k, 177.3% for AGIs $75k-100k, 720.0% for AGIs $100k-200k, 15068.0% for AGIs over 200k)
Profit/loss from business: +$40,488 (reported on 19.8% of returns)
Here:
+$40,488
State:
+$18,035
(% of AGI for various income ranges: 112.7% for AGIs below $25k, 243.4% for AGIs $25k-50k, 559.1% for AGIs $50k-75k, 854.1% for AGIs $75k-100k, 1421.7% for AGIs $100k-200k, 13158.0% for AGIs over 200k)
Taxable individual retirement arrangement distribution: $18,227 (reported on 13.1% of returns)
08221:
$18,227
New Jersey:
$21,558
(% of AGI for various income ranges: 101.0% for AGIs below $25k, 303.1% for AGIs $25k-50k, 370.6% for AGIs $50k-75k, 566.4% for AGIs $75k-100k, 808.6% for AGIs $100k-200k, 1334.7% for AGIs over 200k)
Self-employed (Keogh) retirement plans: $36,627 (reported on 2.9% of returns)
08221:
$36,627
New Jersey:
$30,844
(% of AGI for various income ranges: 213.6% for AGIs $100k-200k, 2173.3% for AGIs over 200k)
Total itemized deductions: $30,902 (reported on 17.6% of returns)
Here:
$30,902
State:
$32,863
(% of AGI for various income ranges: 218.7% for AGIs below $25k, 537.1% for AGIs $25k-50k, 777.2% for AGIs $50k-75k, 915.5% for AGIs $75k-100k, 1205.3% for AGIs $100k-200k, 5692.0% for AGIs over 200k)
Charity contributions: $8,325 (reported on 15.2% of returns)
Here:
$8,325
State:
$7,880
(% of AGI for various income ranges: 6.0% for AGIs below $25k, 59.7% for AGIs $25k-50k, 71.9% for AGIs $50k-75k, 122.7% for AGIs $75k-100k, 220.8% for AGIs $100k-200k, 2140.0% for AGIs over 200k)
Taxes paid: $8,951 (reported on 17.4% of returns)
08221:
$8,951
State:
$9,183
(% of AGI for various income ranges: 57.9% for AGIs below $25k, 149.7% for AGIs $25k-50k, 264.4% for AGIs $50k-75k, 356.4% for AGIs $75k-100k, 400.3% for AGIs $100k-200k, 1281.3% for AGIs over 200k)
Earned income credit: $1,670 (reported on 6.1% of returns)
Here:
$1,670
State:
$2,148
(% of AGI for various income ranges: 44.0% for AGIs below $25k, 44.3% for AGIs $25k-50k)
Percentage of individuals using paid preparers for their 2020 taxes: 93.3%
Here:
93%
State:
92%
(% for various income ranges: 92.1% for AGIs below $25k, 93.2% for AGIs $25k-50k, 92.3% for AGIs $50k-75k, 92.1% for AGIs $75k-100k, 94.6% for AGIs $100k-200k, 96.0% for AGIs over 200k)
Averages for the 2012 tax year for zip code 08221, filed in 2013:
Average Adjusted Gross Income (AGI) in 2012: $111,528 (Individual Income Tax Returns)
Here:
$111,528
State:
$79,688
Salary/wage: $79,953 (reported on 78.4% of returns)
Here:
$79,953
State:
$68,122
(% of AGI for various income ranges: 68.1% for AGIs below $25k, 64.1% for AGIs $25k-50k, 60.9% for AGIs $50k-75k, 67.2% for AGIs $75k-100k, 67.9% for AGIs $100k-200k, 48.4% for AGIs over 200k)
Taxable interest for individuals: $3,277 (reported on 49.0% of returns)
This zip code:
$3,277
New Jersey:
$2,193
(% of AGI for various income ranges: 2.8% for AGIs below $25k, 1.7% for AGIs $25k-50k, 1.2% for AGIs $50k-75k, 1.1% for AGIs $75k-100k, 0.9% for AGIs $100k-200k, 1.6% for AGIs over 200k)
Ordinary dividends: $10,230 (reported on 38.9% of returns)
Here:
$10,230
State:
$6,828
(% of AGI for various income ranges: 5.6% for AGIs below $25k, 3.7% for AGIs $25k-50k, 2.4% for AGIs $50k-75k, 2.5% for AGIs $75k-100k, 2.5% for AGIs $100k-200k, 4.1% for AGIs over 200k)
Net capital gain/loss in AGI: +$18,840 (reported on 32.7% of returns)
Here:
+$18,840
State:
+$15,358
(% of AGI for various income ranges: 0.3% for AGIs $25k-50k, 1.0% for AGIs $75k-100k, 1.5% for AGIs $100k-200k, 9.1% for AGIs over 200k)
Profit/loss from business: +$40,265 (reported on 18.3% of returns)
Here:
+$40,265
State:
+$19,577
(% of AGI for various income ranges: 6.3% for AGIs below $25k, 6.8% for AGIs $25k-50k, 7.2% for AGIs $50k-75k, 5.1% for AGIs $75k-100k, 5.3% for AGIs $100k-200k, 7.2% for AGIs over 200k)
Taxable individual retirement arrangement distribution: $17,198 (reported on 14.9% of returns)
08221:
$17,198
New Jersey:
$18,214
(% of AGI for various income ranges: 6.4% for AGIs below $25k, 4.4% for AGIs $25k-50k, 4.4% for AGIs $50k-75k, 3.7% for AGIs $75k-100k, 3.3% for AGIs $100k-200k, 1.1% for AGIs over 200k)
Self-employment retirement plans: $31,775 (reported on 3.1% of returns)
08221:
$31,775
New Jersey:
$24,511
Total itemized deductions: $36,240 (19% of AGI, reported on 53.4% of returns)
Here:
$36,240
State:
$30,827
Here:
19.4% of AGI
State:
21.2% of AGI
(% of AGI for various income ranges: 25.3% for AGIs below $25k, 23.4% for AGIs $25k-50k, 20.9% for AGIs $50k-75k, 20.2% for AGIs $75k-100k, 19.7% for AGIs $100k-200k, 14.7% for AGIs over 200k)
Charity contributions: $3,987 (reported on 46.6% of returns)
Here:
$3,987
State:
$3,451
(% of AGI for various income ranges: 1.2% for AGIs below $25k, 1.5% for AGIs $25k-50k, 1.8% for AGIs $50k-75k, 1.3% for AGIs $75k-100k, 1.6% for AGIs $100k-200k, 1.7% for AGIs over 200k)
Taxes paid: $19,402 (reported on 53.1% of returns)
08221:
$19,402
State:
$15,801
(% of AGI for various income ranges: 9.1% for AGIs below $25k, 9.5% for AGIs $25k-50k, 9.0% for AGIs $50k-75k, 9.2% for AGIs $75k-100k, 10.1% for AGIs $100k-200k, 9.0% for AGIs over 200k)
Earned income credit: $1,444 (reported on 8.2% of returns)
Here:
$1,444
State:
$2,182
(% of AGI for various income ranges: 2.6% for AGIs below $25k, 0.5% for AGIs $25k-50k)
Percentage of individuals using paid preparers for their 2012 taxes: 69.6%
Here:
70%
State:
65%
(% for various income ranges: 61.6% for AGIs below $25k, 67.2% for AGIs $25k-50k, 73.9% for AGIs $50k-75k, 70.3% for AGIs $75k-100k, 73.8% for AGIs $100k-200k, 87.8% for AGIs over 200k)
Averages for the 2004 tax year for zip code 08221, filed in 2005:
Average Adjusted Gross Income (AGI) in 2004: $92,193 (Individual Income Tax Returns)
Here:
$92,193
State:
$64,921
Salary/wage: $71,970 (reported on 78.3% of returns)
Here:
$71,970
State:
$57,755
(% of AGI for various income ranges: 90.2% for AGIs below $10k, 61.6% for AGIs $10k-25k, 68.4% for AGIs $25k-50k, 64.5% for AGIs $50k-75k, 73.2% for AGIs $75k-100k, 58.1% for AGIs over 100k)
Taxable interest for individuals: $2,741 (reported on 67.9% of returns)
This zip code:
$2,741
New Jersey:
$2,068
(% of AGI for various income ranges: 10.9% for AGIs below $10k, 4.9% for AGIs $10k-25k, 3.1% for AGIs $25k-50k, 2.2% for AGIs $50k-75k, 1.9% for AGIs $75k-100k, 1.7% for AGIs over 100k)
Taxable dividends: $4,823 (reported on 51.1% of returns)
Here:
$4,823
State:
$3,959
(% of AGI for various income ranges: 11.5% for AGIs below $10k, 4.8% for AGIs $10k-25k, 3.7% for AGIs $25k-50k, 2.5% for AGIs $50k-75k, 1.6% for AGIs $75k-100k, 2.6% for AGIs over 100k)
Net capital gain/loss: +$15,479 (reported on 43.1% of returns)
Here:
+$15,479
State:
+$13,591
(% of AGI for various income ranges: -7.6% for AGIs below $10k, -1.1% for AGIs $10k-25k, 1.2% for AGIs $25k-50k, 0.9% for AGIs $50k-75k, 1.9% for AGIs $75k-100k, 9.8% for AGIs over 100k)
Profit/loss from business: +$38,992 (reported on 17.1% of returns)
Here:
+$38,992
State:
+$17,520
(% of AGI for various income ranges: 8.1% for AGIs below $10k, 6.4% for AGIs $10k-25k, 5.1% for AGIs $25k-50k, 5.5% for AGIs $50k-75k, 4.6% for AGIs $75k-100k, 8.0% for AGIs over 100k)
IRA payment deduction: $3,723 (reported on 4.5% of returns)
08221:
$3,723
New Jersey:
$3,270
(% of AGI for various income ranges: 0.5% for AGIs $10k-25k, 0.3% for AGIs $25k-50k, 0.4% for AGIs $50k-75k, 0.2% for AGIs $75k-100k, 0.1% for AGIs over 100k)
Self-employed pension: $19,675 (reported on 3.2% of returns)
Here:
$19,675
New Jersey:
$17,258
Total itemized deductions: $28,053 (19% of AGI, reported on 56.1% of returns)
Here:
$28,053
State:
$23,924
Here:
19.0% of AGI
State:
21.1% of AGI
(% of AGI for various income ranges: 27.1% for AGIs below $10k, 23.2% for AGIs $10k-25k, 24.3% for AGIs $25k-50k, 22.4% for AGIs $50k-75k, 20.6% for AGIs $75k-100k, 14.9% for AGIs over 100k)
Charity contributions deductions: $3,512 (2% of AGI, reported on 52.7% of returns)
Here:
$3,512
State:
$3,242
Here:
2.3% of AGI
State:
2.7% of AGI
(% of AGI for various income ranges: 1.0% for AGIs below $10k, 1.8% for AGIs $10k-25k, 2.0% for AGIs $25k-50k, 2.4% for AGIs $50k-75k, 2.0% for AGIs $75k-100k, 2.0% for AGIs over 100k)
Total tax: $20,986 (reported on 79.0% of returns)
08221:
$20,986
State:
$12,321
(% of AGI for various income ranges: 3.0% for AGIs below $10k, 4.5% for AGIs $10k-25k, 7.4% for AGIs $25k-50k, 9.0% for AGIs $50k-75k, 10.1% for AGIs $75k-100k, 21.8% for AGIs over 100k)
Earned income credit: $1,605 (reported on 4.6% of returns)
Here:
$1,605
State:
$1,711
Percentage of individuals using paid preparers for their 2004 taxes: 71.7%
Here:
72%
State:
65%
(% for various income ranges: 68.2% for AGIs below $10k, 66.3% for AGIs $10k-25k, 70.6% for AGIs $25k-50k, 70.5% for AGIs $50k-75k, 71.4% for AGIs $75k-100k, 80.3% for AGIs over 100k)
Likely homosexual households (counted as self-reported same-sex unmarried-partner households)
Lesbian couples: 0.0% of all households
Gay men: 0.2% of all households
Household received Food Stamps/SNAP in the past 12 months: 76 Household did not receive Food Stamps/SNAP in the past 12 months: 2,616
Women who had a birth in the past 12 months: 101 (103 now married, 0 unmarried) Women who did not have a birth in the past 12 months: 1,102 (568 now married, 531 unmarried)
Housing units in zip code 08221 with a mortgage: 1,596 (206 second mortgage, 13 home equity loan, 178 both second mortgage and home equity loan) Houses without a mortgage: 22
Median monthly owner costs for units with a mortgage: $2,612 Median monthly owner costs for units without a mortgage: $1,260
Residents with income below the poverty level in 2022:
This zip code:
2.9%
Whole state:
9.7%
Residents with income below 50% of the poverty level in 2022:
This zip code:
0.6%
Whole state:
5.2%
Median number of rooms in houses and condos:
Here:
7.4
State:
6.8
Median number of rooms in apartments:
Here:
4.7
State:
3.9
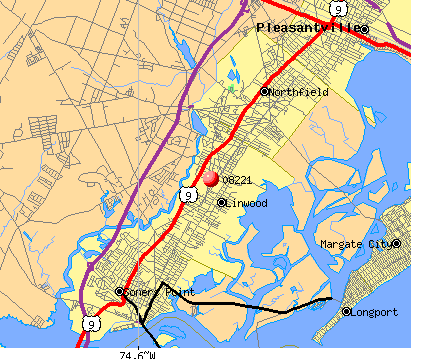
Notable locations in this zip code not listed on our city pages
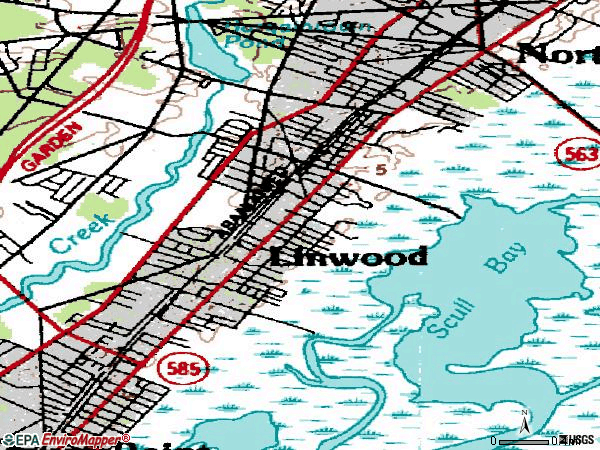
Notable locations in zip code 08221: Linwood Country Club (A), Linwood Station (B), Linwood Rescue Squad (C), Linwood Volunteer Fire Company 1 (D). Display/hide their locations on the map
1,184 married couples with children.
141 single-parent households (50 men, 91 women).
87.4% of residents of 08221 zip code speak English at home.
4.9% of residents speak Spanish at home (51% very well, 28% well, 18% not well, 2% not at all).
4.4% of residents speak other Indo-European language at home (78% very well, 15% well, 7% not well, 1% not at all).
2.2% of residents speak Asian or Pacific Island language at home (46% very well, 40% well, 12% not well, 1% not at all).
1.1% of residents speak other language at home (100% very well).
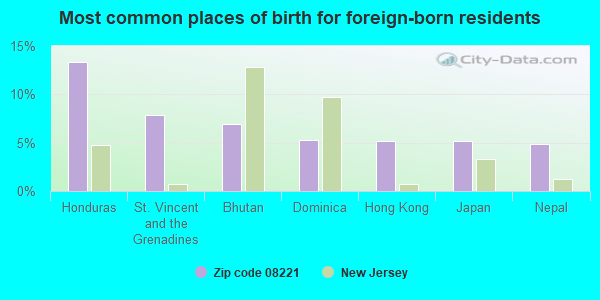
Foreign born population: 677 (9.7%) (71.8% of them are naturalized citizens)
This zip code:
9.7%
Whole state:
23.5%
13%Honduras
8%St. Vincent and the Grenadines
7%Bhutan
5%Dominica
5%Hong Kong
5%Japan
5%Nepal
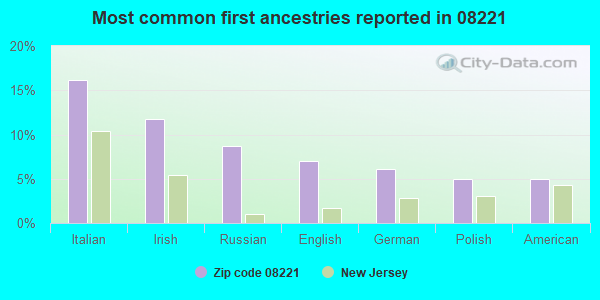
16%Italian
12%Irish
9%Russian
7%English
6%German
5%Polish
5%American
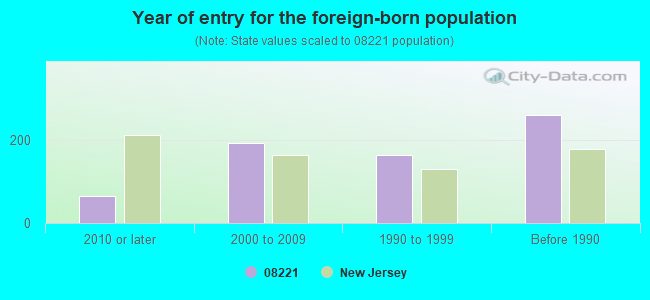
Year of entry for the foreign-born population
642010 or later
1922000 to 2009
1641990 to 1999
259Before 1990
Major facilities with environmental interests located in this zip code:
PRUDENTIAL INSURANCE CO @ CORNERSTONE COMMERCE CENTER (1201 NEW RD in LINWOOD, NJ)
STATE MASTER (New Jersey environmental info) - NJEMS-005844, STATE CLEANUP SITE, NJEMS-70226, AIR PROGRAM (Resource Conservation and Recovery Act (tracking hazardous waste)) Business SIC classification: ACCIDENT AND HEALTH INSURANCE Organizations: PRUDENTIAL INSURANCE CO OF AMERICA, CORNERSTONE COMMERCE CENTER LP (CONTACT/OWNER)
Alternative names: PRUDENTIAL - LINWOOD
HARBOR MEDICAL CENTER (149 OCEAN HEIGHTS AVE in EGG HARBOR, NJ)
STATE MASTER (New Jersey environmental info) - NJEMS-024678, STATE CLEANUP SITE (Resource Conservation and Recovery Act (tracking hazardous waste)) Organizations: LEONARD & FAYE TIERNO (CONTACT/OPERATOR)
, ATKINSON BRIAN DR (CONTACT/OWNER)
NJ AMERICAN WATER CO (700 NEW RD in LINWOOD, NJ)
STATE MASTER (New Jersey environmental info) - NJEMS-00000012722, EPCRA, NJEMS-71102100077, NJEMS-71102100097, (Resource Conservation and Recovery Act (tracking hazardous waste)) Business SIC classification: WATER SUPPLY
NEWCO WASTE SYSTEMS OF NJ PINELANDS PARK SLF (MOUNT AIRY AVENUE in EGG HARBOR TWP, NJ)
CRITERIA AND HAZARDOUS AIR POLLUTANT INVENTORY (Inventory of air pollution sources) STATE MASTER (New Jersey environmental info) - NJEMS-131815, REFUSE DISPOSAL Business SIC classification: REFUSE SYSTEMS Business NAICS classification: SOLID WASTE LANDFILL. Organizations: SCOTT CHARLES F Alternative names: NEWCO WASTE SYSTEMS OF NJ PINELAND PARK SANITARY LANDFILL, PINELAND PARK SANITARY LANDFILL
A C P HOLDING COMPANY (1008 WOODE & LYNNE BOULEVARD in LINWOOD, NJ)
(Resource Conservation and Recovery Act (tracking hazardous waste))
ACUA TRANSFER STATION (DELILAH ROAD in LINWOOD, NJ)
(Resource Conservation and Recovery Act (tracking hazardous waste))
NEW JERSEY AMERICAN WATER CO (KIRKLAND & NEW RD in LINWOOD, NJ)
(Resource Conservation and Recovery Act (tracking hazardous waste))
OCEAN HEIGHTS AUTO SALVAGE (RD 1 BOX 157 OCEAN HEIGHTS AVE in EGG HARBOR TWP, NJ)
(Resource Conservation and Recovery Act (tracking hazardous waste))
CITY VOLUNTEER FIRE (PHILA&DIESTERWERG in EGG HARBOR CITY, NJ)
AIR MINOR (AIRS/AFS) Business SIC classification: FIRE PROTECTION
FISCHER GREENHOUSES (OAK AVE NEAR CENTRAL in LINWOOD, NJ)
(Resource Conservation and Recovery Act (tracking hazardous waste))
FISCHER GREENHOUSES (OAK AVE LOT 15 BLOCK 148.03 in LINWOOD, NJ)
(Resource Conservation and Recovery Act (tracking hazardous waste))
FRED GALLIGANI (20 ADAMS ROAD in PLEASANTVILLE, NJ)
AIR MINOR (AIRS/AFS) Business SIC classification: ARRANGEMENT OF TRANSPORTATION OF FREIGHT AND CARGO
A B C CESSPOOL & SEWER SERVICE (191 A OLD ZION ROAD in LINWOOD, NJ)
Housing units lacking complete plumbing facilities: 0.2% Housing units lacking complete kitchen facilities: 1.3%
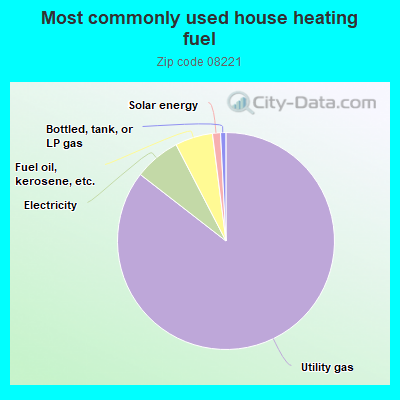
85.6%Utility gas
6.9%Electricity
5.6%Fuel oil, kerosene, etc.
1.2%Solar energy
0.8%Bottled, tank, or LP gas
Population in 1990: 9,353.
Place of birth for U.S.-born residents:
This state: 3,952
Northeast: 1,865
Midwest: 133
South: 230
West: 72
72% of the 08221 zip code residents lived in the same house 5 years ago. Out of people who lived in different houses, 68% lived in this county. Out of people who lived in different counties, 50% lived in New Jersey.
92% of the 08221 zip code residents lived in the same house 1 year ago. Out of people who lived in different houses, 66% moved from this county. Out of people who lived in different houses, 11% moved from different county within same state. Out of people who lived in different houses, 18% moved from different state. Out of people who lived in different houses, 3% moved from abroad.
Private vs. public school enrollment:
Students in private schools in grades 1 to 8 (elementary and middle school): 37
Here:
5.4%
New Jersey:
12.3%
Students in private schools in grades 9 to 12 (high school): 40
Here:
12.1%
New Jersey:
13.1%
Students in private undergraduate colleges: 39
Here:
17.2%
New Jersey:
33.2%
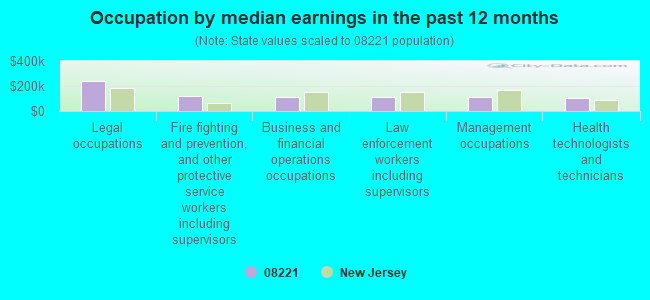
Occupation by median earnings in the past 12 months ($)
242,553Legal occupations
118,744Fire fighting and prevention, and other protective service workers including supervisors
113,447Business and financial operations occupations
111,757Law enforcement workers including supervisors
108,696Management occupations
102,390Health technologists and technicians
Top industries in this zip code by the number of employees in 2005:
Health Care and Social Assistance: Offices of Physicians (except Mental Health Specialists) (20-49 employees: 3 establishments, 10-19 employees: 9 establishments, 5-9 employees: 9 establishments, 1-4 employees: 16 establishments)
2002 - 2018 National Fire Incident Reporting System (NFIRS) incidents
According to the data from the years 2002 - 2018 the average number of fires per year is 11. The highest number of reported fire incidents - 31 took place in 2004, and the least - 1 in 2005. The data has a growing trend.
When looking into fire subcategories, the most incidents belonged to: Structure Fires (47.2%), and Outside Fires (31.6%).
Fire incident types reported to NFIRS in Zip Code 08221


 Nearest zip codes: 08244, 08403, 08225, 08234, 08402, 08232.


 According to the data from the years 2002 - 2018 the average number of fires per year is 11. The highest number of reported fire incidents - 31 took place in 2004, and the least - 1 in 2005. The data has a growing trend.
 When looking into fire subcategories, the most incidents belonged to: Structure Fires (47.2%), and Outside Fires (31.6%).