Estimated zip code population in 2022: 20,268 Zip code population in 2010: 19,292 Zip code population in 2000: 17,907
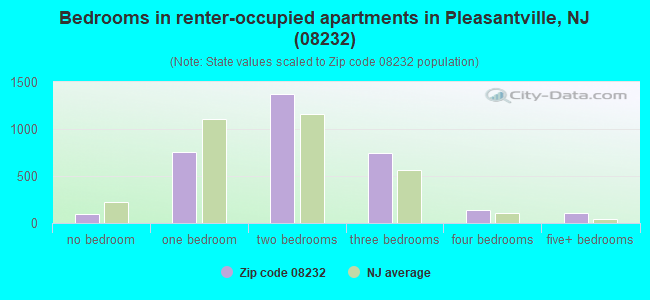
Houses and condos: 7,224 Renter-occupied apartments: 3,226
% of renters here:
49%
State:
35%
March 2022 cost of living index in zip code 08232: 102.0 (near average, U.S. average is 100)
Land area: 5.9 sq. mi. Water area: 2.1 sq. mi.
Population density: 3,427 people per square mile
(average).
OSM Map
Google Map
MSN Map
OSM Map
General Map
Google Map
MSN Map
OSM Map
Google Map
MSN Map
OSM Map
Google Map
MSN Map
Please wait while loading the map...
Real estate property taxes paid for housing units in 2022:
This zip code:
3.0% ($5,138)
New Jersey:
2.1% ($8,897)
Median real estate property taxes paid for housing units with mortgages in 2022: $5,140 (3.0%) Median real estate property taxes paid for housing units with no mortgage in 2022: $5,144 (3.2%)
Averages for the 2020 tax year for zip code 08232, filed in 2021:
Average Adjusted Gross Income (AGI) in 2020: $32,394 (Individual Income Tax Returns)
Here:
$32,394
State:
$95,247
Salary/wage: $26,425 (reported on 87.6% of returns)
Here:
$26,425
State:
$80,635
(% of AGI for various income ranges: 1284.5% for AGIs below $25k, 3347.9% for AGIs $25k-50k, 6300.3% for AGIs $50k-75k, 9523.0% for AGIs $75k-100k, 14634.6% for AGIs $100k-200k)
Taxable interest for individuals: $438 (reported on 7.9% of returns)
This zip code:
$438
New Jersey:
$2,414
(% of AGI for various income ranges: 1.8% for AGIs below $25k, 3.6% for AGIs $25k-50k, 9.7% for AGIs $50k-75k, 17.4% for AGIs $75k-100k, 55.4% for AGIs $100k-200k)
Ordinary dividends: $2,240 (reported on 3.4% of returns)
Here:
$2,240
State:
$8,057
(% of AGI for various income ranges: 2.6% for AGIs below $25k, 2.4% for AGIs $25k-50k, 10.4% for AGIs $50k-75k, 33.9% for AGIs $75k-100k, 353.1% for AGIs $100k-200k)
Net capital gain/loss in AGI: +$7,556 (reported on 3.3% of returns)
Here:
+$7,556
State:
+$25,022
(% of AGI for various income ranges: 3.7% for AGIs below $25k, 3.4% for AGIs $25k-50k, 33.2% for AGIs $50k-75k, 142.6% for AGIs $75k-100k, 1346.9% for AGIs $100k-200k)
Profit/loss from business: +$4,934 (reported on 11.6% of returns)
Here:
+$4,934
State:
+$18,035
(% of AGI for various income ranges: 57.2% for AGIs below $25k, 56.1% for AGIs $25k-50k, 70.3% for AGIs $50k-75k, 290.9% for AGIs $75k-100k, 762.3% for AGIs $100k-200k)
Taxable individual retirement arrangement distribution: $13,315 (reported on 1.9% of returns)
08232:
$13,315
New Jersey:
$21,558
(% of AGI for various income ranges: 11.1% for AGIs below $25k, 15.4% for AGIs $25k-50k, 39.7% for AGIs $50k-75k, 180.9% for AGIs $75k-100k, 828.5% for AGIs $100k-200k)
Total itemized deductions: $22,645 (reported on 4.9% of returns)
Here:
$22,645
State:
$32,863
(% of AGI for various income ranges: 26.8% for AGIs below $25k, 141.7% for AGIs $25k-50k, 342.2% for AGIs $50k-75k, 770.4% for AGIs $75k-100k, 1430.0% for AGIs $100k-200k)
Charity contributions: $6,500 (reported on 3.5% of returns)
Here:
$6,500
State:
$7,880
(% of AGI for various income ranges: 2.1% for AGIs below $25k, 25.1% for AGIs $25k-50k, 82.4% for AGIs $50k-75k, 221.7% for AGIs $75k-100k, 268.5% for AGIs $100k-200k)
Taxes paid: $8,088 (reported on 4.9% of returns)
08232:
$8,088
State:
$9,183
(% of AGI for various income ranges: 8.7% for AGIs below $25k, 55.1% for AGIs $25k-50k, 137.9% for AGIs $50k-75k, 251.3% for AGIs $75k-100k, 376.9% for AGIs $100k-200k)
Earned income credit: $2,463 (reported on 30.6% of returns)
Here:
$2,463
State:
$2,148
(% of AGI for various income ranges: 130.2% for AGIs below $25k, 107.3% for AGIs $25k-50k)
Percentage of individuals using paid preparers for their 2020 taxes: 91.2%
Here:
91%
State:
92%
(% for various income ranges: 89.6% for AGIs below $25k, 92.6% for AGIs $25k-50k, 92.8% for AGIs $50k-75k, 92.1% for AGIs $75k-100k, 91.3% for AGIs $100k-200k, 100.0% for AGIs over 200k)
Averages for the 2012 tax year for zip code 08232, filed in 2013:
Average Adjusted Gross Income (AGI) in 2012: $28,947 (Individual Income Tax Returns)
Here:
$28,947
State:
$79,688
Salary/wage: $26,183 (reported on 89.6% of returns)
Here:
$26,183
State:
$68,122
(% of AGI for various income ranges: 80.3% for AGIs below $25k, 88.5% for AGIs $25k-50k, 78.6% for AGIs $50k-75k, 71.5% for AGIs $75k-100k, 68.2% for AGIs $100k-200k)
Taxable interest for individuals: $536 (reported on 10.8% of returns)
This zip code:
$536
New Jersey:
$2,193
(% of AGI for various income ranges: 0.2% for AGIs below $25k, 0.1% for AGIs $25k-50k, 0.2% for AGIs $50k-75k, 0.2% for AGIs $75k-100k, 0.6% for AGIs $100k-200k)
Ordinary dividends: $2,278 (reported on 3.9% of returns)
Here:
$2,278
State:
$6,828
(% of AGI for various income ranges: 0.2% for AGIs below $25k, 0.2% for AGIs $25k-50k, 0.4% for AGIs $50k-75k, 0.8% for AGIs $75k-100k, 0.4% for AGIs $100k-200k)
Net capital gain/loss in AGI: +$35 (reported on 2.4% of returns)
Here:
+$35
State:
+$15,358
(% of AGI for various income ranges: 0.2% for AGIs $75k-100k)
Profit/loss from business: +$6,789 (reported on 7.7% of returns)
Here:
+$6,789
State:
+$19,577
(% of AGI for various income ranges: 4.9% for AGIs below $25k, 0.7% for AGIs $25k-50k, 1.2% for AGIs $50k-75k, 0.2% for AGIs $75k-100k, 0.4% for AGIs $100k-200k)
Taxable individual retirement arrangement distribution: $9,321 (reported on 3.0% of returns)
08232:
$9,321
New Jersey:
$18,214
(% of AGI for various income ranges: 0.8% for AGIs below $25k, 0.6% for AGIs $25k-50k, 1.7% for AGIs $50k-75k, 2.8% for AGIs $75k-100k)
Total itemized deductions: $16,484 (32% of AGI, reported on 22.3% of returns)
Here:
$16,484
State:
$30,827
Here:
32.1% of AGI
State:
21.2% of AGI
(% of AGI for various income ranges: 7.4% for AGIs below $25k, 12.2% for AGIs $25k-50k, 16.7% for AGIs $50k-75k, 18.1% for AGIs $75k-100k, 16.7% for AGIs $100k-200k)
Charity contributions: $2,597 (reported on 16.3% of returns)
Here:
$2,597
State:
$3,451
(% of AGI for various income ranges: 0.6% for AGIs below $25k, 1.1% for AGIs $25k-50k, 2.1% for AGIs $50k-75k, 3.1% for AGIs $75k-100k, 2.5% for AGIs $100k-200k)
Taxes paid: $5,715 (reported on 22.2% of returns)
08232:
$5,715
State:
$15,801
(% of AGI for various income ranges: 2.2% for AGIs below $25k, 4.2% for AGIs $25k-50k, 5.7% for AGIs $50k-75k, 6.1% for AGIs $75k-100k, 6.6% for AGIs $100k-200k)
Earned income credit: $2,557 (reported on 37.0% of returns)
Here:
$2,557
State:
$2,182
(% of AGI for various income ranges: 9.7% for AGIs below $25k, 1.9% for AGIs $25k-50k)
Percentage of individuals using paid preparers for their 2012 taxes: 65.7%
Here:
66%
State:
65%
(% for various income ranges: 64.3% for AGIs below $25k, 67.0% for AGIs $25k-50k, 67.9% for AGIs $50k-75k, 69.0% for AGIs $75k-100k, 68.4% for AGIs $100k-200k)
Averages for the 2004 tax year for zip code 08232, filed in 2005:
Average Adjusted Gross Income (AGI) in 2004: $29,118 (Individual Income Tax Returns)
Here:
$29,118
State:
$64,921
Salary/wage: $26,717 (reported on 92.5% of returns)
Here:
$26,717
State:
$57,755
(% of AGI for various income ranges: 81.3% for AGIs below $10k, 88.9% for AGIs $10k-25k, 91.1% for AGIs $25k-50k, 84.5% for AGIs $50k-75k, 79.4% for AGIs $75k-100k, 58.0% for AGIs over 100k)
Taxable interest for individuals: $725 (reported on 19.0% of returns)
This zip code:
$725
New Jersey:
$2,068
(% of AGI for various income ranges: 0.9% for AGIs below $10k, 0.4% for AGIs $10k-25k, 0.3% for AGIs $25k-50k, 0.5% for AGIs $50k-75k, 0.5% for AGIs $75k-100k, 0.9% for AGIs over 100k)
Taxable dividends: $1,339 (reported on 6.2% of returns)
Here:
$1,339
State:
$3,959
(% of AGI for various income ranges: 0.8% for AGIs below $10k, 0.2% for AGIs $10k-25k, 0.2% for AGIs $25k-50k, 0.3% for AGIs $50k-75k, 0.6% for AGIs $75k-100k, 0.4% for AGIs over 100k)
Net capital gain/loss: +$2,545 (reported on 3.9% of returns)
Here:
+$2,545
State:
+$13,591
(% of AGI for various income ranges: -0.5% for AGIs below $10k, -0.0% for AGIs $10k-25k, -0.1% for AGIs $25k-50k, 0.0% for AGIs $50k-75k, 0.4% for AGIs $75k-100k, 3.5% for AGIs over 100k)
Profit/loss from business: +$6,925 (reported on 7.4% of returns)
Here:
+$6,925
State:
+$17,520
(% of AGI for various income ranges: 7.7% for AGIs below $10k, 2.3% for AGIs $10k-25k, 0.8% for AGIs $25k-50k, 1.2% for AGIs $50k-75k, 0.2% for AGIs $75k-100k, 4.6% for AGIs over 100k)
IRA payment deduction: $1,791 (reported on 1.3% of returns)
08232:
$1,791
New Jersey:
$3,270
Self-employed pension: $2,500 (reported on 0.1% of returns)
Here:
$2,500
New Jersey:
$17,258
Total itemized deductions: $14,110 (30% of AGI, reported on 30.4% of returns)
Here:
$14,110
State:
$23,924
Here:
30.0% of AGI
State:
21.1% of AGI
(% of AGI for various income ranges: 6.6% for AGIs below $10k, 9.1% for AGIs $10k-25k, 16.7% for AGIs $25k-50k, 17.4% for AGIs $50k-75k, 16.6% for AGIs $75k-100k, 15.6% for AGIs over 100k)
Charity contributions deductions: $2,190 (4% of AGI, reported on 26.2% of returns)
Here:
$2,190
State:
$3,242
Here:
4.5% of AGI
State:
2.7% of AGI
(% of AGI for various income ranges: 0.5% for AGIs below $10k, 0.8% for AGIs $10k-25k, 1.9% for AGIs $25k-50k, 2.8% for AGIs $50k-75k, 3.2% for AGIs $75k-100k, 2.8% for AGIs over 100k)
Total tax: $3,407 (reported on 59.6% of returns)
08232:
$3,407
State:
$12,321
(% of AGI for various income ranges: 1.9% for AGIs below $10k, 2.4% for AGIs $10k-25k, 5.3% for AGIs $25k-50k, 8.9% for AGIs $50k-75k, 11.0% for AGIs $75k-100k, 18.4% for AGIs over 100k)
Earned income credit: $1,920 (reported on 36.4% of returns)
Here:
$1,920
State:
$1,711
Percentage of individuals using paid preparers for their 2004 taxes: 71.9%
Here:
72%
State:
65%
(% for various income ranges: 63.8% for AGIs below $10k, 75.1% for AGIs $10k-25k, 73.1% for AGIs $25k-50k, 70.6% for AGIs $50k-75k, 73.0% for AGIs $75k-100k, 73.2% for AGIs over 100k)
Likely homosexual households (counted as self-reported same-sex unmarried-partner households)
Lesbian couples: 0.6% of all households
Gay men: 0.0% of all households
Household received Food Stamps/SNAP in the past 12 months: 2,046 Household did not receive Food Stamps/SNAP in the past 12 months: 4,716
Women who had a birth in the past 12 months: 374 (192 now married, 176 unmarried) Women who did not have a birth in the past 12 months: 4,984 (1,648 now married, 3,344 unmarried)
Housing units in zip code 08232 with a mortgage: 1,883 (22 second mortgage, 22 both second mortgage and home equity loan) Median monthly owner costs for units with a mortgage: $1,664 Median monthly owner costs for units without a mortgage: $938
Residents with income below the poverty level in 2022:
This zip code:
23.7%
Whole state:
9.7%
Residents with income below 50% of the poverty level in 2022:
This zip code:
15.6%
Whole state:
5.2%
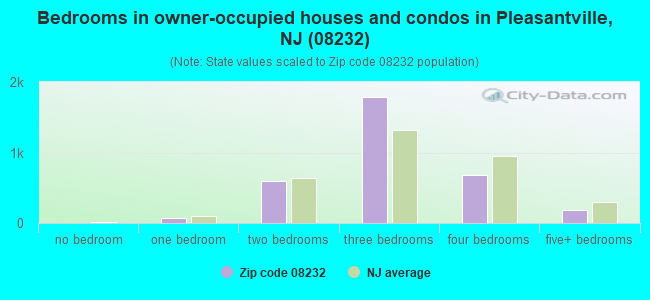
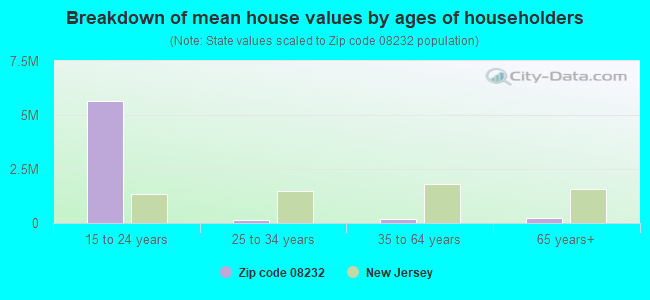
Median number of rooms in houses and condos:
Here:
6.1
State:
6.8
Median number of rooms in apartments:
Here:
4.2
State:
3.9
Notable locations in this zip code not listed on our city pages
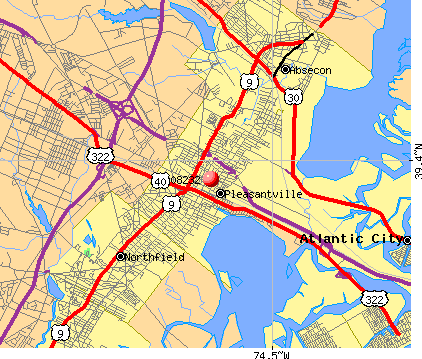
Notable locations in zip code 08232: West Atlantic City Volunteer Fire Company 5 (A), Pleasantville Fire Department and Emergency Medical Services (B). Display/hide their locations on the map
Churches in zip code 08232 include: Mount Olive Church (A), Saint Marks Church (B), Saint Paul Church (C), Grace Church (D), Mount Pleasant Church (E), Mount Olive Church (F), Mount Pleasant Church (G), Saint Marks Church (H), Mount Pleasant Church (I). Display/hide their locations on the map
2,221 married couples with children.
2,176 single-parent households (314 men, 1,862 women).
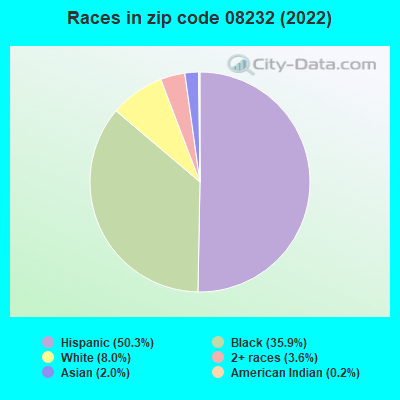
46.4% of residents of 08232 zip code speak English at home.
44.4% of residents speak Spanish at home (46% very well, 19% well, 23% not well, 12% not at all).
7.2% of residents speak other Indo-European language at home (54% very well, 37% well, 8% not well, 1% not at all).
1.3% of residents speak Asian or Pacific Island language at home (46% very well, 27% well, 20% not well, 7% not at all).
0.6% of residents speak other language at home (100% very well).
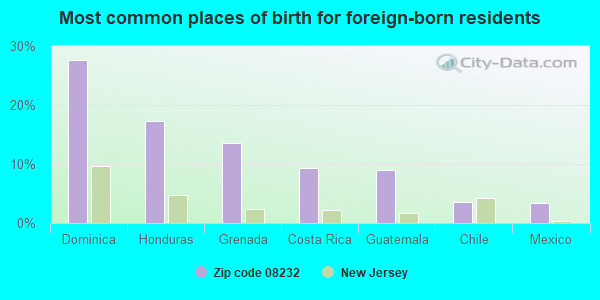
Foreign born population: 5,692 (28.1%) (43.9% of them are naturalized citizens)
This zip code:
28.1%
Whole state:
23.5%
28%Dominica
17%Honduras
14%Grenada
9%Costa Rica
9%Guatemala
3%Chile
3%Mexico
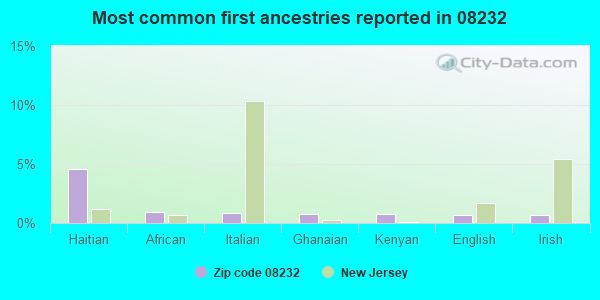
5%Haitian
1%African
1%Italian
1%Ghanaian
1%Kenyan
1%English
1%Irish
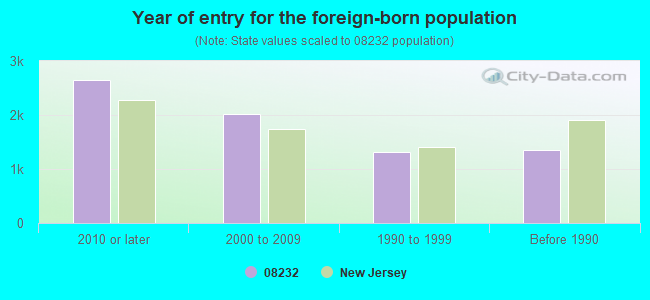
Year of entry for the foreign-born population
2,6562010 or later
2,0212000 to 2009
1,3081990 to 1999
1,351Before 1990
Major facilities with environmental interests located in this zip code:
AE STONE INC RECYCLING (1435 DOUGHTY RD in PLEASANTVILLE, NJ)
AIR MINOR (AIRS/AFS) AIR SYNTHETIC MINOR (AIRS/AFS) COMPLIANCE ACTIVITY (Tracking inspections of insecticide, fungicide, and rodenticide, and toxic substances) CRITERIA AND HAZARDOUS AIR POLLUTANT INVENTORY (Inventory of air pollution sources) STATE MASTER (New Jersey environmental info) - NJEMS-011903, STATE CLEANUP SITE, NJEMS-11131300000, EPCRA, NJEMS-131844, MATERIAL RECYCLING, NJEMS-232906, National Pollutant Discharge Elimination System Permit, NJEMS-244463, REFUSE DISPOSAL, NJEMS-70003, AIR PROGRAM, NJEMS-70279, (Resource Conservation and Recovery Act (tracking hazardous waste)) Business SIC classification: HIGHWAY AND STREET CONSTRUCTION, EXCEPT ELEVATED HIGHWAYS; ASPHALT PAVING MIXTURES AND BLOCKS Organizations: RITTER THOMAS, ANTHONY EXCAVATING & DEMOLITION Alternative names: A&E STONE, INC, A E STONE INC, AE STNE ADAM-DOUGHTY, ANTHONY EXCAVATING & DEMOLITION, STONE, A. E., INC.
GIFFORD MARINE INC (18 N FRANKLIN AVE in PLEASANTVILLE, NJ)
ENFORCEMENT/COMPLIANCE ACTIVITY (Integrated Compliance Information System) - ICIS-02-2004-0917, FORMAL ENFORCEMENT ACTION (Integrated Compliance Information System) - ICIS-02-2004-0917, FORMAL ENFORCEMENT ACTION STATE MASTER (New Jersey environmental info) - NJEMS-004076, STATE CLEANUP SITE Business SIC classification: MARINAS Alternative names: GIFFORD MARINA
GETTY SERVICE STATION #57201 (168 BLACKHORSE PIKE & FIRE RD in PLEASANTVILLE, NJ)
STATE MASTER (New Jersey environmental info) - NJEMS-007220, STATE CLEANUP SITE, NJEMS-46622, National Pollutant Discharge Elimination System Permit, NJEMS-70224, AIR PROGRAM, NJEMS-70495, NJEMS-80265300000, EPCRA, NJEMS-A7126, AIR PROGRAM (Resource Conservation and Recovery Act (tracking hazardous waste)) Business SIC classification: GASOLINE SERVICE STATIONS Organizations: EXXON MOBIL CORP, TOSCO CORP, GETTY PETROLEUM MARKETING INC, TOSCO CORP (CONTACT/OWNER)
, EXXON MOBIL OIL CORP (CONTACT/OWNER)
, EXXON MOBIL CORP (CONTACT/OWNER)
, GETTY PETROLEUM MARKETING INC (CONTACT/OWNER)
Alternative names: MOBIL OIL CORP SS 168, MOBIL SERVICE STATION #2634826
EXXON SERVICE STATION #38712 (BLACKHORSE PIKE & DOUGHTY in PLEASANTVILLE, NJ)
STATE MASTER (New Jersey environmental info) - NJEMS-007865, STATE CLEANUP SITE, NJEMS-33757700008, EPCRA, NJEMS-70409, AIR PROGRAM, NJEMS-A7001, (Resource Conservation and Recovery Act (tracking hazardous waste)) Business SIC classification: GASOLINE SERVICE STATIONS Organizations: EXXON CO USA, LEHIGH GAS CORP, EXXON MOBIL RESEARCH & ENGINEERING CO, EXXON CO USA (CONTACT/OPERATOR)
, LEHIGH GAS CORP (CONTACT/OWNER)
Alternative names: EXXON CO USA 38712
PLEASANTVILLE CITY MUNICIPAL BUILDING (18 1ST ST in PLEASANTVILLE, NJ)
STATE MASTER (New Jersey environmental info) - NJEMS-195086, STATE CLEANUP SITE, NJEMS-208618, National Pollutant Discharge Elimination System Permit National Pollutant Discharge Elimination System NON-MAJOR (Tracking pollutant discharge elimination systems) - permit
OLE HANSEN & SONS INC (22 NORTH FRANKLIN AVENUE in PLEASANTVILLE, NJ)
STATE MASTER (New Jersey environmental info) - NJEMS-005535, STATE CLEANUP SITE, NJEMS-198397, REFUSE DISPOSAL, NJEMS-203972, TRANSPORTER (Resource Conservation and Recovery Act (tracking hazardous waste)) - notification (Resource Conservation and Recovery Act (tracking hazardous waste)) Organizations: HANSEN INC, ATLANTIC UTILITY CONSTRUCTION CO. (CONTACT/OWNER)
Alternative names: ATLANTIC UTILITY CONSTRUCTION CO
ATLANTIC CITY MUA (1151 NORTH MAIN STREET in PLEASANTVILLE, NJ)
STATE MASTER (New Jersey environmental info) - NJEMS-01001, LAB CERTIFICATION - NON-COMMERCIAL ENVIRONMENTAL LAB, NJEMS-0102001, DRINKING WATER PROGRAM, NJEMS-0119-05-0003.1, LAND USE - COASTAL AND LAND USE, NJEMS-014146, STATE CLEANUP SITE, NJEMS-1217D, DRINKING WATER PROGRAM, NJEMS-213414, REFUSE DISPOSAL, NJEMS-5306, DRINKING WATER PROGRAM, NJEMS-70216, AIR PROGRAM (Resource Conservation and Recovery Act (tracking hazardous waste)) Business SIC classification: WATER SUPPLY Organizations: ATLANTIC CITY DPW Alternative names: ATLANTIC CITY MUA WTP, ATLANTIC CITY MUNI UTIL AUTH, ATLANTIC CITY Municipal Utility Authority WATER PLANT
ATLANTIC PLASTIC CONTAINERS INC (W JERSEY AVE in MCKEE CITY, NJ)
AIR MINOR (AIRS/AFS) STATE MASTER (New Jersey environmental info) - NJEMS-201137, REFUSE DISPOSAL, NJEMS-70034, AIR PROGRAM (Resource Conservation and Recovery Act (tracking hazardous waste))
PLEASANTVILLE CITY BD OF ED ADMIN BUILDING (115 WEST DECATUR AVENUE in PLEASANTVILLE, NJ)
COMPLIANCE ACTIVITY (Tracking inspections of insecticide, fungicide, and rodenticide, and toxic substances) STATE MASTER (New Jersey environmental info) - NJEMS-012613, STATE CLEANUP SITE (Resource Conservation and Recovery Act (tracking hazardous waste)) Alternative names: PLEASANTVILLE BD OF ED, PLEASANTVILLE BD OF EDUCATION, PLEASANTVILLE CITY BOARD OF EDUCATION ADMINISTRATION BUILDING, PLEASANTVILLE SCHOOL DISTRICT
ADVENTURE TRAILS COACH USA (711 NEW ROAD in PLEASANTVILLE, NJ)
STATE MASTER (New Jersey environmental info) - NJEMS-033722, STATE CLEANUP SITE, NJEMS-48080, National Pollutant Discharge Elimination System Permit, NJEMS-55601500000, EPCRA, NJEMS-NJR000031203, HAZARDOUS WASTE PROGRAM Small Quantity Generators, between 100 kg and 1000 kg of hazardous waste/month (Resource Conservation and Recovery Act (tracking hazardous waste)) - notification Business SIC classification: LOCAL BUS CHARTER SERVICE; TERMINAL AND SERVICE FACILITIES FOR MOTOR VEHICLE PASSENGER TRANSPORTATION Organizations: LEISURE TIME TOURS, GREYHOUND LINES INC, CAPE TRANSIT CORP, COACH USA CORP - HOUSTON CORPORATE OFFICE (CONTACT/OWNER)
Alternative names: LEISURE LINE TOURS COACH USA, LEISURE TIME TOURS COACH USA
GALLIGANI FREDERICK (120 ADAMS RD in PLEASANTVILLE, NJ)
STATE MASTER (New Jersey environmental info) - NJEMS-030960, STATE CLEANUP SITE, NJEMS-198407, REFUSE DISPOSAL, NJEMS-206541, (Resource Conservation and Recovery Act (tracking hazardous waste)) Organizations: RUSELL GORHAM, GALLIGANT FREDERICK & GORHAM TOM (CONTACT/OWNER)
EXXON SERVICE STATION #39306 (BLACKHORSE PIKE & NEW RD in PLEASANTVILLE, NJ)
STATE MASTER (New Jersey environmental info) - NJEMS-007369, STATE CLEANUP SITE, NJEMS-85201200000, EPCRA, NJEMS-92220400000, NJEMS-A7125, AIR PROGRAM, NJEMS-00000036816, EPCRA (Resource Conservation and Recovery Act (tracking hazardous waste)) Business SIC classification: GASOLINE SERVICE STATIONS Organizations: EXXON CO USA, LEHIGH GAS CORP Alternative names: EXXON CO USA 39306
Housing units lacking complete plumbing facilities: 1.9% Housing units lacking complete kitchen facilities: 1.9%
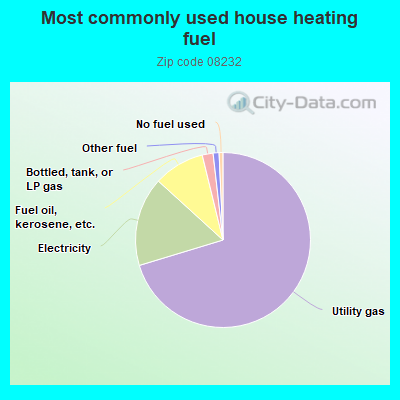
70.1%Utility gas
16.4%Electricity
9.4%Fuel oil, kerosene, etc.
2.0%Bottled, tank, or LP gas
1.1%Other fuel
0.7%No fuel used
Population in 1990: 30,292.
Place of birth for U.S.-born residents:
This state: 9,952
Northeast: 1,818
Midwest: 57
South: 1,100
West: 77
57% of the 08232 zip code residents lived in the same house 5 years ago. Out of people who lived in different houses, 83% lived in this county. Out of people who lived in different counties, 50% lived in New Jersey.
91% of the 08232 zip code residents lived in the same house 1 year ago. Out of people who lived in different houses, 69% moved from this county. Out of people who lived in different houses, 6% moved from different county within same state. Out of people who lived in different houses, 17% moved from different state. Out of people who lived in different houses, 5% moved from abroad.
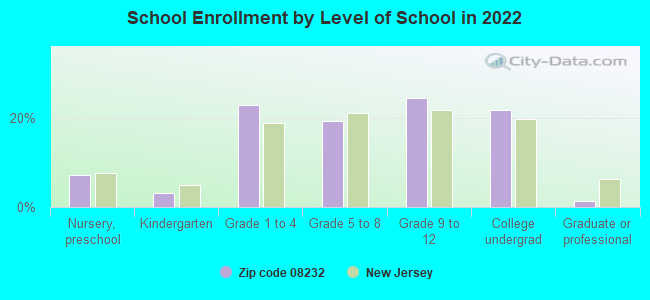
Private vs. public school enrollment:
Students in private schools in grades 1 to 8 (elementary and middle school): 52
Here:
2.5%
New Jersey:
12.3%
Students in private schools in grades 9 to 12 (high school): 64
Here:
5.2%
New Jersey:
13.1%
Students in private undergraduate colleges: 174
Here:
15.9%
New Jersey:
33.2%
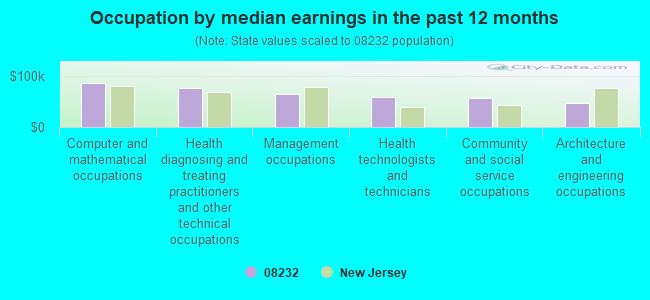
Occupation by median earnings in the past 12 months ($)
85,821Computer and mathematical occupations
75,697Health diagnosing and treating practitioners and other technical occupations
64,132Management occupations
58,375Health technologists and technicians
56,675Community and social service occupations
45,951Architecture and engineering occupations
Companies with federal contracts located in this zip code:
CONNECTED OFFICE PRODUCTS INC (1129 S NEW RD in PLEASANTVILLE, NJ; small business) : $47,371 in 3 contractsfrom 2003 to 2004
$37,375 with Army for ADP Support Equipment. Signed on 2003-09-30. Completion date: 2003-10-20.
$4,998 with Navy for Maintenance, Repair and Rebuilding of Equipment -- Automatic Data Processing Equipment (Including Firmware), Software, Supplies and Support Equipment. Signed on 2004-10-27. Completion date: 2005-09-30.
$4,998 with Navy for Other ADP and Telecommunications Services (includes data storage on tapes, compact disks, etc.). Taking place in PA. Signed on 2003-10-01. Completion date: 2004-09-30.
GOTHAM GROUP, INC (711 N MAIN ST STE 9 in PLEASANTVILLE, NJ; small business)
$41,407 with Army for Signs, Advertising Displays, and Identification Plates. Signed on 2000-09-25. Completion date: 2000-12-05.
SOUTH JERSEY PUBLISHING CO (1000 W WASHINGTON AVE in PLEASANTVILLE, NJ)
$10,000 with Navy for Newspapers and Periodicals. Signed on 2004-07-29. Completion date: 2004-07-30.
Top industries in this zip code by the number of employees in 2005:
Management of Companies and Enterprises: Corporate, Subsidiary, and Regional Managing Offices (over 1000 employees: 1 establishment, 20-49 employees: 1 establishment, 5-9 employees: 1 establishment, 1-4 employees: 1 establishment)
Health Care and Social Assistance: Nursing Care Facilities (250-499: 1, 100-249: 1)
2002 - 2018 National Fire Incident Reporting System (NFIRS) incidents
According to the data from the years 2002 - 2018 the average number of fires per year is 110. The highest number of reported fire incidents - 165 took place in 2006, and the least - 58 in 2013. The data has a dropping trend.
When looking into fire subcategories, the most incidents belonged to: Structure Fires (50.0%), and Outside Fires (32.3%).
Fire incident types reported to NFIRS in Zip Code 08232


 Nearest zip codes: 08225, 08201, 08406, 08402, 08401, 08221.


 According to the data from the years 2002 - 2018 the average number of fires per year is 110. The highest number of reported fire incidents - 165 took place in 2006, and the least - 58 in 2013. The data has a dropping trend.
 When looking into fire subcategories, the most incidents belonged to: Structure Fires (50.0%), and Outside Fires (32.3%).