Estimated zip code population in 2022: 5,338 Zip code population in 2010: 6,354 Zip code population in 2000: 8,193
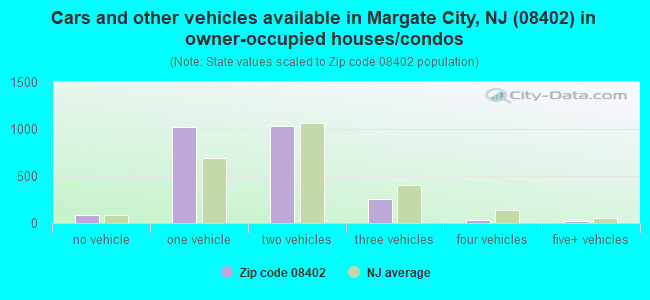
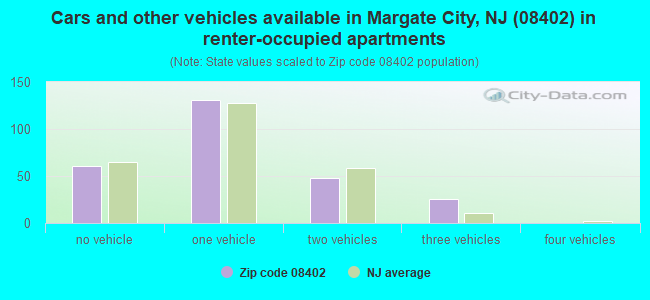
Houses and condos: 6,898 Renter-occupied apartments: 265
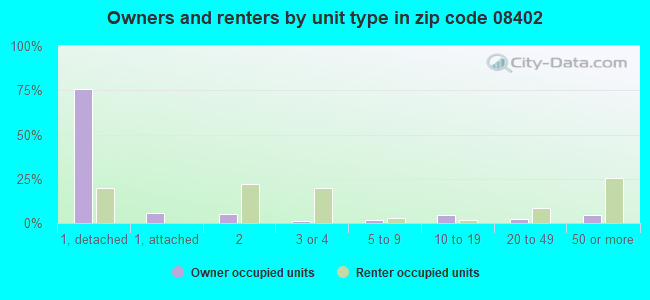
% of renters here:
10%
State:
35%
March 2022 cost of living index in zip code 08402: 104.9 (near average, U.S. average is 100)
Land area: 1.4 sq. mi. Water area: 1.2 sq. mi.
Population density: 3,772 people per square mile
(average).
OSM Map
Google Map
MSN Map
OSM Map
General Map
Google Map
MSN Map
OSM Map
Google Map
MSN Map
OSM Map
Google Map
MSN Map
Please wait while loading the map...
Real estate property taxes paid for housing units in 2022:
This zip code:
1.1% ($6,729)
New Jersey:
2.1% ($8,897)
Median real estate property taxes paid for housing units with mortgages in 2022: $7,204 (1.0%) Median real estate property taxes paid for housing units with no mortgage in 2022: $6,243 (1.2%)
Business Search- 14 Million verified businesses
Males: 2,445
(45.8%)
Females: 2,892
(54.2%)
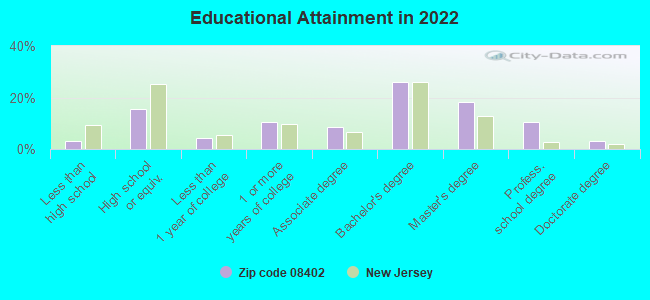
For population 25 years and over in 08402:
High school or higher: 97.2%
Bachelor's degree or higher: 58.2%
Graduate or professional degree: 32.0%
Unemployed: 2.8%
Mean travel time to work (commute): 28.4 minutes
For population 15 years and over in 08402:
Never married: 20.4%
Now married: 58.4%
Separated: 0.3%
Widowed: 7.3%
Divorced: 13.6%
Zip code 08402 compared to state average:
Unemployed percentage below state average.
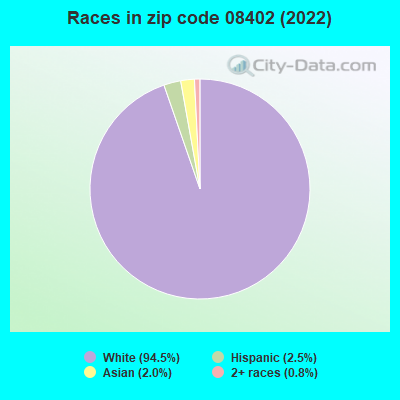
Black race population percentage significantly below state average.
Hispanic race population percentage significantly below state average.
Median age significantly above state average.
Foreign-born population percentage significantly below state average.
Renting percentage significantly below state average.
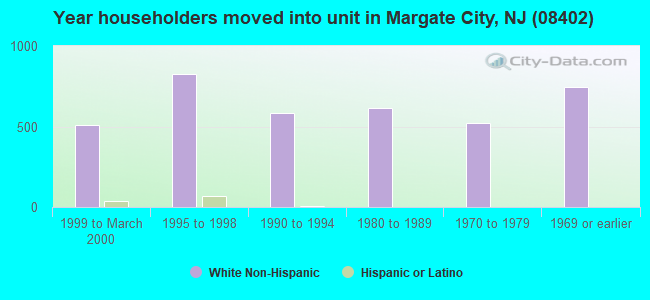
Length of stay since moving in above state average.
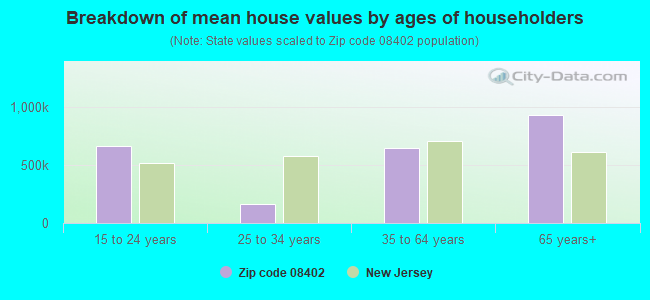
Estimated median house/condo value in 2022: $611,295
08402:
$611,295
New Jersey:
$428,900
According to our research of New Jersey and other state lists, there was 1 registered sex offender living in 08402 zip code as of April 27, 2024. The ratio of all residents to sex offenders in zip code 08402 is 6,339 to 1. The ratio of registered sex offenders to all residents in this zip code is much lower than the state average.
Median resident age:
This zip code:
58.5 years
New Jersey median age:
40.4 years
Average household size:
This zip code:
2.0 people
New Jersey:
2.6 people
Averages for the 2020 tax year for zip code 08402, filed in 2021:
Average Adjusted Gross Income (AGI) in 2020: $134,418 (Individual Income Tax Returns)
Here:
$134,418
State:
$95,247
Salary/wage: $100,443 (reported on 67.4% of returns)
Here:
$100,443
State:
$80,635
(% of AGI for various income ranges: 1069.5% for AGIs below $25k, 3092.7% for AGIs $25k-50k, 5980.5% for AGIs $50k-75k, 9006.4% for AGIs $75k-100k, 16730.4% for AGIs $100k-200k, 123301.0% for AGIs over 200k)
Taxable interest for individuals: $2,938 (reported on 52.3% of returns)
This zip code:
$2,938
New Jersey:
$2,414
(% of AGI for various income ranges: 55.3% for AGIs below $25k, 106.0% for AGIs $25k-50k, 212.7% for AGIs $50k-75k, 255.0% for AGIs $75k-100k, 445.8% for AGIs $100k-200k, 2159.0% for AGIs over 200k)
Ordinary dividends: $10,272 (reported on 47.7% of returns)
Here:
$10,272
State:
$8,057
(% of AGI for various income ranges: 182.4% for AGIs below $25k, 234.3% for AGIs $25k-50k, 436.8% for AGIs $50k-75k, 1020.0% for AGIs $75k-100k, 1370.0% for AGIs $100k-200k, 7547.0% for AGIs over 200k)
Net capital gain/loss in AGI: +$25,927 (reported on 44.7% of returns)
Here:
+$25,927
State:
+$25,022
(% of AGI for various income ranges: 67.4% for AGIs below $25k, 136.7% for AGIs $25k-50k, 250.9% for AGIs $50k-75k, 693.6% for AGIs $75k-100k, 1546.5% for AGIs $100k-200k, 29051.0% for AGIs over 200k)
Profit/loss from business: +$51,013 (reported on 20.4% of returns)
Here:
+$51,013
State:
+$18,035
(% of AGI for various income ranges: 178.7% for AGIs below $25k, 440.7% for AGIs $25k-50k, 387.3% for AGIs $50k-75k, 1448.6% for AGIs $75k-100k, 2450.8% for AGIs $100k-200k, 20375.0% for AGIs over 200k)
Taxable individual retirement arrangement distribution: $25,364 (reported on 18.1% of returns)
08402:
$25,364
New Jersey:
$21,558
(% of AGI for various income ranges: 137.4% for AGIs below $25k, 269.3% for AGIs $25k-50k, 652.7% for AGIs $50k-75k, 704.3% for AGIs $75k-100k, 1744.6% for AGIs $100k-200k, 5662.0% for AGIs over 200k)
Self-employed (Keogh) retirement plans: $37,900 (reported on 3.9% of returns)
08402:
$37,900
New Jersey:
$30,844
(% of AGI for various income ranges: 351.5% for AGIs $100k-200k, 3634.0% for AGIs over 200k)
Total itemized deductions: $37,908 (reported on 24.0% of returns)
Here:
$37,908
State:
$32,863
(% of AGI for various income ranges: 360.5% for AGIs below $25k, 521.0% for AGIs $25k-50k, 825.5% for AGIs $50k-75k, 1542.1% for AGIs $75k-100k, 2113.5% for AGIs $100k-200k, 15270.0% for AGIs over 200k)
Charity contributions: $9,814 (reported on 21.1% of returns)
Here:
$9,814
State:
$7,880
(% of AGI for various income ranges: 12.6% for AGIs below $25k, 39.7% for AGIs $25k-50k, 59.1% for AGIs $50k-75k, 155.7% for AGIs $75k-100k, 277.3% for AGIs $100k-200k, 5045.0% for AGIs over 200k)
Taxes paid: $8,966 (reported on 24.0% of returns)
08402:
$8,966
State:
$9,183
(% of AGI for various income ranges: 113.4% for AGIs below $25k, 134.0% for AGIs $25k-50k, 232.7% for AGIs $50k-75k, 549.3% for AGIs $75k-100k, 685.8% for AGIs $100k-200k, 2648.0% for AGIs over 200k)
Earned income credit: $1,457 (reported on 4.6% of returns)
Here:
$1,457
State:
$2,148
(% of AGI for various income ranges: 37.4% for AGIs below $25k, 20.7% for AGIs $25k-50k)
Percentage of individuals using paid preparers for their 2020 taxes: 93.8%
Here:
94%
State:
92%
(% for various income ranges: 92.0% for AGIs below $25k, 96.0% for AGIs $25k-50k, 92.7% for AGIs $50k-75k, 93.3% for AGIs $75k-100k, 93.4% for AGIs $100k-200k, 95.7% for AGIs over 200k)
Averages for the 2012 tax year for zip code 08402, filed in 2013:
Average Adjusted Gross Income (AGI) in 2012: $94,545 (Individual Income Tax Returns)
Here:
$94,545
State:
$79,688
Salary/wage: $70,020 (reported on 69.0% of returns)
Here:
$70,020
State:
$68,122
(% of AGI for various income ranges: 56.3% for AGIs below $25k, 59.6% for AGIs $25k-50k, 53.8% for AGIs $50k-75k, 49.9% for AGIs $75k-100k, 52.8% for AGIs $100k-200k, 48.2% for AGIs over 200k)
Taxable interest for individuals: $3,202 (reported on 55.7% of returns)
This zip code:
$3,202
New Jersey:
$2,193
(% of AGI for various income ranges: 3.9% for AGIs below $25k, 1.9% for AGIs $25k-50k, 2.3% for AGIs $50k-75k, 2.6% for AGIs $75k-100k, 2.0% for AGIs $100k-200k, 1.5% for AGIs over 200k)
Ordinary dividends: $7,744 (reported on 44.3% of returns)
Here:
$7,744
State:
$6,828
(% of AGI for various income ranges: 7.8% for AGIs below $25k, 3.7% for AGIs $25k-50k, 3.4% for AGIs $50k-75k, 4.3% for AGIs $75k-100k, 4.3% for AGIs $100k-200k, 2.9% for AGIs over 200k)
Net capital gain/loss in AGI: +$15,387 (reported on 39.0% of returns)
Here:
+$15,387
State:
+$15,358
(% of AGI for various income ranges: 0.8% for AGIs $50k-75k, 0.6% for AGIs $75k-100k, 1.5% for AGIs $100k-200k, 12.4% for AGIs over 200k)
Profit/loss from business: +$41,275 (reported on 18.6% of returns)
Here:
+$41,275
State:
+$19,577
(% of AGI for various income ranges: 9.2% for AGIs below $25k, 8.0% for AGIs $25k-50k, 4.8% for AGIs $50k-75k, 4.8% for AGIs $75k-100k, 7.5% for AGIs $100k-200k, 9.6% for AGIs over 200k)
Taxable individual retirement arrangement distribution: $22,666 (reported on 22.9% of returns)
08402:
$22,666
New Jersey:
$18,214
(% of AGI for various income ranges: 7.5% for AGIs below $25k, 6.8% for AGIs $25k-50k, 5.6% for AGIs $50k-75k, 6.5% for AGIs $75k-100k, 7.8% for AGIs $100k-200k, 3.8% for AGIs over 200k)
Self-employment retirement plans: $27,189 (reported on 2.8% of returns)
08402:
$27,189
New Jersey:
$24,511
Total itemized deductions: $32,846 (22% of AGI, reported on 54.8% of returns)
Here:
$32,846
State:
$30,827
Here:
22.4% of AGI
State:
21.2% of AGI
(% of AGI for various income ranges: 31.5% for AGIs below $25k, 22.6% for AGIs $25k-50k, 20.7% for AGIs $50k-75k, 20.1% for AGIs $75k-100k, 20.1% for AGIs $100k-200k, 16.4% for AGIs over 200k)
Charity contributions: $3,785 (reported on 48.9% of returns)
Here:
$3,785
State:
$3,451
(% of AGI for various income ranges: 1.5% for AGIs below $25k, 1.6% for AGIs $25k-50k, 2.1% for AGIs $50k-75k, 1.5% for AGIs $75k-100k, 1.8% for AGIs $100k-200k, 2.1% for AGIs over 200k)
Taxes paid: $15,036 (reported on 54.5% of returns)
08402:
$15,036
State:
$15,801
(% of AGI for various income ranges: 10.6% for AGIs below $25k, 7.6% for AGIs $25k-50k, 7.8% for AGIs $50k-75k, 8.1% for AGIs $75k-100k, 8.7% for AGIs $100k-200k, 8.9% for AGIs over 200k)
Earned income credit: $1,837 (reported on 5.9% of returns)
Here:
$1,837
State:
$2,182
(% of AGI for various income ranges: 2.4% for AGIs below $25k, 0.3% for AGIs $25k-50k)
Percentage of individuals using paid preparers for their 2012 taxes: 75.5%
Here:
76%
State:
65%
(% for various income ranges: 68.0% for AGIs below $25k, 69.7% for AGIs $25k-50k, 77.3% for AGIs $50k-75k, 80.0% for AGIs $75k-100k, 84.6% for AGIs $100k-200k, 90.3% for AGIs over 200k)
Averages for the 2004 tax year for zip code 08402, filed in 2005:
Average Adjusted Gross Income (AGI) in 2004: $71,893 (Individual Income Tax Returns)
Here:
$71,893
State:
$64,921
Salary/wage: $55,957 (reported on 69.5% of returns)
Here:
$55,957
State:
$57,755
(% of AGI for various income ranges: 137.9% for AGIs below $10k, 58.8% for AGIs $10k-25k, 63.2% for AGIs $25k-50k, 58.8% for AGIs $50k-75k, 56.5% for AGIs $75k-100k, 50.1% for AGIs over 100k)
Taxable interest for individuals: $3,956 (reported on 66.6% of returns)
This zip code:
$3,956
New Jersey:
$2,068
(% of AGI for various income ranges: 26.2% for AGIs below $10k, 6.9% for AGIs $10k-25k, 4.8% for AGIs $25k-50k, 4.3% for AGIs $50k-75k, 4.0% for AGIs $75k-100k, 2.8% for AGIs over 100k)
Taxable dividends: $4,940 (reported on 51.2% of returns)
Here:
$4,940
State:
$3,959
(% of AGI for various income ranges: 32.1% for AGIs below $10k, 7.1% for AGIs $10k-25k, 3.9% for AGIs $25k-50k, 4.3% for AGIs $50k-75k, 4.1% for AGIs $75k-100k, 2.7% for AGIs over 100k)
Net capital gain/loss: +$17,492 (reported on 42.9% of returns)
Here:
+$17,492
State:
+$13,591
(% of AGI for various income ranges: -21.6% for AGIs below $10k, 2.2% for AGIs $10k-25k, 0.7% for AGIs $25k-50k, 2.7% for AGIs $50k-75k, 2.3% for AGIs $75k-100k, 15.8% for AGIs over 100k)
Profit/loss from business: +$27,580 (reported on 16.6% of returns)
Here:
+$27,580
State:
+$17,520
(% of AGI for various income ranges: 5.2% for AGIs below $10k, 6.6% for AGIs $10k-25k, 4.9% for AGIs $25k-50k, 4.5% for AGIs $50k-75k, 5.2% for AGIs $75k-100k, 7.1% for AGIs over 100k)
IRA payment deduction: $3,727 (reported on 4.4% of returns)
08402:
$3,727
New Jersey:
$3,270
(% of AGI for various income ranges: 0.5% for AGIs $10k-25k, 0.6% for AGIs $25k-50k, 0.2% for AGIs $50k-75k, 0.3% for AGIs $75k-100k, 0.1% for AGIs over 100k)
Self-employed pension: $17,957 (reported on 2.3% of returns)
Here:
$17,957
New Jersey:
$17,258
Total itemized deductions: $24,935 (21% of AGI, reported on 50.2% of returns)
Here:
$24,935
State:
$23,924
Here:
21.2% of AGI
State:
21.1% of AGI
(% of AGI for various income ranges: 82.1% for AGIs below $10k, 23.0% for AGIs $10k-25k, 19.1% for AGIs $25k-50k, 19.8% for AGIs $50k-75k, 19.8% for AGIs $75k-100k, 15.3% for AGIs over 100k)
Charity contributions deductions: $3,531 (3% of AGI, reported on 46.6% of returns)
Here:
$3,531
State:
$3,242
Here:
2.9% of AGI
State:
2.7% of AGI
(% of AGI for various income ranges: 2.9% for AGIs below $10k, 1.9% for AGIs $10k-25k, 1.9% for AGIs $25k-50k, 2.3% for AGIs $50k-75k, 2.6% for AGIs $75k-100k, 2.3% for AGIs over 100k)
Total tax: $14,603 (reported on 80.2% of returns)
08402:
$14,603
State:
$12,321
(% of AGI for various income ranges: 5.5% for AGIs below $10k, 4.5% for AGIs $10k-25k, 8.3% for AGIs $25k-50k, 10.5% for AGIs $50k-75k, 11.4% for AGIs $75k-100k, 20.6% for AGIs over 100k)
Earned income credit: $1,328 (reported on 5.9% of returns)
Here:
$1,328
State:
$1,711
Percentage of individuals using paid preparers for their 2004 taxes: 75.5%
Here:
75%
State:
65%
(% for various income ranges: 73.2% for AGIs below $10k, 72.2% for AGIs $10k-25k, 70.5% for AGIs $25k-50k, 74.6% for AGIs $50k-75k, 78.8% for AGIs $75k-100k, 87.0% for AGIs over 100k)
Household received Food Stamps/SNAP in the past 12 months: 38 Household did not receive Food Stamps/SNAP in the past 12 months: 2,578
Women who had a birth in the past 12 months: 23 (24 now married, 0 unmarried) Women who did not have a birth in the past 12 months: 804 (341 now married, 462 unmarried)
Housing units in zip code 08402 with a mortgage: 1,181 (109 second mortgage, 89 both second mortgage and home equity loan) Houses without a mortgage: 50
Median monthly owner costs for units with a mortgage: $2,788 Median monthly owner costs for units without a mortgage: $1,040
Residents with income below the poverty level in 2022:
This zip code:
5.4%
Whole state:
9.7%
Residents with income below 50% of the poverty level in 2022:
This zip code:
2.5%
Whole state:
5.2%
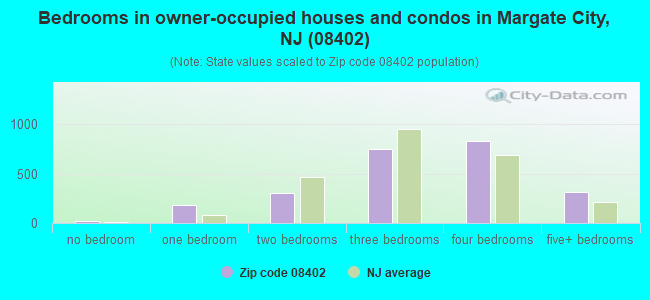
Median number of rooms in houses and condos:
Here:
7.1
State:
6.8
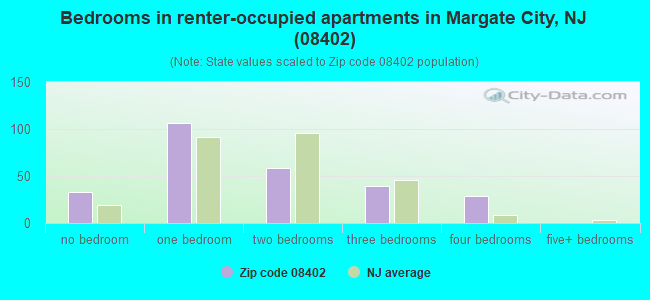
Median number of rooms in apartments:
Here:
3.3
State:
3.9
Notable locations in this zip code not listed on our city pages
Notable locations in zip code 08402: Margate Pier (A), Margate City Fire Department Station 2 (B), Lucy, The Margate Elephant (C), Margate City Fire Department Station 1 (D). Display/hide their locations on the map
In group quarters: 4 (-1 institutionalized population)
Size of family households: 1,154 2-persons, 258 3-persons, 174 4-persons, 117 5-persons
Size of nonfamily households: 866 1-person, 82 2-persons
652 married couples with children.
97 single-parent households (15 men, 82 women).
92.1% of residents of 08402 zip code speak English at home.
1.9% of residents speak Spanish at home (47% very well, 44% well, 9% not well).
3.4% of residents speak other Indo-European language at home (97% very well, 3% not well).
2.2% of residents speak Asian or Pacific Island language at home (48% very well, 40% well, 11% not well).
1.2% of residents speak other language at home (100% very well).
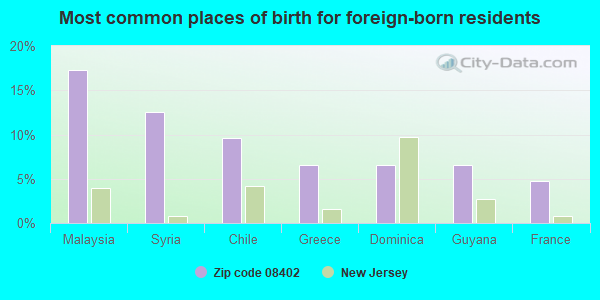
Foreign born population: 336 (6.3%) (84.4% of them are naturalized citizens)
This zip code:
6.3%
Whole state:
23.5%
17%Malaysia
13%Syria
10%Chile
7%Greece
7%Dominica
7%Guyana
5%France
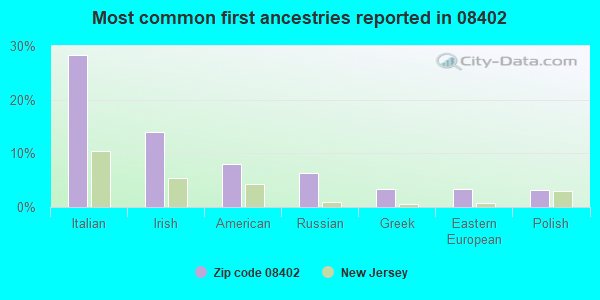
28%Italian
14%Irish
8%American
6%Russian
3%Greek
3%Eastern European
3%Polish
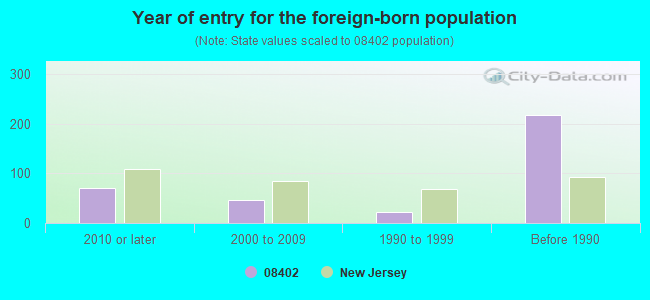
Year of entry for the foreign-born population
702010 or later
462000 to 2009
221990 to 1999
218Before 1990
Facilities with environmental interests located in this zip code:
303 N PEMBROKE AVENUE (303 N PEMBROKE AVE in MARGATE, NJ)
(Resource Conservation and Recovery Act (tracking hazardous waste))
EXXON CO USA 30155 (7901 VENTOUR AVE in MARGATE, NJ)
(Resource Conservation and Recovery Act (tracking hazardous waste))
Housing units lacking complete kitchen facilities: 0.6%
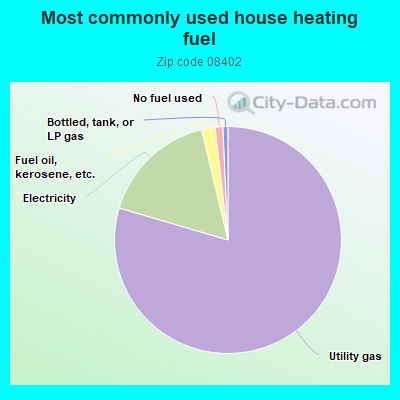
79.4%Utility gas
16.7%Electricity
1.9%Fuel oil, kerosene, etc.
1.1%No fuel used
0.7%Bottled, tank, or LP gas
Population in 1990: 9,484.
Place of birth for U.S.-born residents:
This state: 2,046
Northeast: 2,773
Midwest: 25
South: 130
West: 30
62% of the 08402 zip code residents lived in the same house 5 years ago. Out of people who lived in different houses, 56% lived in this county. Out of people who lived in different counties, 50% lived in New Jersey.
91% of the 08402 zip code residents lived in the same house 1 year ago. Out of people who lived in different houses, 47% moved from this county. Out of people who lived in different houses, 18% moved from different county within same state. Out of people who lived in different houses, 34% moved from different state. Out of people who lived in different houses, 2% moved from abroad.
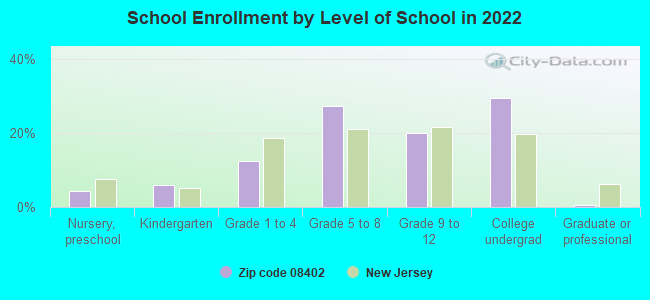
Private vs. public school enrollment:
Students in private schools in grades 1 to 8 (elementary and middle school): 68
Here:
15.8%
New Jersey:
12.3%
Students in private schools in grades 9 to 12 (high school): 62
Here:
28.8%
New Jersey:
13.1%
Students in private undergraduate colleges: 70
Here:
22.6%
New Jersey:
33.2%
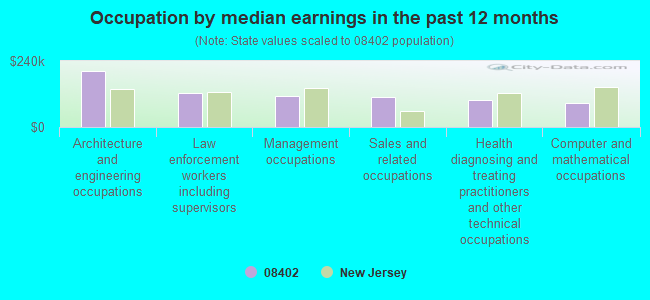
Occupation by median earnings in the past 12 months ($)
205,287Architecture and engineering occupations
123,726Law enforcement workers including supervisors
113,486Management occupations
109,626Sales and related occupations
98,629Health diagnosing and treating practitioners and other technical occupations
87,038Computer and mathematical occupations
Top industries in this zip code by the number of employees in 2005:
Administrative and Support and Waste Management and Remediation Services: Janitorial Services (20-49: 1, 10-19: 1, 1-4: 1)
Other Services (except Public Administration): Other Similar Organizations (except Business, Professional, Labor, and Political Organizations) (20-49: 1, 5-9: 2, 1-4: 1)
People in group quarters in 2000:
2 people in religious group quarters
2 people in other nonhousehold living situations
Home Mortgage Disclosure Act Aggregated Statistics For Year 2009 (Based on 4 partial tracts)
A) FHA, FSA/RHS & VA Home Purchase Loans
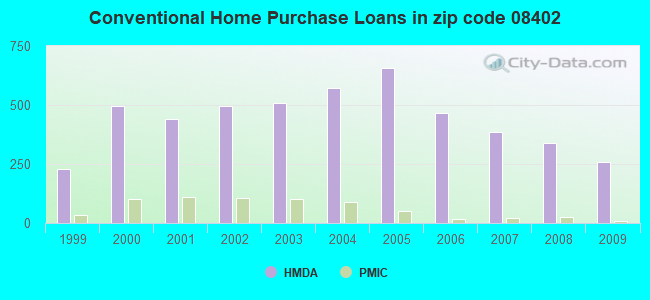
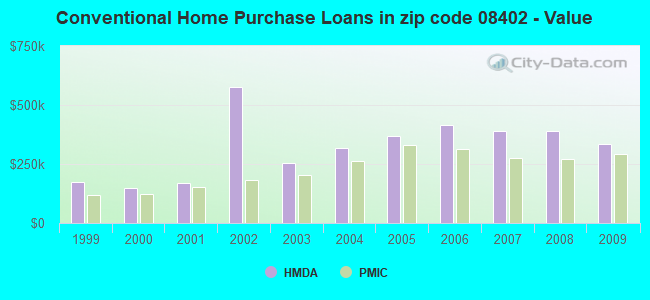
B) Conventional Home Purchase Loans
C) Refinancings
D) Home Improvement Loans
E) Loans on Dwellings For 5+ Families
F) Non-occupant Loans on < 5 Family Dwellings (A B C & D)
Number
Average Value
Number
Average Value
Number
Average Value
Number
Average Value
Number
Average Value
Number
Average Value
LOANS ORIGINATED
11
$321,347
258
$334,008
829
$314,686
26
$347,391
4
$1,204,620
694
$331,684
APPLICATIONS APPROVED, NOT ACCEPTED
2
$284,025
14
$327,328
69
$345,007
2
$3,325
0
$0
55
$326,207
APPLICATIONS DENIED
5
$275,970
31
$417,363
253
$346,679
15
$54,342
0
$0
154
$362,471
APPLICATIONS WITHDRAWN
0
$0
35
$447,521
176
$317,804
4
$207,265
2
$294,140
98
$343,514
FILES CLOSED FOR INCOMPLETENESS
2
$218,625
12
$301,321
40
$303,271
2
$96,235
0
$0
34
$297,365
Aggregated Statistics For Year 2008 (Based on 4 partial tracts)
A) FHA, FSA/RHS & VA Home Purchase Loans
B) Conventional Home Purchase Loans
C) Refinancings
D) Home Improvement Loans
E) Loans on Dwellings For 5+ Families
F) Non-occupant Loans on < 5 Family Dwellings (A B C & D)
Number
Average Value
Number
Average Value
Number
Average Value
Number
Average Value
Number
Average Value
Number
Average Value
LOANS ORIGINATED
5
$261,642
341
$388,462
376
$321,874
36
$246,388
3
$3,658,730
451
$373,593
APPLICATIONS APPROVED, NOT ACCEPTED
0
$0
26
$392,749
84
$356,403
5
$264,042
0
$0
67
$306,470
APPLICATIONS DENIED
2
$122,140
48
$346,558
132
$342,928
11
$27,185
0
$0
78
$329,031
APPLICATIONS WITHDRAWN
5
$211,380
64
$357,164
67
$305,297
5
$124,694
0
$0
72
$319,644
FILES CLOSED FOR INCOMPLETENESS
0
$0
4
$437,902
12
$460,051
2
$93,430
0
$0
7
$495,929
Aggregated Statistics For Year 2007 (Based on 4 partial tracts)
B) Conventional Home Purchase Loans
C) Refinancings
D) Home Improvement Loans
F) Non-occupant Loans on < 5 Family Dwellings (A B C & D)
Number
Average Value
Number
Average Value
Number
Average Value
Number
Average Value
LOANS ORIGINATED
384
$388,872
464
$358,482
103
$116,096
460
$360,441
APPLICATIONS APPROVED, NOT ACCEPTED
62
$341,935
116
$384,917
17
$58,159
82
$415,746
APPLICATIONS DENIED
40
$378,956
228
$410,433
51
$117,197
101
$406,908
APPLICATIONS WITHDRAWN
33
$382,389
101
$378,811
7
$261,610
53
$434,525
FILES CLOSED FOR INCOMPLETENESS
26
$389,728
21
$588,266
2
$306,450
14
$379,451
Aggregated Statistics For Year 2006 (Based on 4 partial tracts)
B) Conventional Home Purchase Loans
C) Refinancings
D) Home Improvement Loans
E) Loans on Dwellings For 5+ Families
F) Non-occupant Loans on < 5 Family Dwellings (A B C & D)
Number
Average Value
Number
Average Value
Number
Average Value
Number
Average Value
Number
Average Value
LOANS ORIGINATED
465
$414,051
525
$365,136
106
$81,566
3
$701,833
571
$380,388
APPLICATIONS APPROVED, NOT ACCEPTED
38
$383,523
108
$281,349
14
$70,955
2
$1,167,875
75
$378,229
APPLICATIONS DENIED
72
$432,056
168
$511,983
40
$59,848
0
$0
121
$437,155
APPLICATIONS WITHDRAWN
61
$523,722
135
$390,206
11
$195,475
0
$0
88
$449,585
FILES CLOSED FOR INCOMPLETENESS
7
$398,114
31
$399,035
4
$845,542
0
$0
14
$288,499
Aggregated Statistics For Year 2005 (Based on 4 partial tracts)
B) Conventional Home Purchase Loans
C) Refinancings
D) Home Improvement Loans
E) Loans on Dwellings For 5+ Families
F) Non-occupant Loans on < 5 Family Dwellings (A B C & D)
G) Loans On Manufactured Home Dwelling (A B C & D)
Number
Average Value
Number
Average Value
Number
Average Value
Number
Average Value
Number
Average Value
Number
Average Value
LOANS ORIGINATED
658
$369,901
654
$304,908
104
$188,933
0
$0
750
$367,046
2
$50,685
APPLICATIONS APPROVED, NOT ACCEPTED
57
$324,586
104
$257,448
14
$131,427
0
$0
72
$304,187
0
$0
APPLICATIONS DENIED
114
$446,315
190
$364,956
38
$85,194
2
$24,925
129
$425,796
0
$0
APPLICATIONS WITHDRAWN
88
$400,090
167
$283,584
12
$282,484
0
$0
105
$333,512
2
$51,515
FILES CLOSED FOR INCOMPLETENESS
7
$306,741
28
$346,226
2
$116,790
0
$0
9
$325,471
0
$0
Aggregated Statistics For Year 2004 (Based on 4 partial tracts)
A) FHA, FSA/RHS & VA Home Purchase Loans
B) Conventional Home Purchase Loans
C) Refinancings
D) Home Improvement Loans
E) Loans on Dwellings For 5+ Families
F) Non-occupant Loans on < 5 Family Dwellings (A B C & D)
G) Loans On Manufactured Home Dwelling (A B C & D)
Number
Average Value
Number
Average Value
Number
Average Value
Number
Average Value
Number
Average Value
Number
Average Value
Number
Average Value
LOANS ORIGINATED
2
$103,030
574
$317,204
654
$252,929
67
$71,344
4
$300,845
662
$295,947
2
$93,430
APPLICATIONS APPROVED, NOT ACCEPTED
0
$0
66
$318,581
99
$192,102
23
$125,697
0
$0
63
$245,910
0
$0
APPLICATIONS DENIED
0
$0
83
$328,996
160
$271,703
41
$66,727
0
$0
109
$239,502
4
$26,432
APPLICATIONS WITHDRAWN
0
$0
81
$412,645
156
$214,471
9
$181,708
0
$0
76
$400,274
0
$0
FILES CLOSED FOR INCOMPLETENESS
0
$0
21
$239,868
38
$213,324
9
$55,482
0
$0
28
$208,867
0
$0
Aggregated Statistics For Year 2003 (Based on 4 partial tracts)
A) FHA, FSA/RHS & VA Home Purchase Loans
B) Conventional Home Purchase Loans
C) Refinancings
D) Home Improvement Loans
F) Non-occupant Loans on < 5 Family Dwellings (A B C & D)
Number
Average Value
Number
Average Value
Number
Average Value
Number
Average Value
Number
Average Value
LOANS ORIGINATED
2
$75,610
507
$253,193
1,652
$195,596
60
$87,676
1,019
$222,046
APPLICATIONS APPROVED, NOT ACCEPTED
0
$0
56
$249,874
234
$179,835
12
$84,029
105
$198,815
APPLICATIONS DENIED
0
$0
53
$253,649
268
$219,703
24
$85,869
121
$225,792
APPLICATIONS WITHDRAWN
0
$0
47
$324,294
191
$231,286
7
$53,853
64
$186,687
FILES CLOSED FOR INCOMPLETENESS
0
$0
21
$263,794
66
$206,842
2
$34,900
34
$307,588
Aggregated Statistics For Year 2002 (Based on 4 partial tracts)
A) FHA, FSA/RHS & VA Home Purchase Loans
B) Conventional Home Purchase Loans
C) Refinancings
D) Home Improvement Loans
E) Loans on Dwellings For 5+ Families
F) Non-occupant Loans on < 5 Family Dwellings (A B C & D)
Number
Average Value
Number
Average Value
Number
Average Value
Number
Average Value
Number
Average Value
Number
Average Value
LOANS ORIGINATED
3
$132,943
494
$574,460
1,124
$397,798
80
$74,531
2
$259,240
776
$670,011
APPLICATIONS APPROVED, NOT ACCEPTED
0
$0
53
$202,860
145
$175,865
14
$93,716
0
$0
54
$245,676
APPLICATIONS DENIED
2
$126,130
35
$169,594
167
$170,050
42
$43,039
0
$0
43
$175,887
APPLICATIONS WITHDRAWN
0
$0
42
$165,855
166
$217,806
7
$44,447
0
$0
51
$192,793
FILES CLOSED FOR INCOMPLETENESS
0
$0
18
$268,692
54
$167,279
7
$81,791
0
$0
28
$202,260
Aggregated Statistics For Year 2001 (Based on 4 partial tracts)
A) FHA, FSA/RHS & VA Home Purchase Loans
B) Conventional Home Purchase Loans
C) Refinancings
D) Home Improvement Loans
E) Loans on Dwellings For 5+ Families
F) Non-occupant Loans on < 5 Family Dwellings (A B C & D)
Number
Average Value
Number
Average Value
Number
Average Value
Number
Average Value
Number
Average Value
Number
Average Value
LOANS ORIGINATED
9
$128,753
439
$170,269
742
$182,471
78
$49,625
2
$465,305
486
$191,899
APPLICATIONS APPROVED, NOT ACCEPTED
0
$0
48
$213,815
71
$135,426
16
$34,308
0
$0
47
$207,705
APPLICATIONS DENIED
0
$0
44
$148,158
154
$172,074
31
$46,734
0
$0
62
$186,621
APPLICATIONS WITHDRAWN
0
$0
43
$137,027
103
$185,071
9
$69,907
0
$0
27
$158,170
FILES CLOSED FOR INCOMPLETENESS
0
$0
11
$239,290
37
$272,493
2
$18,685
0
$0
14
$260,671
Aggregated Statistics For Year 2000 (Based on 4 partial tracts)
A) FHA, FSA/RHS & VA Home Purchase Loans
B) Conventional Home Purchase Loans
C) Refinancings
D) Home Improvement Loans
F) Non-occupant Loans on < 5 Family Dwellings (A B C & D)
Number
Average Value
Number
Average Value
Number
Average Value
Number
Average Value
Number
Average Value
LOANS ORIGINATED
12
$133,246
497
$149,467
178
$152,968
75
$51,485
282
$154,805
APPLICATIONS APPROVED, NOT ACCEPTED
0
$0
43
$174,037
49
$92,348
25
$52,442
25
$167,983
APPLICATIONS DENIED
0
$0
48
$151,945
113
$101,460
47
$51,341
28
$119,901
APPLICATIONS WITHDRAWN
2
$64,465
51
$156,116
61
$139,292
16
$24,463
33
$157,452
FILES CLOSED FOR INCOMPLETENESS
0
$0
9
$192,047
12
$154,573
0
$0
4
$226,965
Aggregated Statistics For Year 1999 (Based on 2 partial tracts)
A) FHA, FSA/RHS & VA Home Purchase Loans
B) Conventional Home Purchase Loans
C) Refinancings
D) Home Improvement Loans
F) Non-occupant Loans on < 5 Family Dwellings (A B C & D)
Detailed PMIC statistics for the following Tracts:0130.00
, 0131.00
2002 - 2018 National Fire Incident Reporting System (NFIRS) incidents
According to the data from the years 2002 - 2018 the average number of fires per year is 23. The highest number of reported fire incidents - 38 took place in 2005, and the least - 0 in 2003. The data has a decreasing trend.
When looking into fire subcategories, the most incidents belonged to: Structure Fires (46.7%), and Outside Fires (36.5%).
Fire incident types reported to NFIRS in Zip Code 08402


 Nearest zip codes: 08406, 08403, 08225, 08232, 08221, 08401.


 According to the data from the years 2002 - 2018 the average number of fires per year is 23. The highest number of reported fire incidents - 38 took place in 2005, and the least - 0 in 2003. The data has a decreasing trend.
 When looking into fire subcategories, the most incidents belonged to: Structure Fires (46.7%), and Outside Fires (36.5%).