Estimated zip code population in 2022: 12,816 Zip code population in 2010: 13,546 Zip code population in 2000: 15,166
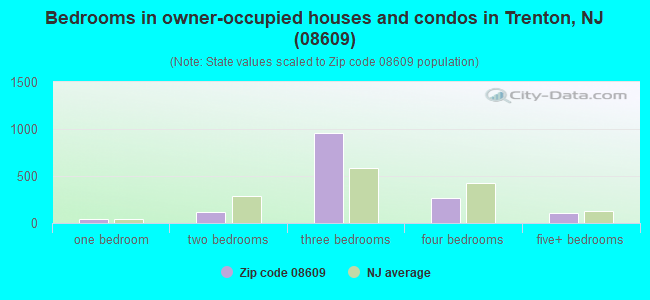
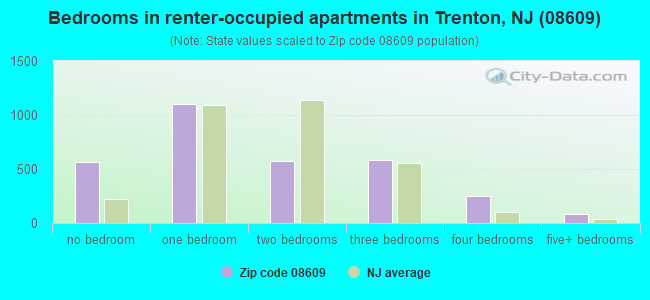
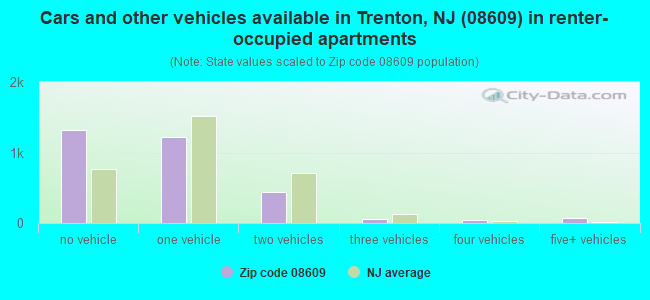
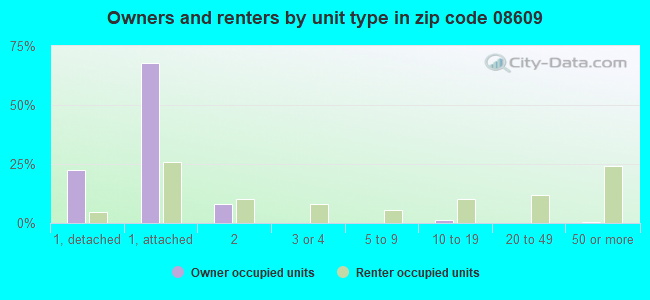
Houses and condos: 5,449 Renter-occupied apartments: 3,169
% of renters here:
68%
State:
35%
March 2022 cost of living index in zip code 08609: 108.6 (more than average, U.S. average is 100)
Land area: 1.4 sq. mi. Water area: 0.0 sq. mi.
Population density: 9,423 people per square mile
(high).
OSM Map
Google Map
MSN Map
OSM Map
General Map
Google Map
MSN Map
OSM Map
Google Map
MSN Map
OSM Map
Google Map
MSN Map
Please wait while loading the map...
Real estate property taxes paid for housing units in 2022:
This zip code:
2.8% ($2,729)
New Jersey:
2.1% ($8,897)
Median real estate property taxes paid for housing units with mortgages in 2022: $4,721 (2.5%) Median real estate property taxes paid for housing units with no mortgage in 2022: $2,466 (3.1%)
Averages for the 2020 tax year for zip code 08609, filed in 2021:
Average Adjusted Gross Income (AGI) in 2020: $30,992 (Individual Income Tax Returns)
Here:
$30,992
State:
$95,247
Salary/wage: $29,894 (reported on 87.2% of returns)
Here:
$29,894
State:
$80,635
(% of AGI for various income ranges: 1324.7% for AGIs below $25k, 3815.7% for AGIs $25k-50k, 6892.7% for AGIs $50k-75k, 9930.0% for AGIs $75k-100k, 16852.5% for AGIs $100k-200k)
Taxable interest for individuals: $380 (reported on 5.5% of returns)
This zip code:
$380
New Jersey:
$2,414
(% of AGI for various income ranges: 0.9% for AGIs below $25k, 1.3% for AGIs $25k-50k, 10.2% for AGIs $50k-75k, 14.0% for AGIs $75k-100k, 18.8% for AGIs $100k-200k)
Ordinary dividends: $723 (reported on 2.1% of returns)
Here:
$723
State:
$8,057
(% of AGI for various income ranges: 1.3% for AGIs below $25k, 2.3% for AGIs $25k-50k, 1.0% for AGIs $50k-75k, 11.3% for AGIs $75k-100k)
Net capital gain/loss in AGI: +$1,286 (reported on 2.2% of returns)
Here:
+$1,286
State:
+$25,022
(% of AGI for various income ranges: 1.8% for AGIs below $25k, 4.1% for AGIs $25k-50k, 7.1% for AGIs $50k-75k, 18.0% for AGIs $75k-100k)
Profit/loss from business: +$2,609 (reported on 15.5% of returns)
Here:
+$2,609
State:
+$18,035
(% of AGI for various income ranges: 106.4% for AGIs below $25k, 200.7% for AGIs $75k-100k)
Taxable individual retirement arrangement distribution: $6,717 (reported on 0.9% of returns)
08609:
$6,717
New Jersey:
$21,558
(% of AGI for various income ranges: 21.8% for AGIs $25k-50k)
Total itemized deductions: $29,222 (reported on 5.1% of returns)
Here:
$29,222
State:
$32,863
(% of AGI for various income ranges: 25.7% for AGIs below $25k, 208.7% for AGIs $25k-50k, 549.8% for AGIs $50k-75k, 654.7% for AGIs $75k-100k, 1330.0% for AGIs $100k-200k)
Charity contributions: $8,321 (reported on 4.6% of returns)
Here:
$8,321
State:
$7,880
(% of AGI for various income ranges: 43.1% for AGIs $25k-50k, 166.2% for AGIs $50k-75k, 265.3% for AGIs $75k-100k, 441.2% for AGIs $100k-200k)
Taxes paid: $6,116 (reported on 5.1% of returns)
08609:
$6,116
State:
$9,183
(% of AGI for various income ranges: 45.4% for AGIs $25k-50k, 118.8% for AGIs $50k-75k, 142.7% for AGIs $75k-100k, 357.5% for AGIs $100k-200k)
Earned income credit: $2,359 (reported on 32.5% of returns)
Here:
$2,359
State:
$2,148
(% of AGI for various income ranges: 137.3% for AGIs below $25k, 93.5% for AGIs $25k-50k)
Percentage of individuals using paid preparers for their 2020 taxes: 90.4%
Here:
90%
State:
92%
(% for various income ranges: 88.4% for AGIs below $25k, 92.5% for AGIs $25k-50k, 91.2% for AGIs $50k-75k, 90.5% for AGIs $75k-100k, 92.3% for AGIs $100k-200k)
Averages for the 2012 tax year for zip code 08609, filed in 2013:
Average Adjusted Gross Income (AGI) in 2012: $27,311 (Individual Income Tax Returns)
Here:
$27,311
State:
$79,688
Salary/wage: $25,741 (reported on 89.0% of returns)
Here:
$25,741
State:
$68,122
(% of AGI for various income ranges: 79.1% for AGIs below $25k, 90.2% for AGIs $25k-50k, 84.1% for AGIs $50k-75k, 78.8% for AGIs $75k-100k, 74.0% for AGIs $100k-200k)
Taxable interest for individuals: $455 (reported on 8.7% of returns)
This zip code:
$455
New Jersey:
$2,193
(% of AGI for various income ranges: 0.2% for AGIs below $25k, 0.3% for AGIs $50k-75k, 0.1% for AGIs $75k-100k, 0.3% for AGIs $100k-200k)
Ordinary dividends: $1,207 (reported on 2.6% of returns)
Here:
$1,207
State:
$6,828
(% of AGI for various income ranges: 0.2% for AGIs below $25k, 0.3% for AGIs $50k-75k)
Net capital gain/loss in AGI: +$362 (reported on 1.5% of returns)
Here:
+$362
State:
+$15,358
(% of AGI for various income ranges: 0.6% for AGIs $25k-50k, 0.1% for AGIs $50k-75k)
Profit/loss from business: +$7,458 (reported on 8.4% of returns)
Here:
+$7,458
State:
+$19,577
(% of AGI for various income ranges: 6.3% for AGIs below $25k, 0.7% for AGIs $25k-50k, 1.6% for AGIs $50k-75k)
Taxable individual retirement arrangement distribution: $7,156 (reported on 1.7% of returns)
08609:
$7,156
New Jersey:
$18,214
(% of AGI for various income ranges: 0.3% for AGIs below $25k, 0.3% for AGIs $25k-50k, 1.2% for AGIs $50k-75k)
Total itemized deductions: $16,384 (32% of AGI, reported on 16.5% of returns)
Here:
$16,384
State:
$30,827
Here:
32.1% of AGI
State:
21.2% of AGI
(% of AGI for various income ranges: 4.4% for AGIs below $25k, 9.8% for AGIs $25k-50k, 13.4% for AGIs $50k-75k, 15.9% for AGIs $75k-100k, 15.2% for AGIs $100k-200k)
Charity contributions: $3,418 (reported on 13.2% of returns)
Here:
$3,418
State:
$3,451
(% of AGI for various income ranges: 0.5% for AGIs below $25k, 1.6% for AGIs $25k-50k, 2.6% for AGIs $50k-75k, 2.3% for AGIs $75k-100k, 2.9% for AGIs $100k-200k)
Taxes paid: $4,286 (reported on 16.4% of returns)
08609:
$4,286
State:
$15,801
(% of AGI for various income ranges: 1.0% for AGIs below $25k, 2.0% for AGIs $25k-50k, 4.0% for AGIs $50k-75k, 4.5% for AGIs $75k-100k, 5.6% for AGIs $100k-200k)
Earned income credit: $2,398 (reported on 38.3% of returns)
Here:
$2,398
State:
$2,182
(% of AGI for various income ranges: 9.8% for AGIs below $25k, 1.8% for AGIs $25k-50k)
Percentage of individuals using paid preparers for their 2012 taxes: 59.7%
Here:
60%
State:
65%
(% for various income ranges: 60.1% for AGIs below $25k, 59.3% for AGIs $25k-50k, 56.5% for AGIs $50k-75k, 68.8% for AGIs $75k-100k, 50.0% for AGIs $100k-200k)
Averages for the 2004 tax year for zip code 08609, filed in 2005:
Average Adjusted Gross Income (AGI) in 2004: $25,870 (Individual Income Tax Returns)
Here:
$25,870
State:
$64,921
Salary/wage: $25,094 (reported on 92.3% of returns)
Here:
$25,094
State:
$57,755
(% of AGI for various income ranges: 85.6% for AGIs below $10k, 86.4% for AGIs $10k-25k, 93.6% for AGIs $25k-50k, 90.2% for AGIs $50k-75k, 85.0% for AGIs $75k-100k, 77.9% for AGIs over 100k)
Taxable interest for individuals: $592 (reported on 16.7% of returns)
This zip code:
$592
New Jersey:
$2,068
(% of AGI for various income ranges: 1.0% for AGIs below $10k, 0.3% for AGIs $10k-25k, 0.4% for AGIs $25k-50k, 0.2% for AGIs $50k-75k, 0.3% for AGIs $75k-100k, 0.6% for AGIs over 100k)
Taxable dividends: $930 (reported on 4.3% of returns)
Here:
$930
State:
$3,959
(% of AGI for various income ranges: 0.4% for AGIs below $10k, 0.0% for AGIs $10k-25k, 0.1% for AGIs $25k-50k, 0.1% for AGIs $50k-75k, 0.0% for AGIs $75k-100k, 1.5% for AGIs over 100k)
Net capital gain/loss: +$304 (reported on 1.9% of returns)
Here:
+$304
State:
+$13,591
(% of AGI for various income ranges: -0.3% for AGIs below $10k, -0.0% for AGIs $10k-25k, -0.0% for AGIs $25k-50k, 0.1% for AGIs $50k-75k, 0.6% for AGIs $75k-100k)
Profit/loss from business: +$5,622 (reported on 5.6% of returns)
Here:
+$5,622
State:
+$17,520
(% of AGI for various income ranges: 6.8% for AGIs below $10k, 2.6% for AGIs $10k-25k, 0.5% for AGIs $25k-50k, 0.2% for AGIs $50k-75k, 0.4% for AGIs $75k-100k)
IRA payment deduction: $2,118 (reported on 0.6% of returns)
08609:
$2,118
New Jersey:
$3,270
Total itemized deductions: $14,325 (32% of AGI, reported on 19.9% of returns)
Here:
$14,325
State:
$23,924
Here:
32.0% of AGI
State:
21.1% of AGI
(% of AGI for various income ranges: 5.0% for AGIs below $10k, 7.5% for AGIs $10k-25k, 11.6% for AGIs $25k-50k, 13.6% for AGIs $50k-75k, 14.1% for AGIs $75k-100k, 15.0% for AGIs over 100k)
Charity contributions deductions: $2,975 (6% of AGI, reported on 17.8% of returns)
Here:
$2,975
State:
$3,242
Here:
6.5% of AGI
State:
2.7% of AGI
(% of AGI for various income ranges: 0.2% for AGIs below $10k, 1.0% for AGIs $10k-25k, 2.3% for AGIs $25k-50k, 2.6% for AGIs $50k-75k, 2.7% for AGIs $75k-100k, 3.8% for AGIs over 100k)
Total tax: $2,728 (reported on 56.6% of returns)
08609:
$2,728
State:
$12,321
(% of AGI for various income ranges: 1.5% for AGIs below $10k, 2.7% for AGIs $10k-25k, 5.4% for AGIs $25k-50k, 8.7% for AGIs $50k-75k, 10.6% for AGIs $75k-100k, 14.5% for AGIs over 100k)
Earned income credit: $1,877 (reported on 37.0% of returns)
Here:
$1,877
State:
$1,711
Percentage of individuals using paid preparers for their 2004 taxes: 65.5%
Here:
66%
State:
65%
(% for various income ranges: 57.6% for AGIs below $10k, 72.1% for AGIs $10k-25k, 64.9% for AGIs $25k-50k, 63.2% for AGIs $50k-75k, 61.3% for AGIs $75k-100k, 53.4% for AGIs over 100k)
Household received Food Stamps/SNAP in the past 12 months: 1,136 Household did not receive Food Stamps/SNAP in the past 12 months: 3,662
Women who had a birth in the past 12 months: 333 (175 now married, 153 unmarried) Women who did not have a birth in the past 12 months: 2,553 (755 now married, 1,804 unmarried)
Housing units in zip code 08609 with a mortgage: 462 (37 second mortgage, 31 both second mortgage and home equity loan) Houses without a mortgage: 3
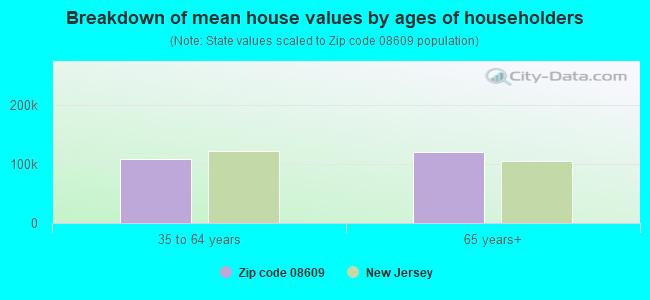
Median monthly owner costs for units with a mortgage: $1,463 Median monthly owner costs for units without a mortgage: $605
Residents with income below the poverty level in 2022:
This zip code:
21.8%
Whole state:
9.7%
Residents with income below 50% of the poverty level in 2022:
This zip code:
11.3%
Whole state:
5.2%
Median number of rooms in houses and condos:
Here:
6.3
State:
6.8
Median number of rooms in apartments:
Here:
3.8
State:
3.9
Notable locations in this zip code not listed on our city pages
Notable locations in zip code 08609: Trenton Fire and Emergency Services Engine 7 (A), Hamilton Fire District 4 Hamilton Fire Company (B). Display/hide their locations on the map
In group quarters: 346 (-1 institutionalized population)
Size of family households: 749 2-persons, 414 3-persons, 558 4-persons, 597 5-persons, 62 6-persons, 97 7-or-more-persons
Size of nonfamily households: 1,842 1-person, 358 2-persons, 48 5-persons
1,213 married couples with children.
1,461 single-parent households (235 men, 1,226 women).
53.6% of residents of 08609 zip code speak English at home.
33.3% of residents speak Spanish at home (45% very well, 30% well, 17% not well, 8% not at all).
8.9% of residents speak other Indo-European language at home (42% very well, 22% well, 36% not well).
0.5% of residents speak Asian or Pacific Island language at home (41% well, 59% not well).
3.7% of residents speak other language at home (92% very well, 8% well).
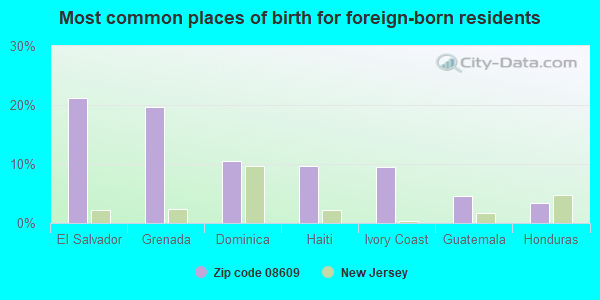
Foreign born population: 4,174 (32.6%) (27.4% of them are naturalized citizens)
Major facilities with environmental interests located in this zip code:
NJDOT SOUTHARD STREET BRIDGE (SOUTHARD ST in TRENTON CITY, NJ)
STATE MASTER (New Jersey environmental info) - NJEMS-159514, STATE CLEANUP SITE STATE MASTER (New Jersey environmental info) - NJEMS-1111-02-0002.1, LAND USE - COASTAL AND LAND USE, NJEMS-243923, National Pollutant Discharge Elimination System Permit National Pollutant Discharge Elimination System NON-MAJOR (Tracking pollutant discharge elimination systems) - permit Organizations: NJDOT BUREAU OF FACILITIES PLNG & ENG, NJDOT DIV OF PROJECT MGMT (CONTACT/OWNER)
, NJDOT BUREAU OF FACILITIES PLNG & ENG (CONTACT/OWNER)
Alternative names: NJDOT SOUTHARD ST BRIDGE
HAMILTON TWP MUNICIPAL BUILDING (2090 GREENWOOD AVE in HAMILTON TWP, NJ)
STATE MASTER (New Jersey environmental info) - NJEMS-015807, STATE CLEANUP SITE, NJEMS-198044, National Pollutant Discharge Elimination System Permit National Pollutant Discharge Elimination System NON-MAJOR (Tracking pollutant discharge elimination systems) - permit
GUARDIAN DRUG CO INC (72 PRINCE ST in TRENTON, NJ)
STATE MASTER (New Jersey environmental info) - NJEMS-NJ0002078384, HAZARDOUS WASTE PROGRAM Conditionally Exempt Small Quantity Generators, less than 100 kg/month of hazardous waste (Resource Conservation and Recovery Act (tracking hazardous waste)) - notification (Resource Conservation and Recovery Act (tracking hazardous waste)) Organizations: DELAWARE VALLEY WHSE (CONTACT/OWNER)
, UNKNOWN (CONTACT/OWNER)
BOBS PHILLIPS 66 SERVICE STATION (1741 GREENWOOD AVE in TRENTON, NJ)
STATE MASTER (New Jersey environmental info) - NJEMS-008890, STATE CLEANUP SITE, NJEMS-A6251, AIR PROGRAM (Resource Conservation and Recovery Act (tracking hazardous waste)) Business SIC classification: GASOLINE SERVICE STATIONS Organizations: SCIARROTTA ROBERT (CONTACT/OWNER)
Alternative names: BOBS 66
GREENWOOD SHELL SERVICE STATION #138528 & FOOD MART (800 GREENWOOD in TRENTON, NJ)
STATE MASTER (New Jersey environmental info) - NJEMS-007618, STATE CLEANUP SITE, NJEMS-69064700000, EPCRA, NJEMS-A6215, AIR PROGRAM Small Quantity Generators, between 100 kg and 1000 kg of hazardous waste/month (Resource Conservation and Recovery Act (tracking hazardous waste)) - notification Business SIC classification: GASOLINE SERVICE STATIONS Organizations: MOTIVA ENTERPRISES LLC Alternative names: SHELL OIL CO
AMERADA HESS SERVICE STATION #30223 (1517 N OLDEN RD in TRENTON, NJ)
STATE MASTER (New Jersey environmental info) - NJEMS-007650, STATE CLEANUP SITE (Resource Conservation and Recovery Act (tracking hazardous waste)) Organizations: CENTRAL FIDELITY BANK (CONTACT/OWNER)
Alternative names: AMERADA HESS STA 30223, AMERADA HESS SERVICE STATION 30223
BENTON GRAPHICS INC (74 PARKER AVE in TRENTON, NJ)
STATE MASTER (New Jersey environmental info) - NJEMS-025685, STATE CLEANUP SITE (Resource Conservation and Recovery Act (tracking hazardous waste)) Organizations: BENTON RUFUS & MARY (CONTACT/OWNER)
OWENS COLLEGE CLEANERS FORMER (3 S CLINTON AVE in TRENTON, NJ)
STATE MASTER (New Jersey environmental info) - NJEMS-015070, STATE CLEANUP SITE (Resource Conservation and Recovery Act (tracking hazardous waste)) Organizations: SIMON JOHN A (CONTACT/OWNER)
Alternative names: OWEN COLLEGE CLEANERS INC
HARVEY COHEN INC (76 LINCOLN AVE in TRENTON, NJ)
STATE MASTER (New Jersey environmental info) - NJEMS-005154, STATE CLEANUP SITE (Resource Conservation and Recovery Act (tracking hazardous waste)) Organizations: CHESTER COHEN (CONTACT/OWNER)
AMERICAN PROPERTIES CORPORATION FORMER LIBERTY LIGHTING FACILITY (720 MONMOUTH STREET in TRENTON, NJ)
AIR MINOR (AIRS/AFS) Conditionally Exempt Small Quantity Generators, less than 100 kg/month of hazardous waste (Resource Conservation and Recovery Act (tracking hazardous waste)) - notification TRI REPORTER (Tracking of toxic chemicals releasing facilities) Business SIC classification: CURRENT-CARRYING WIRING DEVICES Business NAICS classification: CURRENT-CARRYING WIRING DEVICE MANUFACTURING. Alternative names: LIBERTY CIRCLE F
NJ ECONOMIC DEVELOPMENT AUTH (1 JOHNSTON AVE in HAMILTON, NJ)
STATE MASTER (New Jersey environmental info) - NJEMS-G000002712, STATE CLEANUP SITE (Resource Conservation and Recovery Act (tracking hazardous waste))
GRANVILLE CHARTER HIGH SCHOOL (50 NORTH CLINTON AVE in TRENTON, NJ)
COMPLIANCE ACTIVITY (Tracking inspections of insecticide, fungicide, and rodenticide, and toxic substances) STATE MASTER (New Jersey environmental info) - NJEMS-022577, STATE CLEANUP SITE Organizations: CRESCENT TEMPLE AAONMS (CONTACT/OWNER)
GRANT (159 N. CLINTON AVENUE in TRENTON, NJ)
(National Center for Education Statistics) - STATE ID-200 Organizations: TRENTON CITY (SCHOOL DISTRICT)
Housing units lacking complete plumbing facilities: 0.8% Housing units lacking complete kitchen facilities: 2.5%
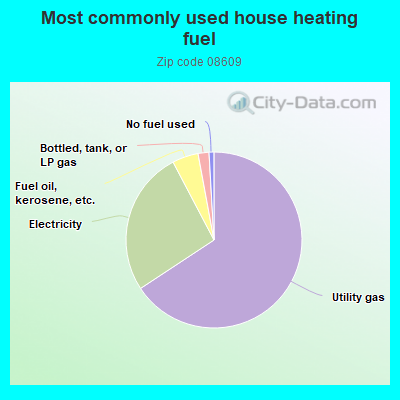
65.8%Utility gas
26.6%Electricity
4.8%Fuel oil, kerosene, etc.
2.0%Bottled, tank, or LP gas
0.9%No fuel used
Population in 1990: 15,904.
Place of birth for U.S.-born residents:
This state: 6,020
Northeast: 823
Midwest: 63
South: 750
57% of the 08609 zip code residents lived in the same house 5 years ago. Out of people who lived in different houses, 79% lived in this county. Out of people who lived in different counties, 50% lived in New Jersey.
85% of the 08609 zip code residents lived in the same house 1 year ago. Out of people who lived in different houses, 66% moved from this county. Out of people who lived in different houses, 21% moved from different county within same state. Out of people who lived in different houses, 5% moved from different state.
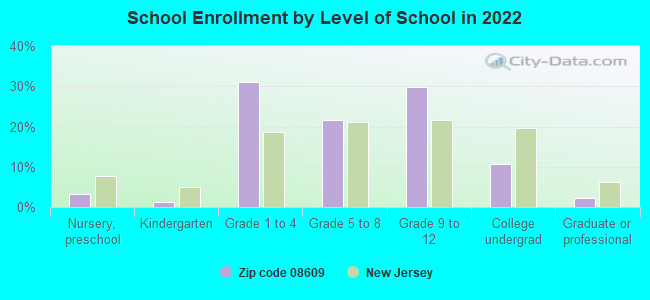
Private vs. public school enrollment:
Students in private schools in grades 1 to 8 (elementary and middle school): 28
Here:
2.0%
New Jersey:
12.3%
Students in private schools in grades 9 to 12 (high school): 91
Here:
11.3%
New Jersey:
13.1%
Students in private undergraduate colleges: 26
Here:
9.4%
New Jersey:
33.2%
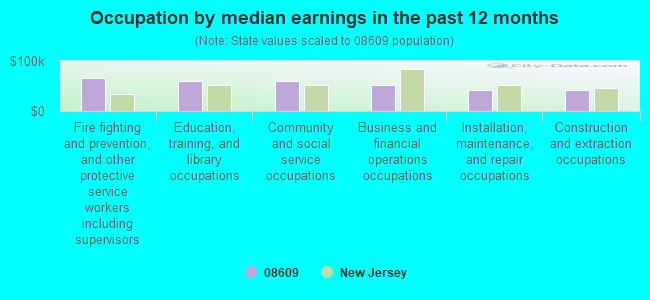
Occupation by median earnings in the past 12 months ($)
65,706Fire fighting and prevention, and other protective service workers including supervisors
60,051Education, training, and library occupations
59,873Community and social service occupations
51,194Business and financial operations occupations
42,897Installation, maintenance, and repair occupations
41,204Construction and extraction occupations
Companies with federal contracts located in this zip code (TRENTON, NJ):
MERLIN INDUSTRIES INC (70 CULBERTSON AVE; small business) : $6,571,090 in 7 contractsfrom 2004 to 2005
Contracts for Prefabricated and Portable Buildings by Army Signed by year:2000: $0; 2001: $0; 2002: $0; 2003: $0; 2004: $5,014,290; 2005: $1,556,800; 2006: $0.
Biggest contracts:
$2,759,400 with Army for Prefabricated and Portable Buildings. Signed on 2004-05-05. Completion date: 2004-05-07.
$1,223,700, same as above.Signed on 2004-11-05. Completion date: 2004-05-07.
$1,159,000, same as above.Signed on 2005-04-12. Completion date: 2004-05-07.
$983,030, same as above.Signed on 2004-08-02. Completion date: 2004-05-07.
PROSERVICES, CORP (1800 E STATE ST; small business) : $529,000 in 3 contractsin 2003
$360,000 with Army for Programming Services. Signed on 2003-09-30. Completion date: 2004-05-24.
$99,000, same as above.Signed on 2003-04-02. Completion date: 2003-06-03.
$70,000 with Army for Defense Missile and Space Systems -- Advanced Development (R&D). Signed on 2003-07-25. Completion date: 2004-01-25.
ALLIED EQUIPMENT CO INC (478 HAMILTON AVE; small business)
$31,000 with Army for Maintenance, Repair or Alteration of Real Property -- Conference Space and Facilities. Signed on 2002-08-04. Completion date: 2002-10-21.
EMR POWER SYSTEMS, LLC (809 E STATE ST; small business)
$17,196 with Army for Miscellaneous Special Industry Machinery. Signed on 2004-09-29. Completion date: 2004-11-10.
Top industries in this zip code by the number of employees in 2005:
Construction: Highway, Street, and Bridge Construction (100-249 employees: 1 establishment, 5-9 employees: 1 establishment)
Health Care and Social Assistance: Other Individual and Family Services (50-99: 1, 20-49: 1, 10-19: 1, 5-9: 1, 1-4: 1)
Other Services (except Public Administration): Religious Organizations (20-49: 2, 10-19: 1, 5-9: 3, 1-4: 3)
Accommodation and Food Services: Food Service Contractors (50-99: 1)
Professional, Scientific, and Technical Services: Tax Preparation Services (50-99: 1)
Real Estate and Rental and Leasing: Lessors of Nonresidential Buildings (except Miniwarehouses) (50-99: 1)
People in group quarters in 2010:
270 people in emergency and transitional shelters (with sleeping facilities) for people experiencing homelessness
140 people in other noninstitutional facilities
64 people in residential treatment centers for adults
36 people in correctional residential facilities
12 people in group homes intended for adults
8 people in group homes for juveniles (non-correctional)
People in group quarters in 2000:
306 people in other noninstitutional group quarters
93 people in other nonhousehold living situations
75 people in other group homes
41 people in halfway houses
15 people in homes for the mentally retarded
13 people in homes or halfway houses for drug/alcohol abuse
Fatal accident statistics in 2014:
Fatal accident count: 2
Vehicles involved in fatal accidents: 2
Fatal accidents caused by drunken drivers: 0
Fatalities: 2
Persons involved in fatal accidents: 3
Pedestrians involved in fatal accidents: 1
Fatal accident statistics in 2013:
Fatal accident count: 2
Vehicles involved in fatal accidents: 2
Fatal accidents caused by drunken drivers: 0
Fatalities: 2
Persons involved in fatal accidents: 2
Pedestrians involved in fatal accidents: 2
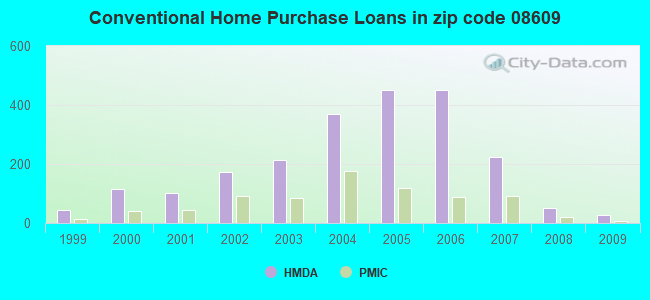
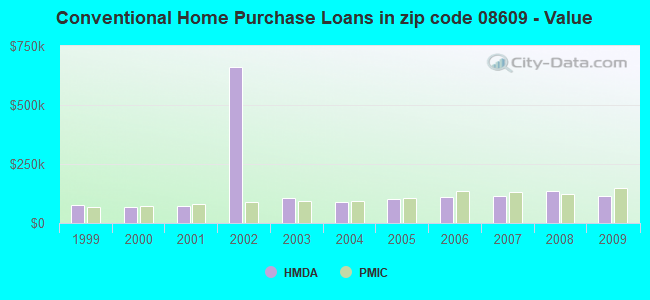
Home Mortgage Disclosure Act Aggregated Statistics For Year 2009 (Based on 2 full and 10 partial tracts)
A) FHA, FSA/RHS & VA Home Purchase Loans
B) Conventional Home Purchase Loans
C) Refinancings
D) Home Improvement Loans
E) Loans on Dwellings For 5+ Families
F) Non-occupant Loans on < 5 Family Dwellings (A B C & D)
G) Loans On Manufactured Home Dwelling (A B C & D)
Number
Average Value
Number
Average Value
Number
Average Value
Number
Average Value
Number
Average Value
Number
Average Value
Number
Average Value
LOANS ORIGINATED
46
$142,216
26
$116,025
127
$148,817
9
$30,014
1
$102,940
28
$145,895
0
$0
APPLICATIONS APPROVED, NOT ACCEPTED
2
$212,360
1
$120,440
25
$122,481
4
$31,398
0
$0
1
$266,540
0
$0
APPLICATIONS DENIED
17
$125,856
9
$73,763
174
$124,354
35
$40,961
1
$227,960
31
$130,856
1
$4,730
APPLICATIONS WITHDRAWN
5
$121,922
5
$206,180
69
$144,511
4
$35,650
0
$0
6
$120,013
0
$0
FILES CLOSED FOR INCOMPLETENESS
4
$97,832
4
$72,492
17
$139,771
2
$82,400
0
$0
6
$78,997
0
$0
Aggregated Statistics For Year 2008 (Based on 2 full and 10 partial tracts)
A) FHA, FSA/RHS & VA Home Purchase Loans
B) Conventional Home Purchase Loans
C) Refinancings
D) Home Improvement Loans
E) Loans on Dwellings For 5+ Families
F) Non-occupant Loans on < 5 Family Dwellings (A B C & D)
G) Loans On Manufactured Home Dwelling (A B C & D)
Number
Average Value
Number
Average Value
Number
Average Value
Number
Average Value
Number
Average Value
Number
Average Value
Number
Average Value
LOANS ORIGINATED
46
$144,195
50
$134,648
181
$127,802
23
$47,307
1
$57,780
49
$111,945
0
$0
APPLICATIONS APPROVED, NOT ACCEPTED
5
$125,654
18
$155,033
43
$117,345
9
$18,377
2
$312,160
19
$117,444
0
$0
APPLICATIONS DENIED
18
$154,963
48
$92,660
260
$115,643
75
$35,612
3
$260,323
80
$94,330
1
$68,440
APPLICATIONS WITHDRAWN
13
$121,029
10
$153,574
78
$117,282
10
$33,607
0
$0
16
$129,612
0
$0
FILES CLOSED FOR INCOMPLETENESS
3
$120,727
6
$115,145
32
$162,552
8
$85,094
0
$0
7
$97,303
0
$0
Aggregated Statistics For Year 2007 (Based on 2 full and 10 partial tracts)
A) FHA, FSA/RHS & VA Home Purchase Loans
B) Conventional Home Purchase Loans
C) Refinancings
D) Home Improvement Loans
E) Loans on Dwellings For 5+ Families
F) Non-occupant Loans on < 5 Family Dwellings (A B C & D)
G) Loans On Manufactured Home Dwelling (A B C & D)
Number
Average Value
Number
Average Value
Number
Average Value
Number
Average Value
Number
Average Value
Number
Average Value
Number
Average Value
LOANS ORIGINATED
42
$143,762
225
$112,924
370
$115,757
64
$41,283
9
$524,992
164
$106,060
0
$0
APPLICATIONS APPROVED, NOT ACCEPTED
6
$242,358
53
$126,157
101
$122,500
22
$33,150
2
$164,645
55
$115,984
0
$0
APPLICATIONS DENIED
8
$158,494
160
$129,745
440
$124,623
127
$40,887
1
$631,140
166
$115,390
1
$69,150
APPLICATIONS WITHDRAWN
7
$176,494
51
$134,747
186
$132,961
10
$21,829
4
$236,288
39
$115,728
0
$0
FILES CLOSED FOR INCOMPLETENESS
0
$0
20
$131,628
39
$132,456
2
$59,630
0
$0
12
$113,265
0
$0
Aggregated Statistics For Year 2006 (Based on 2 full and 10 partial tracts)
A) FHA, FSA/RHS & VA Home Purchase Loans
B) Conventional Home Purchase Loans
C) Refinancings
D) Home Improvement Loans
E) Loans on Dwellings For 5+ Families
F) Non-occupant Loans on < 5 Family Dwellings (A B C & D)
Number
Average Value
Number
Average Value
Number
Average Value
Number
Average Value
Number
Average Value
Number
Average Value
LOANS ORIGINATED
49
$143,260
452
$110,374
510
$111,464
77
$67,970
5
$251,322
361
$110,421
APPLICATIONS APPROVED, NOT ACCEPTED
8
$158,928
94
$107,827
131
$107,551
21
$68,529
0
$0
64
$111,071
APPLICATIONS DENIED
14
$152,149
250
$116,748
479
$112,949
108
$45,676
1
$156,470
230
$107,955
APPLICATIONS WITHDRAWN
3
$166,700
124
$110,055
285
$114,157
19
$48,152
2
$212,685
110
$98,175
FILES CLOSED FOR INCOMPLETENESS
1
$172,570
30
$128,814
80
$135,539
3
$63,640
0
$0
34
$117,491
Aggregated Statistics For Year 2005 (Based on 2 full and 10 partial tracts)
A) FHA, FSA/RHS & VA Home Purchase Loans
B) Conventional Home Purchase Loans
C) Refinancings
D) Home Improvement Loans
E) Loans on Dwellings For 5+ Families
F) Non-occupant Loans on < 5 Family Dwellings (A B C & D)
G) Loans On Manufactured Home Dwelling (A B C & D)
Number
Average Value
Number
Average Value
Number
Average Value
Number
Average Value
Number
Average Value
Number
Average Value
Number
Average Value
LOANS ORIGINATED
46
$128,516
451
$100,359
544
$104,180
70
$71,900
9
$358,041
377
$93,734
1
$12,410
APPLICATIONS APPROVED, NOT ACCEPTED
2
$89,025
69
$98,492
126
$96,044
16
$39,968
0
$0
53
$93,620
1
$121,470
APPLICATIONS DENIED
15
$105,433
173
$107,238
511
$99,525
109
$53,159
2
$152,270
163
$106,605
2
$154,475
APPLICATIONS WITHDRAWN
7
$135,376
130
$86,546
347
$110,141
52
$114,876
1
$314,360
103
$80,017
1
$66,910
FILES CLOSED FOR INCOMPLETENESS
4
$106,265
32
$105,960
98
$112,324
1
$15,440
0
$0
24
$110,748
0
$0
Aggregated Statistics For Year 2004 (Based on 2 full and 10 partial tracts)
A) FHA, FSA/RHS & VA Home Purchase Loans
B) Conventional Home Purchase Loans
C) Refinancings
D) Home Improvement Loans
E) Loans on Dwellings For 5+ Families
F) Non-occupant Loans on < 5 Family Dwellings (A B C & D)
G) Loans On Manufactured Home Dwelling (A B C & D)
Number
Average Value
Number
Average Value
Number
Average Value
Number
Average Value
Number
Average Value
Number
Average Value
Number
Average Value
LOANS ORIGINATED
48
$121,401
368
$89,210
466
$92,626
63
$59,475
16
$301,588
327
$78,713
1
$38,940
APPLICATIONS APPROVED, NOT ACCEPTED
2
$117,705
60
$94,394
124
$96,848
21
$44,530
1
$92,650
48
$83,726
0
$0
APPLICATIONS DENIED
12
$94,185
100
$109,764
428
$84,544
105
$35,733
5
$226,738
103
$77,475
1
$135,930
APPLICATIONS WITHDRAWN
7
$127,604
53
$108,979
230
$95,294
10
$44,881
4
$156,972
50
$95,302
0
$0
FILES CLOSED FOR INCOMPLETENESS
1
$66,780
11
$92,727
34
$82,990
2
$70,440
0
$0
7
$75,244
0
$0
Aggregated Statistics For Year 2003 (Based on 2 full and 10 partial tracts)
A) FHA, FSA/RHS & VA Home Purchase Loans
B) Conventional Home Purchase Loans
C) Refinancings
D) Home Improvement Loans
E) Loans on Dwellings For 5+ Families
F) Non-occupant Loans on < 5 Family Dwellings (A B C & D)
Number
Average Value
Number
Average Value
Number
Average Value
Number
Average Value
Number
Average Value
Number
Average Value
LOANS ORIGINATED
58
$95,446
213
$107,876
412
$85,214
35
$30,090
3
$181,697
155
$71,126
APPLICATIONS APPROVED, NOT ACCEPTED
7
$99,341
35
$95,890
125
$71,354
16
$23,470
0
$0
21
$63,480
APPLICATIONS DENIED
11
$88,642
71
$75,057
414
$73,935
77
$22,266
1
$93,680
81
$73,994
APPLICATIONS WITHDRAWN
5
$113,158
40
$85,329
249
$83,970
16
$30,408
1
$205,980
34
$62,547
FILES CLOSED FOR INCOMPLETENESS
3
$74,550
4
$92,690
20
$69,412
5
$31,128
0
$0
1
$82,570
Aggregated Statistics For Year 2002 (Based on 2 full and 10 partial tracts)
A) FHA, FSA/RHS & VA Home Purchase Loans
B) Conventional Home Purchase Loans
C) Refinancings
D) Home Improvement Loans
E) Loans on Dwellings For 5+ Families
F) Non-occupant Loans on < 5 Family Dwellings (A B C & D)
Number
Average Value
Number
Average Value
Number
Average Value
Number
Average Value
Number
Average Value
Number
Average Value
LOANS ORIGINATED
56
$477,279
172
$661,345
262
$71,297
40
$27,029
5
$182,050
88
$1,091,442
APPLICATIONS APPROVED, NOT ACCEPTED
6
$74,838
34
$79,858
99
$66,193
20
$25,364
0
$0
20
$56,656
APPLICATIONS DENIED
4
$10,362,495
54
$60,574
412
$63,611
79
$15,945
6
$323,033
74
$53,209
APPLICATIONS WITHDRAWN
8
$3,667,470
21
$515,301
171
$160,293
10
$28,355
0
$0
14
$1,758,234
FILES CLOSED FOR INCOMPLETENESS
3
$96,167
5
$65,454
33
$71,802
0
$0
0
$0
7
$51,220
Aggregated Statistics For Year 2001 (Based on 2 full and 10 partial tracts)
A) FHA, FSA/RHS & VA Home Purchase Loans
B) Conventional Home Purchase Loans
C) Refinancings
D) Home Improvement Loans
E) Loans on Dwellings For 5+ Families
F) Non-occupant Loans on < 5 Family Dwellings (A B C & D)
Number
Average Value
Number
Average Value
Number
Average Value
Number
Average Value
Number
Average Value
Number
Average Value
LOANS ORIGINATED
83
$75,737
102
$70,381
202
$64,610
21
$20,473
3
$204,337
80
$59,523
APPLICATIONS APPROVED, NOT ACCEPTED
4
$62,430
16
$65,542
69
$56,422
15
$29,656
2
$116,105
13
$56,434
APPLICATIONS DENIED
11
$76,537
53
$59,730
308
$60,266
94
$18,493
0
$0
32
$59,468
APPLICATIONS WITHDRAWN
16
$81,646
19
$71,838
130
$60,307
18
$22,174
0
$0
12
$41,547
FILES CLOSED FOR INCOMPLETENESS
3
$85,130
6
$74,997
39
$64,274
2
$29,710
0
$0
7
$85,341
Aggregated Statistics For Year 2000 (Based on 2 full and 10 partial tracts)
A) FHA, FSA/RHS & VA Home Purchase Loans
B) Conventional Home Purchase Loans
C) Refinancings
D) Home Improvement Loans
E) Loans on Dwellings For 5+ Families
F) Non-occupant Loans on < 5 Family Dwellings (A B C & D)
Number
Average Value
Number
Average Value
Number
Average Value
Number
Average Value
Number
Average Value
Number
Average Value
LOANS ORIGINATED
65
$74,943
114
$69,028
160
$55,064
39
$21,363
0
$0
55
$51,780
APPLICATIONS APPROVED, NOT ACCEPTED
7
$82,840
20
$72,832
72
$59,875
36
$19,046
0
$0
11
$47,940
APPLICATIONS DENIED
11
$56,739
40
$54,017
327
$47,791
137
$18,821
2
$86,605
38
$40,824
APPLICATIONS WITHDRAWN
22
$63,023
44
$81,493
189
$57,648
15
$30,174
0
$0
29
$50,603
FILES CLOSED FOR INCOMPLETENESS
4
$73,815
7
$71,586
39
$53,646
0
$0
0
$0
6
$71,790
Aggregated Statistics For Year 1999 (Based on 1 full and 5 partial tracts)
A) FHA, FSA/RHS & VA Home Purchase Loans
B) Conventional Home Purchase Loans
C) Refinancings
D) Home Improvement Loans
E) Loans on Dwellings For 5+ Families
F) Non-occupant Loans on < 5 Family Dwellings (A B C & D)
2002 - 2018 National Fire Incident Reporting System (NFIRS) incidents
According to the data from the years 2002 - 2018 the average number of fire incidents per year is 70. The highest number of fire incidents - 249 took place in 2005, and the least - 12 in 2012. The data has a dropping trend.
When looking into fire subcategories, the most incidents belonged to: Structure Fires (45.2%), and Outside Fires (22.2%).
Fire incident types reported to NFIRS in Zip Code 08609


 Nearest zip codes: 08629, 08608, 08638, 08611, 08610, 08619.


 According to the data from the years 2002 - 2018 the average number of fire incidents per year is 70. The highest number of fire incidents - 249 took place in 2005, and the least - 12 in 2012. The data has a dropping trend.
 When looking into fire subcategories, the most incidents belonged to: Structure Fires (45.2%), and Outside Fires (22.2%).