Estimated zip code population in 2022: 13,092 Zip code population in 2010: 12,331 Zip code population in 2000: 11,102
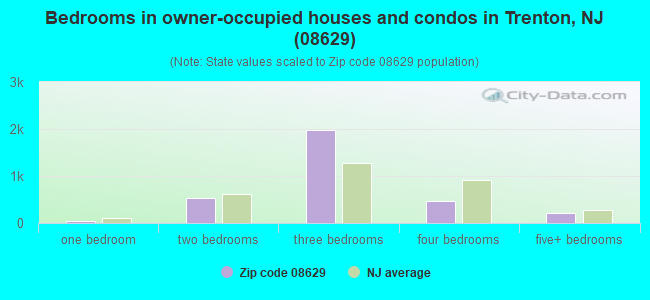
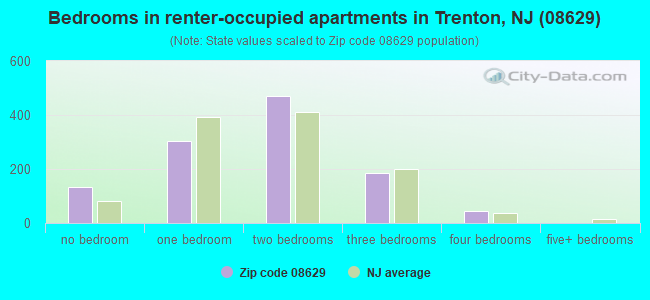
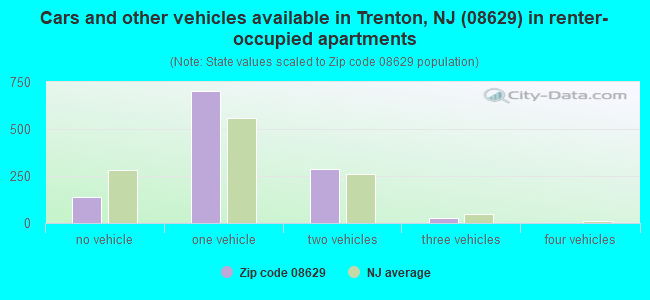
Houses and condos: 4,458 Renter-occupied apartments: 1,142
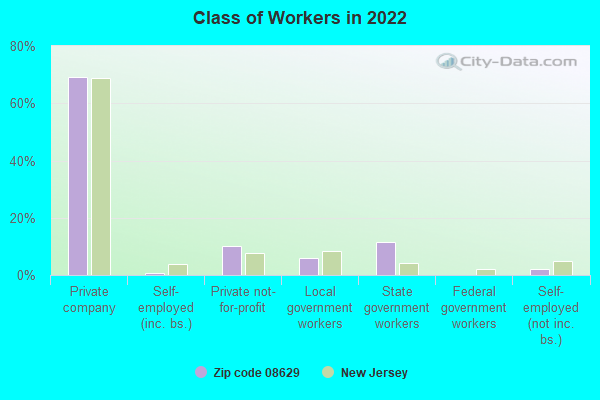
% of renters here:
26%
State:
35%
March 2022 cost of living index in zip code 08629: 108.5 (more than average, U.S. average is 100)
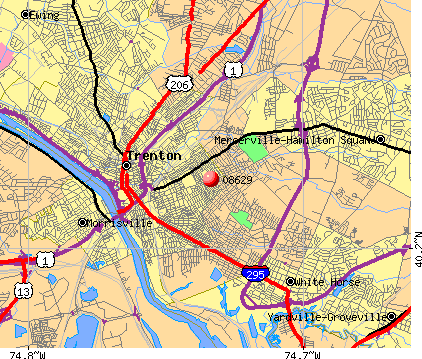
Land area: 0.8 sq. mi. Water area: 0.0 sq. mi.
Population density: 16,442 people per square mile
(very high).
OSM Map
Google Map
MSN Map
OSM Map
General Map
Google Map
MSN Map
OSM Map
Google Map
MSN Map
OSM Map
Google Map
MSN Map
Please wait while loading the map...
Real estate property taxes paid for housing units in 2022:
This zip code:
2.9% ($4,100)
New Jersey:
2.1% ($8,897)
Median real estate property taxes paid for housing units with mortgages in 2022: $4,338 (2.8%) Median real estate property taxes paid for housing units with no mortgage in 2022: $3,457 (2.8%)
Business Search- 14 Million verified businesses
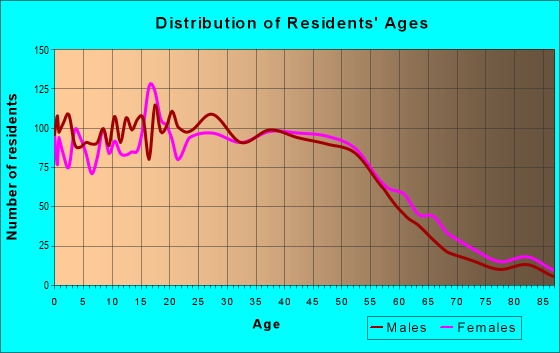
Males: 6,639
(50.7%)
Females: 6,453
(49.3%)
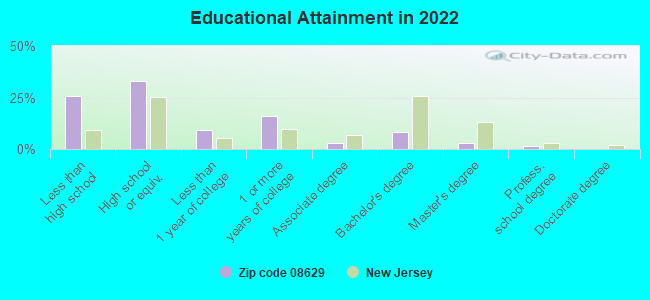
For population 25 years and over in 08629:
High school or higher: 74.0%
Bachelor's degree or higher: 12.9%
Graduate or professional degree: 4.5%
Unemployed: 5.0%
Mean travel time to work (commute): 21.4 minutes
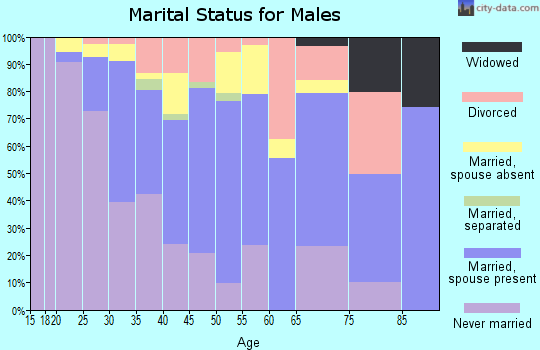
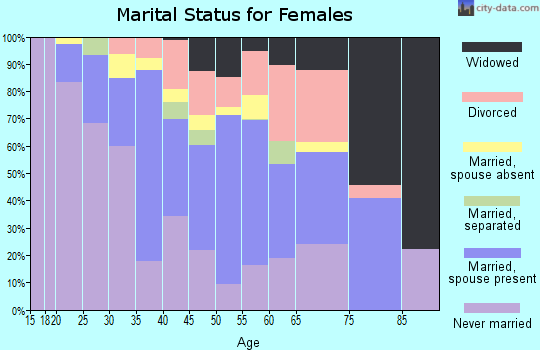
For population 15 years and over in 08629:
Never married: 43.0%
Now married: 42.9%
Separated: 2.2%
Widowed: 3.0%
Divorced: 9.0%
Zip code 08629 compared to state average:
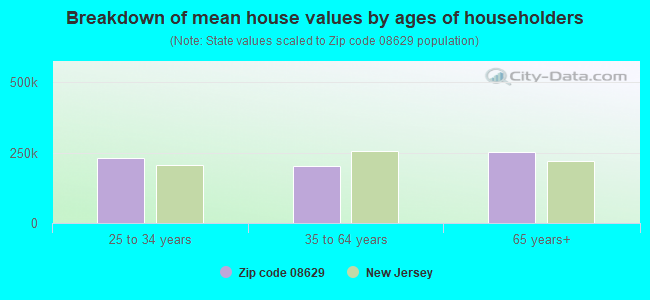
Median house value significantly below state average.
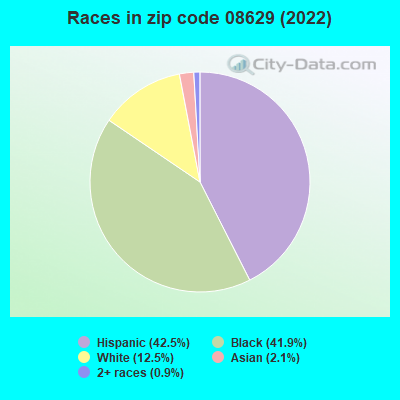
Black race population percentage significantly above state average.
Hispanic race population percentage above state average.
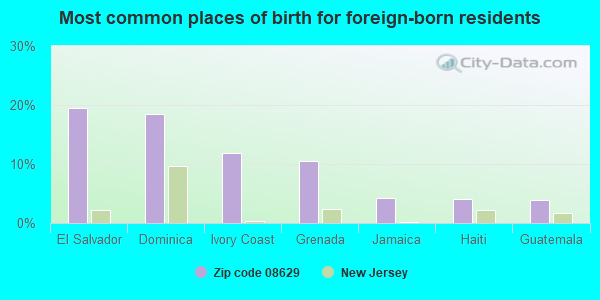
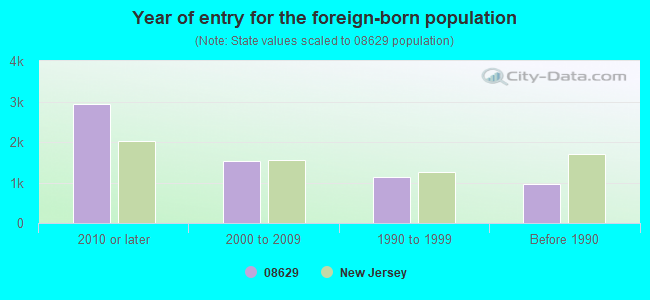
Foreign-born population percentage above state average.
Length of stay since moving in above state average.
House age above state average.
Percentage of population with a bachelor's degree or higher significantly below state average.
Averages for the 2020 tax year for zip code 08629, filed in 2021:
Average Adjusted Gross Income (AGI) in 2020: $37,603 (Individual Income Tax Returns)
Here:
$37,603
State:
$95,247
Salary/wage: $35,511 (reported on 86.2% of returns)
Here:
$35,511
State:
$80,635
(% of AGI for various income ranges: 1380.3% for AGIs below $25k, 3756.4% for AGIs $25k-50k, 6801.1% for AGIs $50k-75k, 9453.9% for AGIs $75k-100k, 18120.6% for AGIs $100k-200k)
Taxable interest for individuals: $533 (reported on 9.1% of returns)
This zip code:
$533
New Jersey:
$2,414
(% of AGI for various income ranges: 1.2% for AGIs below $25k, 3.4% for AGIs $25k-50k, 7.3% for AGIs $50k-75k, 21.4% for AGIs $75k-100k, 71.2% for AGIs $100k-200k)
Ordinary dividends: $1,515 (reported on 4.1% of returns)
Here:
$1,515
State:
$8,057
(% of AGI for various income ranges: 2.1% for AGIs below $25k, 5.7% for AGIs $25k-50k, 4.1% for AGIs $50k-75k, 44.3% for AGIs $75k-100k, 65.3% for AGIs $100k-200k)
Net capital gain/loss in AGI: +$4,973 (reported on 4.0% of returns)
Here:
+$4,973
State:
+$25,022
(% of AGI for various income ranges: 3.2% for AGIs $25k-50k, 21.1% for AGIs $50k-75k, 71.8% for AGIs $75k-100k, 527.1% for AGIs $100k-200k)
Profit/loss from business: +$4,770 (reported on 16.9% of returns)
Here:
+$4,770
State:
+$18,035
(% of AGI for various income ranges: 172.3% for AGIs below $25k, 69.4% for AGIs $25k-50k, 59.9% for AGIs $50k-75k, 8.2% for AGIs $75k-100k, 212.4% for AGIs $100k-200k)
Taxable individual retirement arrangement distribution: $11,564 (reported on 1.7% of returns)
08629:
$11,564
New Jersey:
$21,558
(% of AGI for various income ranges: 8.6% for AGIs below $25k, 14.7% for AGIs $25k-50k, 45.2% for AGIs $50k-75k, 184.6% for AGIs $75k-100k)
Total itemized deductions: $28,224 (reported on 6.8% of returns)
Here:
$28,224
State:
$32,863
(% of AGI for various income ranges: 233.7% for AGIs $25k-50k, 542.3% for AGIs $50k-75k, 773.2% for AGIs $75k-100k, 1362.4% for AGIs $100k-200k)
Charity contributions: $7,408 (reported on 6.1% of returns)
Here:
$7,408
State:
$7,880
(% of AGI for various income ranges: 44.5% for AGIs $25k-50k, 131.5% for AGIs $50k-75k, 163.2% for AGIs $75k-100k, 435.3% for AGIs $100k-200k)
Taxes paid: $6,874 (reported on 7.0% of returns)
08629:
$6,874
State:
$9,183
(% of AGI for various income ranges: 48.7% for AGIs $25k-50k, 136.3% for AGIs $50k-75k, 207.9% for AGIs $75k-100k, 412.4% for AGIs $100k-200k)
Earned income credit: $2,342 (reported on 24.8% of returns)
Here:
$2,342
State:
$2,148
(% of AGI for various income ranges: 124.6% for AGIs below $25k, 80.9% for AGIs $25k-50k)
Percentage of individuals using paid preparers for their 2020 taxes: 91.3%
Here:
91%
State:
92%
(% for various income ranges: 88.7% for AGIs below $25k, 93.6% for AGIs $25k-50k, 93.5% for AGIs $50k-75k, 94.7% for AGIs $75k-100k, 86.7% for AGIs $100k-200k)
Averages for the 2012 tax year for zip code 08629, filed in 2013:
Average Adjusted Gross Income (AGI) in 2012: $34,619 (Individual Income Tax Returns)
Here:
$34,619
State:
$79,688
Salary/wage: $32,895 (reported on 90.3% of returns)
Here:
$32,895
State:
$68,122
(% of AGI for various income ranges: 79.2% for AGIs below $25k, 88.9% for AGIs $25k-50k, 86.7% for AGIs $50k-75k, 87.6% for AGIs $75k-100k, 83.9% for AGIs $100k-200k)
Taxable interest for individuals: $588 (reported on 14.2% of returns)
This zip code:
$588
New Jersey:
$2,193
(% of AGI for various income ranges: 0.3% for AGIs below $25k, 0.1% for AGIs $25k-50k, 0.2% for AGIs $50k-75k, 0.4% for AGIs $75k-100k, 0.2% for AGIs $100k-200k)
Ordinary dividends: $1,200 (reported on 5.7% of returns)
Here:
$1,200
State:
$6,828
(% of AGI for various income ranges: 0.4% for AGIs below $25k, 0.1% for AGIs $25k-50k, 0.1% for AGIs $50k-75k, 0.2% for AGIs $75k-100k, 0.2% for AGIs $100k-200k)
Profit/loss from business: +$5,856 (reported on 9.2% of returns)
Here:
+$5,856
State:
+$19,577
(% of AGI for various income ranges: 6.6% for AGIs below $25k, 0.6% for AGIs $25k-50k, 0.5% for AGIs $50k-75k, 0.3% for AGIs $75k-100k, 0.2% for AGIs $100k-200k)
Taxable individual retirement arrangement distribution: $7,438 (reported on 2.7% of returns)
08629:
$7,438
New Jersey:
$18,214
(% of AGI for various income ranges: 0.9% for AGIs below $25k, 0.3% for AGIs $25k-50k, 0.6% for AGIs $50k-75k, 1.6% for AGIs $75k-100k)
Total itemized deductions: $16,702 (29% of AGI, reported on 29.4% of returns)
Here:
$16,702
State:
$30,827
Here:
29.1% of AGI
State:
21.2% of AGI
(% of AGI for various income ranges: 7.9% for AGIs below $25k, 14.1% for AGIs $25k-50k, 16.7% for AGIs $50k-75k, 16.9% for AGIs $75k-100k, 15.9% for AGIs $100k-200k)
Charity contributions: $2,595 (reported on 22.7% of returns)
Here:
$2,595
State:
$3,451
(% of AGI for various income ranges: 0.6% for AGIs below $25k, 1.7% for AGIs $25k-50k, 2.0% for AGIs $50k-75k, 2.2% for AGIs $75k-100k, 2.1% for AGIs $100k-200k)
Taxes paid: $5,689 (reported on 29.3% of returns)
08629:
$5,689
State:
$15,801
(% of AGI for various income ranges: 2.4% for AGIs below $25k, 4.0% for AGIs $25k-50k, 6.0% for AGIs $50k-75k, 6.3% for AGIs $75k-100k, 6.4% for AGIs $100k-200k)
Earned income credit: $2,293 (reported on 29.3% of returns)
Here:
$2,293
State:
$2,182
(% of AGI for various income ranges: 8.0% for AGIs below $25k, 1.6% for AGIs $25k-50k)
Percentage of individuals using paid preparers for their 2012 taxes: 62.2%
Here:
62%
State:
65%
(% for various income ranges: 63.0% for AGIs below $25k, 62.5% for AGIs $25k-50k, 60.0% for AGIs $50k-75k, 58.1% for AGIs $75k-100k, 62.5% for AGIs $100k-200k)
Averages for the 2004 tax year for zip code 08629, filed in 2005:
Average Adjusted Gross Income (AGI) in 2004: $33,570 (Individual Income Tax Returns)
Here:
$33,570
State:
$64,921
Salary/wage: $33,000 (reported on 90.5% of returns)
Here:
$33,000
State:
$57,755
(% of AGI for various income ranges: 84.1% for AGIs below $10k, 82.9% for AGIs $10k-25k, 91.7% for AGIs $25k-50k, 90.9% for AGIs $50k-75k, 89.5% for AGIs $75k-100k, 83.3% for AGIs over 100k)
Taxable interest for individuals: $1,001 (reported on 29.0% of returns)
This zip code:
$1,001
New Jersey:
$2,068
(% of AGI for various income ranges: 2.2% for AGIs below $10k, 1.1% for AGIs $10k-25k, 0.6% for AGIs $25k-50k, 0.7% for AGIs $50k-75k, 0.9% for AGIs $75k-100k, 1.9% for AGIs over 100k)
Taxable dividends: $1,162 (reported on 10.4% of returns)
Here:
$1,162
State:
$3,959
(% of AGI for various income ranges: 1.5% for AGIs below $10k, 0.4% for AGIs $10k-25k, 0.3% for AGIs $25k-50k, 0.3% for AGIs $50k-75k, 0.5% for AGIs $75k-100k, 0.2% for AGIs over 100k)
Net capital gain/loss: +$1,711 (reported on 5.6% of returns)
Here:
+$1,711
State:
+$13,591
(% of AGI for various income ranges: -0.4% for AGIs below $10k, -0.0% for AGIs $10k-25k, 0.1% for AGIs $25k-50k, 0.2% for AGIs $50k-75k, 0.6% for AGIs $75k-100k, 1.7% for AGIs over 100k)
Profit/loss from business: +$5,951 (reported on 8.0% of returns)
Here:
+$5,951
State:
+$17,520
(% of AGI for various income ranges: 7.1% for AGIs below $10k, 3.3% for AGIs $10k-25k, 1.0% for AGIs $25k-50k, 0.6% for AGIs $50k-75k, 0.9% for AGIs $75k-100k, 1.2% for AGIs over 100k)
IRA payment deduction: $2,175 (reported on 1.1% of returns)
08629:
$2,175
New Jersey:
$3,270
(% of AGI for various income ranges: 0.1% for AGIs $10k-25k, 0.1% for AGIs $25k-50k, 0.1% for AGIs $50k-75k, 0.1% for AGIs $75k-100k)
Total itemized deductions: $15,366 (30% of AGI, reported on 35.7% of returns)
Here:
$15,366
State:
$23,924
Here:
30.1% of AGI
State:
21.1% of AGI
(% of AGI for various income ranges: 6.4% for AGIs below $10k, 9.7% for AGIs $10k-25k, 19.8% for AGIs $25k-50k, 17.9% for AGIs $50k-75k, 14.5% for AGIs $75k-100k, 14.3% for AGIs over 100k)
Charity contributions deductions: $2,417 (5% of AGI, reported on 31.4% of returns)
Here:
$2,417
State:
$3,242
Here:
4.6% of AGI
State:
2.7% of AGI
(% of AGI for various income ranges: 0.5% for AGIs below $10k, 1.3% for AGIs $10k-25k, 2.4% for AGIs $25k-50k, 2.7% for AGIs $50k-75k, 2.2% for AGIs $75k-100k, 2.7% for AGIs over 100k)
Total tax: $3,607 (reported on 69.3% of returns)
08629:
$3,607
State:
$12,321
(% of AGI for various income ranges: 2.2% for AGIs below $10k, 3.1% for AGIs $10k-25k, 6.0% for AGIs $25k-50k, 8.7% for AGIs $50k-75k, 10.4% for AGIs $75k-100k, 14.2% for AGIs over 100k)
Earned income credit: $1,788 (reported on 23.9% of returns)
Here:
$1,788
State:
$1,711
Percentage of individuals using paid preparers for their 2004 taxes: 64.8%
Here:
65%
State:
65%
(% for various income ranges: 54.3% for AGIs below $10k, 71.3% for AGIs $10k-25k, 65.6% for AGIs $25k-50k, 63.6% for AGIs $50k-75k, 58.8% for AGIs $75k-100k, 65.5% for AGIs over 100k)
Likely homosexual households (counted as self-reported same-sex unmarried-partner households)
Lesbian couples: 0.4% of all households
Gay men: 0.3% of all households
Household received Food Stamps/SNAP in the past 12 months: 602 Household did not receive Food Stamps/SNAP in the past 12 months: 3,778
Women who had a birth in the past 12 months: 121 (124 now married, 0 unmarried) Women who did not have a birth in the past 12 months: 2,865 (693 now married, 2,182 unmarried)
Housing units in zip code 08629 with a mortgage: 1,915 (183 second mortgage, 23 home equity loan, 128 both second mortgage and home equity loan) Median monthly owner costs for units with a mortgage: $1,546 Median monthly owner costs for units without a mortgage: $650
Residents with income below the poverty level in 2022:
This zip code:
12.1%
Whole state:
9.7%
Residents with income below 50% of the poverty level in 2022:
This zip code:
6.4%
Whole state:
5.2%
Median number of rooms in houses and condos:
Here:
6.2
State:
6.8
Median number of rooms in apartments:
Here:
3.9
State:
3.9
Notable locations in this zip code not listed on our city pages
In group quarters: 1 (-1 institutionalized population)
Size of family households: 1,251 2-persons, 562 3-persons, 880 4-persons, 372 5-persons, 211 6-persons, 102 7-or-more-persons
Size of nonfamily households: 787 1-person, 133 2-persons, 44 3-persons
1,284 married couples with children.
828 single-parent households (315 men, 513 women).
50.8% of residents of 08629 zip code speak English at home.
37.8% of residents speak Spanish at home (41% very well, 17% well, 22% not well, 20% not at all).
10.2% of residents speak other Indo-European language at home (44% very well, 27% well, 29% not well).
0.1% of residents speak Asian or Pacific Island language at home (100% not well).
1.8% of residents speak other language at home (82% very well, 9% well, 9% not well).
Foreign born population: 5,754 (44.0%) (48.4% of them are naturalized citizens)
Facilities with environmental interests located in this zip code:
NJDEP FOREST FIRE SERVICE (561 ATLANTIC AVE in HAMILTON, NJ)
STATE MASTER (New Jersey environmental info) - NJEMS-030403, STATE CLEANUP SITE, NJEMS-H7069, AIR PROGRAM (Resource Conservation and Recovery Act (tracking hazardous waste)) Business SIC classification: GASOLINE SERVICE STATIONS Organizations: NJDEP DIV OF PARKS & FORESTRY Alternative names: FOREST FIRE SERVICE SOUTHERN HDQTS
EXXON SERVICE STATION #30139 FORMER (1201 HAMILTON AVE in TRENTON, NJ)
STATE MASTER (New Jersey environmental info) - NJEMS-007356, STATE CLEANUP SITE, NJEMS-88194100000, EPCRA, NJEMS-A6125, AIR PROGRAM (Resource Conservation and Recovery Act (tracking hazardous waste)) Business SIC classification: GASOLINE SERVICE STATIONS Organizations: EXXON CO USA, EXXON MOBIL CORP USA (CONTACT/OWNER)
Alternative names: EXXON CO USA 30139
PINOS FORMAL WEAR & CLEANING (1141 HAMILTON AVENUE in TRENTON, NJ)
STATE MASTER (New Jersey environmental info) - NJEMS-L6070, AIR PROGRAM (Resource Conservation and Recovery Act (tracking hazardous waste)) Business SIC classification: DRYCLEANING PLANTS, EXCEPT RUG CLEANING Organizations: PINOS FORMAL WEAR & DRY CLEANING Alternative names: PINOS FORMAL WEAR & DRY CLEANING
NEW MENS DRIVE-IN CLEANERS INC (730 S OLDEN AVE in HAMILTON TWP, NJ)
STATE MASTER (New Jersey environmental info) - NJEMS-48619400000, EPCRA, NJEMS-L6030, AIR PROGRAM, NJEMS-NJD084763069, HAZARDOUS WASTE PROGRAM Small Quantity Generators, between 100 kg and 1000 kg of hazardous waste/month (Resource Conservation and Recovery Act (tracking hazardous waste)) - notification Business SIC classification: DRYCLEANING PLANTS, EXCEPT RUG CLEANING Organizations: NEW MENS DRY CLEANERS, NELSON GLOUDON (CONTACT/OWNER)
Alternative names: NEW MENS DRY CLEANERS
PAUL ROBESON ELEM (350 CUYLER AVENUE in TRENTON, NJ)
(National Center for Education Statistics) - STATE ID-275 Organizations: TRENTON CITY (SCHOOL DISTRICT)
BAEZ BENJAMIN (315 CUYLER AVE in TRENTON, NJ)
(Resource Conservation and Recovery Act (tracking hazardous waste))
72.1%Utility gas
17.3%Electricity
8.3%Fuel oil, kerosene, etc.
2.0%Bottled, tank, or LP gas
Population in 1990: 10,670. Population change in the 1990s: +432 (+4.0%).
Place of birth for U.S.-born residents:
This state: 5,684
Northeast: 526
Midwest: 70
South: 413
West: 27
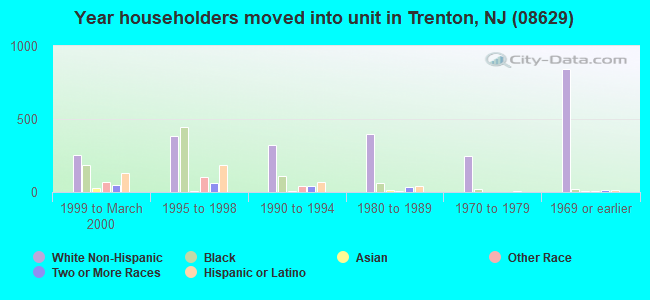
60% of the 08629 zip code residents lived in the same house 5 years ago. Out of people who lived in different houses, 82% lived in this county. Out of people who lived in different counties, 50% lived in New Jersey.
91% of the 08629 zip code residents lived in the same house 1 year ago. Out of people who lived in different houses, 62% moved from this county. Out of people who lived in different houses, 7% moved from different county within same state. Out of people who lived in different houses, 32% moved from abroad.
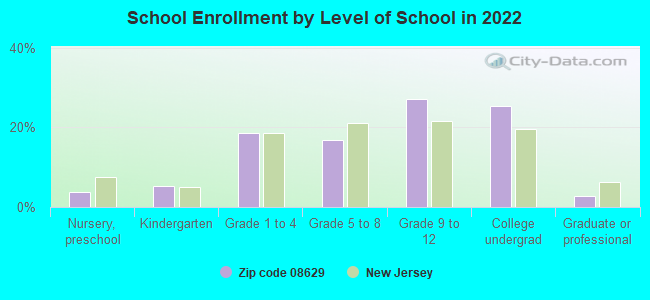
Private vs. public school enrollment:
Students in private schools in grades 1 to 8 (elementary and middle school): 45
Here:
4.2%
New Jersey:
12.3%
Students in private schools in grades 9 to 12 (high school): 64
Here:
7.7%
New Jersey:
13.1%
Students in private undergraduate colleges: 150
Here:
19.2%
New Jersey:
33.2%
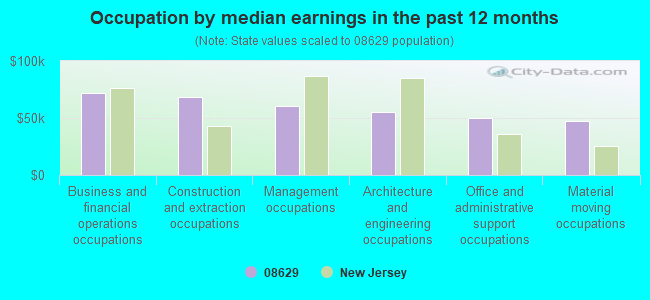
Occupation by median earnings in the past 12 months ($)
71,741Business and financial operations occupations
68,188Construction and extraction occupations
60,218Management occupations
55,437Architecture and engineering occupations
49,570Office and administrative support occupations
47,752Material moving occupations
Companies with federal contracts located in this zip code:
HOSS TECH INC (905 REVERE AVE in TRENTON, NJ; small business) : $13,400 in 3 contractsfrom 2004 to 2006
$6,400 with NASA for . Signed on 2004-03-30. Effective on 2004-04-01. Completion date: 2005-03-30.
$3,500 with Navy for Semiconductor Devices and Associated Hardware. Signed on 2006-05-16. Completion date: 2006-05-31.
$3,500 with Army for Maintenance, Repair and Rebuilding of Equipment -- Cleaning Equipment and Supplies. Signed on 2004-12-13. Completion date: 2005-11-30.
Top industries in this zip code by the number of employees in 2005:
Health Care and Social Assistance: General Medical and Surgical Hospitals (over 1000 employees: 1 establishment)
Health Care and Social Assistance: Home Health Care Services (100-249: 1)
Other Services (except Public Administration): Religious Organizations (20-49: 1, 5-9: 1)
Educational Services: Elementary and Secondary Schools (20-49: 1)
Other Services (except Public Administration): Labor Unions and Similar Labor Organizations (20-49: 1)
Accommodation and Food Services: Full-Service Restaurants (10-19: 2, 1-4: 1)
Health Care and Social Assistance: Child Day Care Services (10-19: 2)
Other Services (except Public Administration): Beauty Salons (10-19: 1, 5-9: 1, 1-4: 2)
Health Care and Social Assistance: Offices of Physicians (except Mental Health Specialists) (5-9: 3, 1-4: 1)
People in group quarters in 2010:
4 people in other noninstitutional facilities
People in group quarters in 2000:
13 people in wards in general hospitals for patients who have no usual home elsewhere
8 people in religious group quarters
2 people in homes or halfway houses for drug/alcohol abuse
Home Mortgage Disclosure Act Aggregated Statistics For Year 2009 (Based on 8 partial tracts)
A) FHA, FSA/RHS & VA Home Purchase Loans
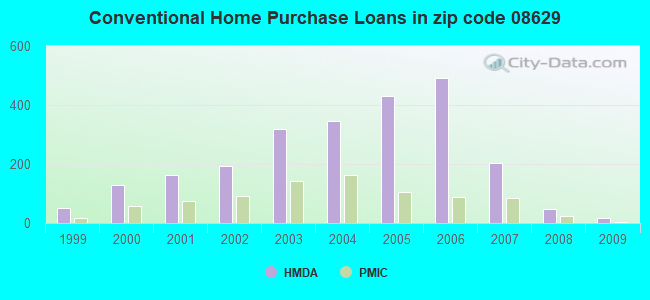
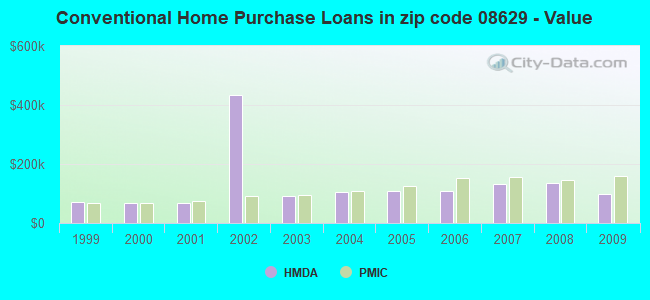
B) Conventional Home Purchase Loans
C) Refinancings
D) Home Improvement Loans
E) Loans on Dwellings For 5+ Families
F) Non-occupant Loans on < 5 Family Dwellings (A B C & D)
G) Loans On Manufactured Home Dwelling (A B C & D)
Number
Average Value
Number
Average Value
Number
Average Value
Number
Average Value
Number
Average Value
Number
Average Value
Number
Average Value
LOANS ORIGINATED
73
$132,225
17
$98,234
166
$144,095
17
$72,318
1
$66,780
19
$96,469
0
$0
APPLICATIONS APPROVED, NOT ACCEPTED
7
$123,427
1
$78,130
31
$147,352
3
$31,880
0
$0
1
$275,650
0
$0
APPLICATIONS DENIED
14
$124,416
9
$92,969
185
$136,180
29
$53,314
0
$0
23
$117,458
1
$4,890
APPLICATIONS WITHDRAWN
10
$117,083
1
$156,470
77
$151,802
6
$40,097
0
$0
2
$188,525
0
$0
FILES CLOSED FOR INCOMPLETENESS
2
$89,010
0
$0
22
$152,581
4
$107,640
0
$0
0
$0
0
$0
Aggregated Statistics For Year 2008 (Based on 8 partial tracts)
A) FHA, FSA/RHS & VA Home Purchase Loans
B) Conventional Home Purchase Loans
C) Refinancings
D) Home Improvement Loans
F) Non-occupant Loans on < 5 Family Dwellings (A B C & D)
G) Loans On Manufactured Home Dwelling (A B C & D)
Number
Average Value
Number
Average Value
Number
Average Value
Number
Average Value
Number
Average Value
Number
Average Value
LOANS ORIGINATED
84
$145,892
49
$134,227
205
$145,957
30
$37,872
27
$167,500
0
$0
APPLICATIONS APPROVED, NOT ACCEPTED
5
$131,518
11
$182,975
50
$123,264
6
$20,397
10
$124,984
0
$0
APPLICATIONS DENIED
20
$156,542
23
$136,603
283
$140,333
72
$31,267
36
$138,935
1
$40,070
APPLICATIONS WITHDRAWN
12
$129,768
9
$139,460
77
$147,615
6
$33,913
7
$121,990
0
$0
FILES CLOSED FOR INCOMPLETENESS
2
$128,755
7
$133,763
29
$168,063
0
$0
3
$154,530
0
$0
Aggregated Statistics For Year 2007 (Based on 8 partial tracts)
A) FHA, FSA/RHS & VA Home Purchase Loans
B) Conventional Home Purchase Loans
C) Refinancings
D) Home Improvement Loans
E) Loans on Dwellings For 5+ Families
F) Non-occupant Loans on < 5 Family Dwellings (A B C & D)
G) Loans On Manufactured Home Dwelling (A B C & D)
Number
Average Value
Number
Average Value
Number
Average Value
Number
Average Value
Number
Average Value
Number
Average Value
Number
Average Value
LOANS ORIGINATED
63
$162,501
202
$131,461
397
$131,357
62
$50,909
3
$254,400
105
$112,771
0
$0
APPLICATIONS APPROVED, NOT ACCEPTED
3
$175,867
26
$142,184
87
$128,624
24
$52,493
0
$0
25
$143,550
0
$0
APPLICATIONS DENIED
14
$154,709
85
$128,163
422
$143,544
118
$45,860
0
$0
75
$124,039
3
$42,527
APPLICATIONS WITHDRAWN
13
$171,578
29
$155,597
184
$146,026
10
$14,234
0
$0
21
$145,036
0
$0
FILES CLOSED FOR INCOMPLETENESS
0
$0
9
$159,259
47
$156,601
0
$0
0
$0
4
$161,365
0
$0
Aggregated Statistics For Year 2006 (Based on 8 partial tracts)
A) FHA, FSA/RHS & VA Home Purchase Loans
B) Conventional Home Purchase Loans
C) Refinancings
D) Home Improvement Loans
E) Loans on Dwellings For 5+ Families
F) Non-occupant Loans on < 5 Family Dwellings (A B C & D)
G) Loans On Manufactured Home Dwelling (A B C & D)
Number
Average Value
Number
Average Value
Number
Average Value
Number
Average Value
Number
Average Value
Number
Average Value
Number
Average Value
LOANS ORIGINATED
62
$183,043
490
$109,405
511
$121,273
82
$59,939
1
$1,907,850
203
$111,119
2
$98,125
APPLICATIONS APPROVED, NOT ACCEPTED
2
$196,440
61
$113,588
141
$131,050
16
$50,094
0
$0
32
$109,906
2
$97,190
APPLICATIONS DENIED
9
$169,907
165
$124,348
425
$129,807
101
$42,953
1
$101,510
87
$120,273
2
$227,085
APPLICATIONS WITHDRAWN
4
$213,572
71
$111,937
282
$132,161
17
$73,204
0
$0
27
$127,496
0
$0
FILES CLOSED FOR INCOMPLETENESS
1
$211,890
28
$146,559
73
$147,336
2
$26,515
0
$0
14
$136,682
0
$0
Aggregated Statistics For Year 2005 (Based on 8 partial tracts)
A) FHA, FSA/RHS & VA Home Purchase Loans
B) Conventional Home Purchase Loans
C) Refinancings
D) Home Improvement Loans
E) Loans on Dwellings For 5+ Families
F) Non-occupant Loans on < 5 Family Dwellings (A B C & D)
G) Loans On Manufactured Home Dwelling (A B C & D)
Number
Average Value
Number
Average Value
Number
Average Value
Number
Average Value
Number
Average Value
Number
Average Value
Number
Average Value
LOANS ORIGINATED
65
$147,452
430
$109,289
553
$113,223
85
$61,116
0
$0
205
$98,548
1
$12,840
APPLICATIONS APPROVED, NOT ACCEPTED
2
$83,345
56
$97,863
112
$105,322
18
$52,203
0
$0
27
$92,403
1
$82,860
APPLICATIONS DENIED
11
$136,786
149
$119,901
414
$108,275
80
$44,131
0
$0
61
$107,205
4
$97,508
APPLICATIONS WITHDRAWN
12
$152,960
84
$112,256
377
$113,590
51
$177,189
2
$43,500
44
$95,625
1
$43,410
FILES CLOSED FOR INCOMPLETENESS
1
$111,520
28
$113,698
90
$120,484
6
$73,315
0
$0
13
$83,709
0
$0
Aggregated Statistics For Year 2004 (Based on 8 partial tracts)
A) FHA, FSA/RHS & VA Home Purchase Loans
B) Conventional Home Purchase Loans
C) Refinancings
D) Home Improvement Loans
E) Loans on Dwellings For 5+ Families
F) Non-occupant Loans on < 5 Family Dwellings (A B C & D)
G) Loans On Manufactured Home Dwelling (A B C & D)
Number
Average Value
Number
Average Value
Number
Average Value
Number
Average Value
Number
Average Value
Number
Average Value
Number
Average Value
LOANS ORIGINATED
80
$125,564
346
$104,543
489
$96,532
53
$57,407
6
$389,737
192
$89,014
0
$0
APPLICATIONS APPROVED, NOT ACCEPTED
3
$121,253
66
$104,875
131
$84,261
14
$50,063
1
$60,100
33
$81,805
2
$49,530
APPLICATIONS DENIED
13
$122,588
95
$111,251
399
$94,455
89
$38,135
1
$160,270
53
$90,541
3
$56,747
APPLICATIONS WITHDRAWN
6
$131,527
53
$100,274
233
$99,473
9
$37,729
2
$111,110
32
$100,470
0
$0
FILES CLOSED FOR INCOMPLETENESS
3
$122,990
14
$104,003
28
$90,197
4
$74,012
0
$0
9
$69,797
0
$0
Aggregated Statistics For Year 2003 (Based on 8 partial tracts)
A) FHA, FSA/RHS & VA Home Purchase Loans
B) Conventional Home Purchase Loans
C) Refinancings
D) Home Improvement Loans
E) Loans on Dwellings For 5+ Families
F) Non-occupant Loans on < 5 Family Dwellings (A B C & D)
Number
Average Value
Number
Average Value
Number
Average Value
Number
Average Value
Number
Average Value
Number
Average Value
LOANS ORIGINATED
109
$104,247
320
$93,117
515
$83,092
30
$30,103
1
$161,970
132
$71,724
APPLICATIONS APPROVED, NOT ACCEPTED
12
$90,983
34
$89,679
103
$80,722
15
$28,633
0
$0
12
$75,914
APPLICATIONS DENIED
12
$104,635
80
$87,327
356
$84,445
75
$28,232
1
$60,770
47
$80,695
APPLICATIONS WITHDRAWN
8
$123,744
35
$92,345
249
$89,447
9
$33,966
0
$0
21
$75,854
FILES CLOSED FOR INCOMPLETENESS
0
$0
6
$80,325
32
$105,015
1
$10,020
0
$0
8
$67,052
Aggregated Statistics For Year 2002 (Based on 6 partial tracts)
A) FHA, FSA/RHS & VA Home Purchase Loans
B) Conventional Home Purchase Loans
C) Refinancings
D) Home Improvement Loans
E) Loans on Dwellings For 5+ Families
F) Non-occupant Loans on < 5 Family Dwellings (A B C & D)
Number
Average Value
Number
Average Value
Number
Average Value
Number
Average Value
Number
Average Value
Number
Average Value
LOANS ORIGINATED
103
$153,678
194
$434,047
281
$76,554
32
$24,894
0
$0
60
$1,085,686
APPLICATIONS APPROVED, NOT ACCEPTED
5
$83,220
28
$81,485
91
$71,909
21
$16,655
0
$0
13
$66,297
APPLICATIONS DENIED
8
$3,435,961
32
$76,304
317
$69,224
65
$14,697
1
$150,260
21
$59,830
APPLICATIONS WITHDRAWN
11
$24,473,612
19
$107,141
160
$74,941
24
$20,429
0
$0
11
$66,476
FILES CLOSED FOR INCOMPLETENESS
8
$112,098
2
$56,765
21
$82,084
0
$0
0
$0
2
$63,905
Aggregated Statistics For Year 2001 (Based on 6 partial tracts)
A) FHA, FSA/RHS & VA Home Purchase Loans
B) Conventional Home Purchase Loans
C) Refinancings
D) Home Improvement Loans
E) Loans on Dwellings For 5+ Families
F) Non-occupant Loans on < 5 Family Dwellings (A B C & D)
Number
Average Value
Number
Average Value
Number
Average Value
Number
Average Value
Number
Average Value
Number
Average Value
LOANS ORIGINATED
156
$79,074
163
$67,838
164
$72,262
14
$15,351
1
$377,310
49
$55,911
APPLICATIONS APPROVED, NOT ACCEPTED
3
$62,107
20
$71,187
58
$72,016
6
$17,990
0
$0
4
$94,498
APPLICATIONS DENIED
9
$77,584
41
$62,122
226
$58,860
92
$15,584
0
$0
20
$46,471
APPLICATIONS WITHDRAWN
9
$73,971
14
$73,921
89
$65,869
13
$23,918
0
$0
3
$31,103
FILES CLOSED FOR INCOMPLETENESS
3
$66,603
4
$64,312
27
$72,048
3
$21,177
0
$0
3
$47,130
Aggregated Statistics For Year 2000 (Based on 6 partial tracts)
A) FHA, FSA/RHS & VA Home Purchase Loans
B) Conventional Home Purchase Loans
C) Refinancings
D) Home Improvement Loans
F) Non-occupant Loans on < 5 Family Dwellings (A B C & D)
Number
Average Value
Number
Average Value
Number
Average Value
Number
Average Value
Number
Average Value
LOANS ORIGINATED
137
$73,957
128
$66,912
92
$57,463
29
$17,513
26
$56,252
APPLICATIONS APPROVED, NOT ACCEPTED
8
$75,771
15
$90,317
53
$69,850
34
$19,215
6
$44,698
APPLICATIONS DENIED
9
$65,850
35
$68,896
214
$49,676
113
$19,453
20
$48,867
APPLICATIONS WITHDRAWN
9
$78,400
27
$78,406
122
$65,526
11
$35,902
17
$68,636
FILES CLOSED FOR INCOMPLETENESS
6
$77,462
3
$68,053
25
$64,550
0
$0
3
$49,413
Aggregated Statistics For Year 1999 (Based on 3 partial tracts)
A) FHA, FSA/RHS & VA Home Purchase Loans
B) Conventional Home Purchase Loans
C) Refinancings
D) Home Improvement Loans
F) Non-occupant Loans on < 5 Family Dwellings (A B C & D)
2002 - 2018 National Fire Incident Reporting System (NFIRS) incidents
According to the data from the years 2002 - 2018 the average number of fire incidents per year is 20. The highest number of fire incidents - 57 took place in 2005, and the least - 3 in 2012. The data has a constant trend.
When looking into fire subcategories, the most reports belonged to: Structure Fires (54.7%), and Outside Fires (17.5%).
Fire incident types reported to NFIRS in Zip Code 08629


 Nearest zip codes: 08609, 08610, 08608, 08611, 08619, 08638.
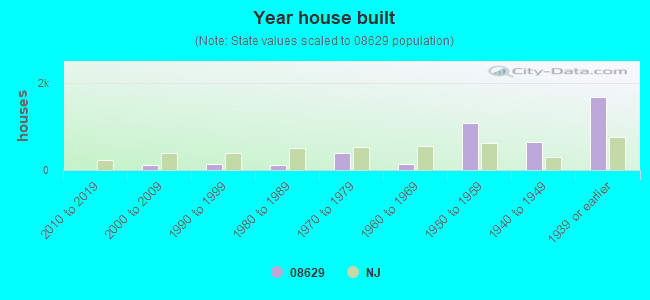


 According to the data from the years 2002 - 2018 the average number of fire incidents per year is 20. The highest number of fire incidents - 57 took place in 2005, and the least - 3 in 2012. The data has a constant trend.
 When looking into fire subcategories, the most reports belonged to: Structure Fires (54.7%), and Outside Fires (17.5%).