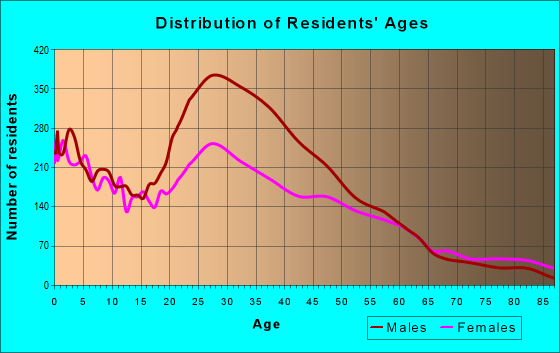
Estimated zip code population in 2022: 31,703 Zip code population in 2010: 28,038 Zip code population in 2000: 23,868
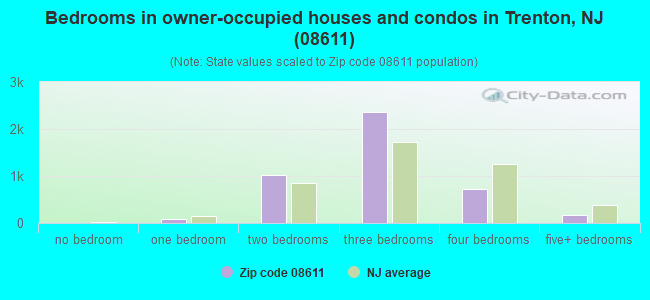
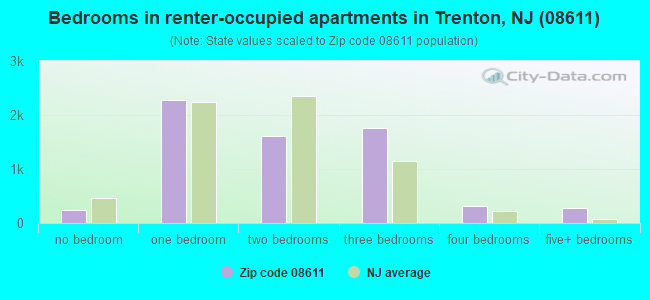
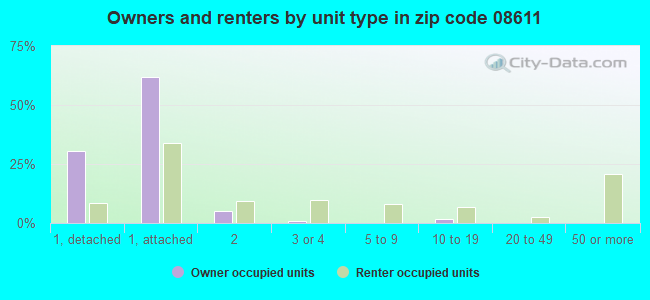
Houses and condos: 11,808 Renter-occupied apartments: 6,515
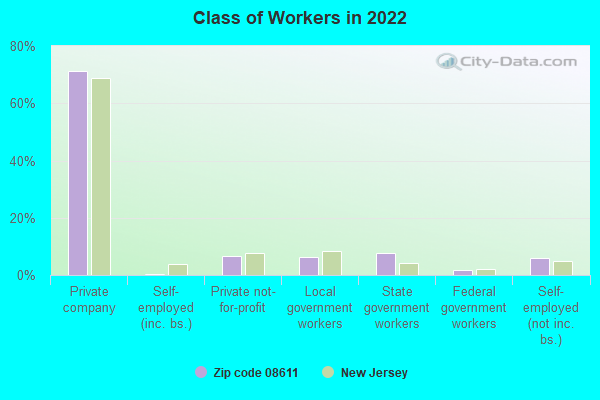
% of renters here:
60%
State:
35%
March 2022 cost of living index in zip code 08611: 109.7 (more than average, U.S. average is 100)
Land area: 2.8 sq. mi. Water area: 0.5 sq. mi.
Population density: 11,442 people per square mile
(high).
OSM Map
Google Map
MSN Map
OSM Map
General Map
Google Map
MSN Map
OSM Map
Google Map
MSN Map
OSM Map
Google Map
MSN Map
Please wait while loading the map...
Real estate property taxes paid for housing units in 2022:
This zip code:
3.5% ($4,335)
New Jersey:
2.1% ($8,897)
Median real estate property taxes paid for housing units with mortgages in 2022: $5,403 (3.3%) Median real estate property taxes paid for housing units with no mortgage in 2022: $3,285 (3.2%)
Averages for the 2020 tax year for zip code 08611, filed in 2021:
Average Adjusted Gross Income (AGI) in 2020: $30,515 (Individual Income Tax Returns)
Here:
$30,515
State:
$95,247
Salary/wage: $30,195 (reported on 83.2% of returns)
Here:
$30,195
State:
$80,635
(% of AGI for various income ranges: 1384.5% for AGIs below $25k, 3829.9% for AGIs $25k-50k, 7020.2% for AGIs $50k-75k, 10066.6% for AGIs $75k-100k, 13871.9% for AGIs $100k-200k)
Taxable interest for individuals: $514 (reported on 7.6% of returns)
This zip code:
$514
New Jersey:
$2,414
(% of AGI for various income ranges: 1.9% for AGIs below $25k, 3.3% for AGIs $25k-50k, 7.0% for AGIs $50k-75k, 14.5% for AGIs $75k-100k, 95.0% for AGIs $100k-200k)
Ordinary dividends: $2,018 (reported on 2.5% of returns)
Here:
$2,018
State:
$8,057
(% of AGI for various income ranges: 1.0% for AGIs below $25k, 2.3% for AGIs $25k-50k, 18.5% for AGIs $50k-75k, 19.3% for AGIs $75k-100k, 100.0% for AGIs $100k-200k)
Net capital gain/loss in AGI: +$3,256 (reported on 2.4% of returns)
Here:
+$3,256
State:
+$25,022
(% of AGI for various income ranges: 0.8% for AGIs below $25k, 2.5% for AGIs $25k-50k, 10.7% for AGIs $50k-75k, 48.6% for AGIs $75k-100k, 341.9% for AGIs $100k-200k)
Profit/loss from business: +$6,712 (reported on 17.8% of returns)
Here:
+$6,712
State:
+$18,035
(% of AGI for various income ranges: 259.5% for AGIs below $25k, 74.8% for AGIs $25k-50k, 78.5% for AGIs $50k-75k, 105.2% for AGIs $75k-100k, 417.5% for AGIs $100k-200k)
Taxable individual retirement arrangement distribution: $13,200 (reported on 1.1% of returns)
08611:
$13,200
New Jersey:
$21,558
(% of AGI for various income ranges: 3.8% for AGIs below $25k, 9.6% for AGIs $25k-50k, 51.2% for AGIs $50k-75k, 466.9% for AGIs $100k-200k)
Total itemized deductions: $26,172 (reported on 3.8% of returns)
Here:
$26,172
State:
$32,863
(% of AGI for various income ranges: 20.8% for AGIs below $25k, 118.7% for AGIs $25k-50k, 381.9% for AGIs $50k-75k, 499.0% for AGIs $75k-100k, 1535.6% for AGIs $100k-200k)
Charity contributions: $7,153 (reported on 3.0% of returns)
Here:
$7,153
State:
$7,880
(% of AGI for various income ranges: 2.5% for AGIs below $25k, 22.9% for AGIs $25k-50k, 78.0% for AGIs $50k-75k, 119.0% for AGIs $75k-100k, 431.2% for AGIs $100k-200k)
Taxes paid: $7,307 (reported on 3.8% of returns)
08611:
$7,307
State:
$9,183
(% of AGI for various income ranges: 2.7% for AGIs below $25k, 27.2% for AGIs $25k-50k, 108.6% for AGIs $50k-75k, 186.6% for AGIs $75k-100k, 466.2% for AGIs $100k-200k)
Earned income credit: $2,553 (reported on 30.2% of returns)
Here:
$2,553
State:
$2,148
(% of AGI for various income ranges: 157.0% for AGIs below $25k, 95.7% for AGIs $25k-50k, 1.6% for AGIs $50k-75k)
Percentage of individuals using paid preparers for their 2020 taxes: 88.5%
Here:
89%
State:
92%
(% for various income ranges: 85.3% for AGIs below $25k, 92.4% for AGIs $25k-50k, 90.7% for AGIs $50k-75k, 92.7% for AGIs $75k-100k, 91.7% for AGIs $100k-200k, 75.0% for AGIs over 200k)
Averages for the 2012 tax year for zip code 08611, filed in 2013:
Average Adjusted Gross Income (AGI) in 2012: $27,865 (Individual Income Tax Returns)
Here:
$27,865
State:
$79,688
Salary/wage: $26,478 (reported on 89.1% of returns)
Here:
$26,478
State:
$68,122
(% of AGI for various income ranges: 81.0% for AGIs below $25k, 90.2% for AGIs $25k-50k, 86.7% for AGIs $50k-75k, 84.7% for AGIs $75k-100k, 79.5% for AGIs $100k-200k, 52.6% for AGIs over 200k)
Taxable interest for individuals: $587 (reported on 9.2% of returns)
This zip code:
$587
New Jersey:
$2,193
(% of AGI for various income ranges: 0.2% for AGIs below $25k, 0.1% for AGIs $25k-50k, 0.2% for AGIs $50k-75k, 0.2% for AGIs $75k-100k, 0.6% for AGIs $100k-200k)
Ordinary dividends: $2,183 (reported on 3.6% of returns)
Here:
$2,183
State:
$6,828
(% of AGI for various income ranges: 0.1% for AGIs below $25k, 0.1% for AGIs $25k-50k, 0.1% for AGIs $50k-75k, 1.2% for AGIs $75k-100k, 1.0% for AGIs $100k-200k)
Net capital gain/loss in AGI: +$250 (reported on 2.2% of returns)
Here:
+$250
State:
+$15,358
(% of AGI for various income ranges: 0.2% for AGIs $100k-200k)
Profit/loss from business: +$8,044 (reported on 10.2% of returns)
Here:
+$8,044
State:
+$19,577
(% of AGI for various income ranges: 8.4% for AGIs below $25k, 1.1% for AGIs $25k-50k, 0.8% for AGIs $50k-75k, 0.7% for AGIs $100k-200k)
Taxable individual retirement arrangement distribution: $8,195 (reported on 1.9% of returns)
08611:
$8,195
New Jersey:
$18,214
(% of AGI for various income ranges: 0.4% for AGIs below $25k, 0.3% for AGIs $25k-50k, 0.5% for AGIs $50k-75k, 2.7% for AGIs $75k-100k)
Total itemized deductions: $15,901 (29% of AGI, reported on 17.5% of returns)
Here:
$15,901
State:
$30,827
Here:
28.6% of AGI
State:
21.2% of AGI
(% of AGI for various income ranges: 4.3% for AGIs below $25k, 10.1% for AGIs $25k-50k, 13.7% for AGIs $50k-75k, 15.0% for AGIs $75k-100k, 15.3% for AGIs $100k-200k, 12.5% for AGIs over 200k)
Charity contributions: $2,297 (reported on 13.8% of returns)
Here:
$2,297
State:
$3,451
(% of AGI for various income ranges: 0.3% for AGIs below $25k, 1.1% for AGIs $25k-50k, 1.9% for AGIs $50k-75k, 1.9% for AGIs $75k-100k, 1.8% for AGIs $100k-200k, 2.3% for AGIs over 200k)
Taxes paid: $5,130 (reported on 17.4% of returns)
08611:
$5,130
State:
$15,801
(% of AGI for various income ranges: 1.1% for AGIs below $25k, 2.5% for AGIs $25k-50k, 4.7% for AGIs $50k-75k, 5.8% for AGIs $75k-100k, 6.8% for AGIs $100k-200k, 6.8% for AGIs over 200k)
Earned income credit: $2,555 (reported on 32.8% of returns)
Here:
$2,555
State:
$2,182
(% of AGI for various income ranges: 8.6% for AGIs below $25k, 1.6% for AGIs $25k-50k)
Percentage of individuals using paid preparers for their 2012 taxes: 70.3%
Here:
70%
State:
65%
(% for various income ranges: 72.6% for AGIs below $25k, 69.0% for AGIs $25k-50k, 63.3% for AGIs $50k-75k, 60.0% for AGIs $75k-100k, 70.6% for AGIs $100k-200k)
Averages for the 2004 tax year for zip code 08611, filed in 2005:
Average Adjusted Gross Income (AGI) in 2004: $28,437 (Individual Income Tax Returns)
Here:
$28,437
State:
$64,921
Salary/wage: $27,437 (reported on 89.5% of returns)
Here:
$27,437
State:
$57,755
(% of AGI for various income ranges: 85.7% for AGIs below $10k, 83.8% for AGIs $10k-25k, 91.9% for AGIs $25k-50k, 87.3% for AGIs $50k-75k, 87.5% for AGIs $75k-100k, 61.0% for AGIs over 100k)
Taxable interest for individuals: $1,035 (reported on 22.6% of returns)
This zip code:
$1,035
New Jersey:
$2,068
(% of AGI for various income ranges: 2.1% for AGIs below $10k, 0.8% for AGIs $10k-25k, 0.6% for AGIs $25k-50k, 0.9% for AGIs $50k-75k, 0.8% for AGIs $75k-100k, 1.5% for AGIs over 100k)
Taxable dividends: $1,818 (reported on 7.2% of returns)
Here:
$1,818
State:
$3,959
(% of AGI for various income ranges: 1.1% for AGIs below $10k, 0.3% for AGIs $10k-25k, 0.2% for AGIs $25k-50k, 0.3% for AGIs $50k-75k, 0.3% for AGIs $75k-100k, 2.5% for AGIs over 100k)
Net capital gain/loss: +$4,215 (reported on 4.8% of returns)
Here:
+$4,215
State:
+$13,591
(% of AGI for various income ranges: -0.5% for AGIs below $10k, -0.0% for AGIs $10k-25k, 0.1% for AGIs $25k-50k, 0.4% for AGIs $50k-75k, 1.4% for AGIs $75k-100k, 6.4% for AGIs over 100k)
Profit/loss from business: +$6,884 (reported on 6.8% of returns)
Here:
+$6,884
State:
+$17,520
(% of AGI for various income ranges: 7.5% for AGIs below $10k, 3.5% for AGIs $10k-25k, 0.8% for AGIs $25k-50k, 0.8% for AGIs $50k-75k, 1.6% for AGIs $75k-100k, 0.5% for AGIs over 100k)
IRA payment deduction: $2,169 (reported on 1.0% of returns)
08611:
$2,169
New Jersey:
$3,270
Total itemized deductions: $13,221 (26% of AGI, reported on 20.7% of returns)
Here:
$13,221
State:
$23,924
Here:
26.1% of AGI
State:
21.1% of AGI
(% of AGI for various income ranges: 7.6% for AGIs below $10k, 5.2% for AGIs $10k-25k, 9.3% for AGIs $25k-50k, 11.7% for AGIs $50k-75k, 12.8% for AGIs $75k-100k, 15.3% for AGIs over 100k)
Charity contributions deductions: $2,332 (4% of AGI, reported on 17.7% of returns)
Here:
$2,332
State:
$3,242
Here:
4.4% of AGI
State:
2.7% of AGI
(% of AGI for various income ranges: 0.4% for AGIs below $10k, 0.7% for AGIs $10k-25k, 1.4% for AGIs $25k-50k, 1.7% for AGIs $50k-75k, 2.3% for AGIs $75k-100k, 2.5% for AGIs over 100k)
Total tax: $3,403 (reported on 61.5% of returns)
08611:
$3,403
State:
$12,321
(% of AGI for various income ranges: 1.9% for AGIs below $10k, 3.0% for AGIs $10k-25k, 6.1% for AGIs $25k-50k, 9.6% for AGIs $50k-75k, 11.7% for AGIs $75k-100k, 17.5% for AGIs over 100k)
Earned income credit: $1,884 (reported on 32.1% of returns)
Here:
$1,884
State:
$1,711
Percentage of individuals using paid preparers for their 2004 taxes: 70.1%
Here:
70%
State:
65%
(% for various income ranges: 63.6% for AGIs below $10k, 76.1% for AGIs $10k-25k, 69.9% for AGIs $25k-50k, 66.2% for AGIs $50k-75k, 62.6% for AGIs $75k-100k, 65.5% for AGIs over 100k)
Likely homosexual households (counted as self-reported same-sex unmarried-partner households)
Lesbian couples: 0.0% of all households
Gay men: 0.2% of all households
Household received Food Stamps/SNAP in the past 12 months: 3,582 Household did not receive Food Stamps/SNAP in the past 12 months: 7,719
Women who had a birth in the past 12 months: 599 (336 now married, 256 unmarried) Women who did not have a birth in the past 12 months: 6,667 (2,447 now married, 4,226 unmarried)
Housing units in zip code 08611 with a mortgage: 2,541 (56 second mortgage, 58 both second mortgage and home equity loan) Houses without a mortgage: 66
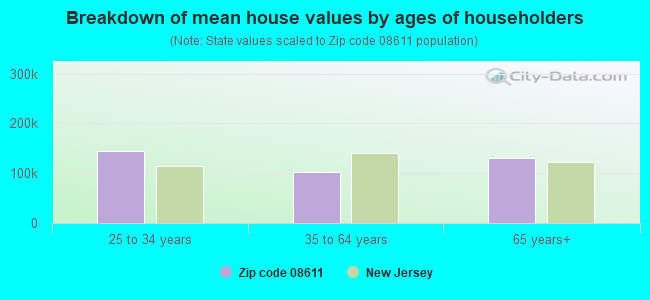
Median monthly owner costs for units with a mortgage: $1,619 Median monthly owner costs for units without a mortgage: $606
Residents with income below the poverty level in 2022:
This zip code:
27.7%
Whole state:
9.7%
Residents with income below 50% of the poverty level in 2022:
This zip code:
15.8%
Whole state:
5.2%
Median number of rooms in houses and condos:
Here:
6.4
State:
6.8
Median number of rooms in apartments:
Here:
4.4
State:
3.9
Notable locations in this zip code not listed on our city pages
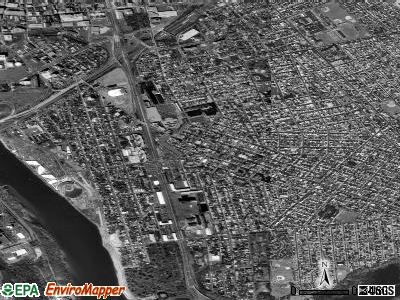
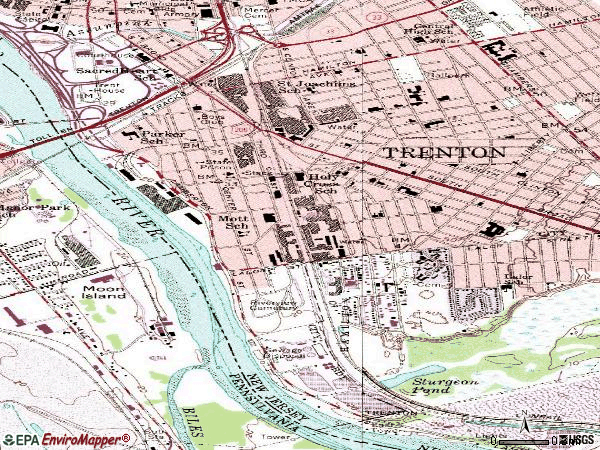
Notable locations in zip code 08611: Trenton Marine Terminal (A), Trent House (B), Trenton Emergency Medical Services Liberty Street (C), Trenton Fire and Emergency Services Engine 3 Ladder 2 (D), Teen House (E), Mercer Generating Station (F). Display/hide their locations on the map
3,387 married couples with children.
3,857 single-parent households (251 men, 3,606 women).
44.1% of residents of 08611 zip code speak English at home.
54.6% of residents speak Spanish at home (38% very well, 17% well, 29% not well, 16% not at all).
1.2% of residents speak other Indo-European language at home (68% very well, 8% well, 22% not well, 2% not at all).
0.9% of residents speak Asian or Pacific Island language at home (7% very well, 16% well, 67% not well, 10% not at all).
0.1% of residents speak other language at home (100% very well).
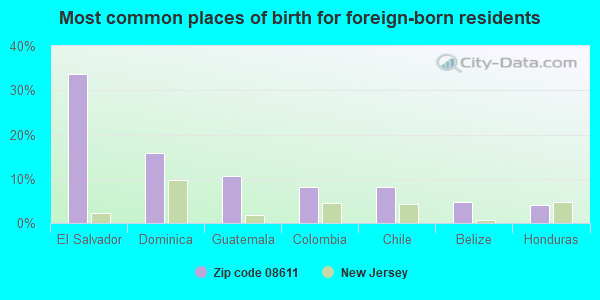
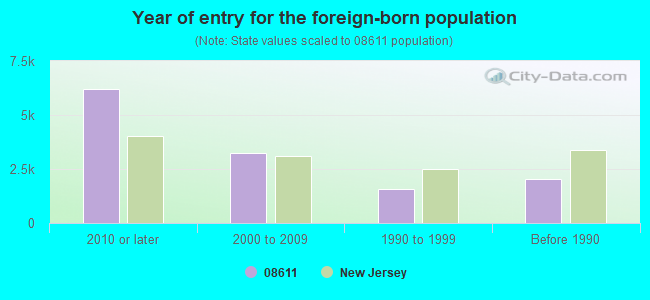
Foreign born population: 10,100 (31.9%) (27.4% of them are naturalized citizens)
AIR MAJOR (AIRS/AFS) CRITERIA AND HAZARDOUS AIR POLLUTANT INVENTORY (Inventory of air pollution sources) STATE MASTER (New Jersey environmental info) - NJEMS-001060, STATE CLEANUP SITE, NJEMS-00306600002, EPCRA, NJEMS-110300177006, RELEASE ASSESSMENT, NJEMS-17363700017, EPCRA, NJEMS-46620, National Pollutant Discharge Elimination System Permit, NJEMS-60216, AIR PROGRAM, NJEMS-60641, NJEMS-61016, NJEMS-NJD000767962, HAZARDOUS WASTE PROGRAM, NJEMS-00306600002, RIGHT-TO-KNOW - RPPR & P2 PLANNING, NJEMS-17363700017, National Pollutant Discharge Elimination System NON-MAJOR (Tracking pollutant discharge elimination systems) - permit HAZARDOUS WASTE BIENNIAL REPORTER (Resource Conservation and Recovery Act (tracking hazardous waste)) Large Quantity Generators, more that 1000 kg of hazardous waste/month (Resource Conservation and Recovery Act (tracking hazardous waste)) - notification (Resource Conservation and Recovery Act (tracking hazardous waste)) TRI REPORTER (Tracking of toxic chemicals releasing facilities) Business SIC classification: MANUFACTURING INDUSTRIES; REFINED PETROLEUM PIPELINES; PETROLEUM BULK STATIONS AND TERMINALS; PETROLEUM AND PETROLEUM PRODUCTS WHOLESALERS, EXCEPT BULK STATIONS AND TERMINALS Organizations: EXXON MOBIL CORP, COLONIAL PIPELINE CO, EXXON MOBIL OIL CORP, EXXON MOBIL OIL CORP (CONTACT/OPERATOR)
, EXXON MOBIL CORPORATION (CONTACT/OWNER)
, EXXON MOBIL CORP (CONTACT/OWNER)
Alternative names: EXXONMOBIL OIL CORP. TRENTON TERMINAL, EXXONMOBIL OIL TRENTON TERMINAL, EXXONMOBIL TRENTON TERMINAL, MOBIL OIL TRENTON TERMINAL
CHEVRON ENVIRONMENTAL MANAGEMENT (2470 LAMBERTON RD in TRENTON CITY, NJ)
STATE MASTER (New Jersey environmental info) - NJEMS-1111-05-0003.1, LAND USE - COASTAL AND LAND USE (Resource Conservation and Recovery Act (tracking hazardous waste)) Organizations: CHEVRON ENVIRONMENTAL MANAGEMENT CO Alternative names: CHEVRON DUCK ISLAND TERMINAL
CITY AUTO RADIATOR INC (430 BRIDGE ST in TRENTON, NJ)
STATE MASTER (New Jersey environmental info) - NJEMS-025151, STATE CLEANUP SITE, NJEMS-025178, NJEMS-025202, NJEMS-43178100000, EPCRA (Resource Conservation and Recovery Act (tracking hazardous waste)) Business SIC classification: AUTOMOTIVE REPAIR SHOPS Organizations: MATLACK RON (CONTACT/OWNER)
NJ DEPT OF TREASURY CENTRAL MOTOR POOL (605 S BROAD ST in TRENTON, NJ)
STATE MASTER (New Jersey environmental info) - NJEMS-NJD099289936, HAZARDOUS WASTE PROGRAM, NJEMS-006130, STATE CLEANUP SITE Small Quantity Generators, between 100 kg and 1000 kg of hazardous waste/month (Resource Conservation and Recovery Act (tracking hazardous waste)) Alternative names: CENTRAL MOTOR POOL DEPT OF TREASURY NJ, NJ DEPT TREASURY CENTRAL MOTOR POOL
NUCERAS SERVICE STATION (444 S BROAD ST in TRENTON CITY, NJ)
STATE MASTER (New Jersey environmental info) - NJEMS-G000036527, STATE CLEANUP SITE (Resource Conservation and Recovery Act (tracking hazardous waste)) Alternative names: ARENA PARKING, ARENA PARKING (444 BROAD STREET), N S C INC
GETTY SERVICE STATION (579 S BROAD ST in TRENTON, NJ)
STATE MASTER (New Jersey environmental info) - NJEMS-G000022462, STATE CLEANUP SITE (Resource Conservation and Recovery Act (tracking hazardous waste)) Alternative names: GETTY PETROLEUM CORP
HILL REFRIGERATION (CLARK ST & HAMILTON AVE in TRENTON, NJ)
STATE MASTER (New Jersey environmental info) - NJEMS-134703, STATE CLEANUP SITE (Resource Conservation and Recovery Act (tracking hazardous waste)) Alternative names: HILL REFRIGERATION CFI PLANT
GARDEN STATE AUTO BODY (346 BUNTING AVE in TRENTON, NJ)
STATE MASTER (New Jersey environmental info) - NJEMS-80018700000, EPCRA, NJEMS-NJX000331033, HAZARDOUS WASTE PROGRAM Conditionally Exempt Small Quantity Generators, less than 100 kg/month of hazardous waste (Resource Conservation and Recovery Act (tracking hazardous waste)) - notification Business SIC classification: TOP, BODY, AND UPHOLSTERY REPAIR SHOPS AND PAINT SHOPS Organizations: ROBERT SCHOEN (CONTACT/OWNER)
ANDYS DEPENDABLE AUTO BODY (742 2ND STREET in TRENTON, NJ)
STATE MASTER (New Jersey environmental info) - NJEMS-57655900000, EPCRA Small Quantity Generators, between 100 kg and 1000 kg of hazardous waste/month (Resource Conservation and Recovery Act (tracking hazardous waste)) - notification Business SIC classification: TOP, BODY, AND UPHOLSTERY REPAIR SHOPS AND PAINT SHOPS Organizations: MR ANDY KISH (CONTACT/OWNER)
PARKER (117 FERRY STREET in TRENTON, NJ)
(National Center for Education Statistics) - STATE ID-270 Organizations: TRENTON CITY (SCHOOL DISTRICT)
GREATER TRENTON AREA ACAD. & TECH. CS (500 SMITH AVENUE in TRENTON, NJ)
(National Center for Education Statistics) - STATE ID-935 Organizations: AGENCY - GREATER TRENTON AREA ACAD. & TECH. CS (SCHOOL DISTRICT)
HARRISON (461 GENESSEE STREET in TRENTON, NJ)
(National Center for Education Statistics) - STATE ID-220 Organizations: TRENTON CITY (SCHOOL DISTRICT)
Housing units lacking complete plumbing facilities: 0.8% Housing units lacking complete kitchen facilities: 2.3%
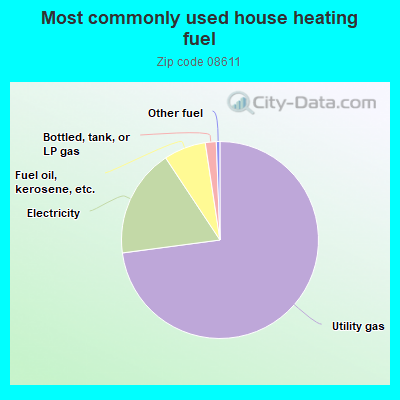
72.9%Utility gas
17.8%Electricity
6.9%Fuel oil, kerosene, etc.
1.8%Bottled, tank, or LP gas
0.6%Other fuel
Population in 1990: 25,084.
Place of birth for U.S.-born residents:
This state: 13,979
Northeast: 2,918
Midwest: 319
South: 1,659
West: 259
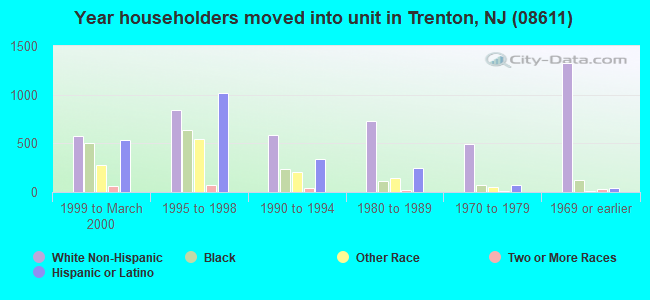
57% of the 08611 zip code residents lived in the same house 5 years ago. Out of people who lived in different houses, 79% lived in this county. Out of people who lived in different counties, 50% lived in New Jersey.
89% of the 08611 zip code residents lived in the same house 1 year ago. Out of people who lived in different houses, 60% moved from this county. Out of people who lived in different houses, 16% moved from different county within same state. Out of people who lived in different houses, 18% moved from different state. Out of people who lived in different houses, 2% moved from abroad.
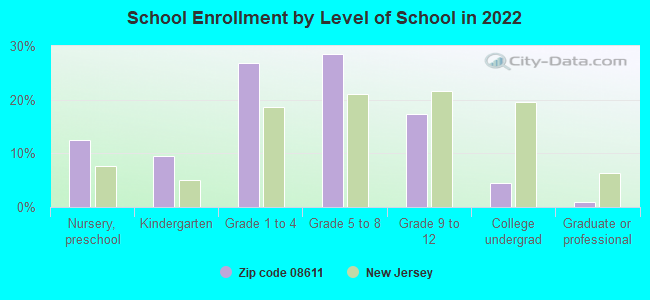
Private vs. public school enrollment:
Students in private schools in grades 1 to 8 (elementary and middle school): 369
Here:
9.5%
New Jersey:
12.3%
Students in private schools in grades 9 to 12 (high school): 38
Here:
3.1%
New Jersey:
13.1%
Students in private undergraduate colleges: 74
Here:
24.0%
New Jersey:
33.2%
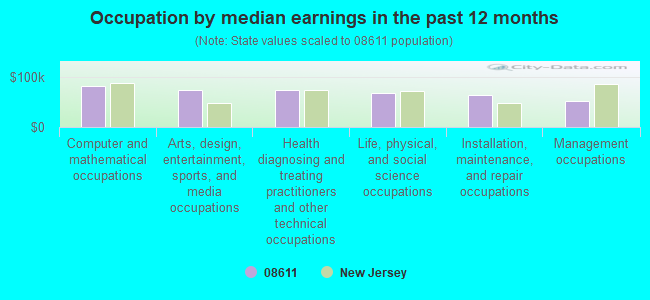
Occupation by median earnings in the past 12 months ($)
81,585Computer and mathematical occupations
73,788Arts, design, entertainment, sports, and media occupations
72,922Health diagnosing and treating practitioners and other technical occupations
68,647Life, physical, and social science occupations
63,911Installation, maintenance, and repair occupations
52,607Management occupations
Companies with federal contracts located in this zip code (TRENTON, NJ):
LANDOLFI FOOD PRODUCTS (302 CUMMINGS AVE; small business) : $203,175 in 7 contractsfrom 2004 to 2006
Contracts for Food Items For Resale by Defense Commissary Agency Signed by year:2000: $0; 2001: $0; 2002: $0; 2003: $0; 2004: $46,802; 2005: $104,459; 2006: $51,914.
Biggest contracts:
$51,914 with Defense Commissary Agency for Food Items For Resale. Signed on 2006-01-01. Completion date: 2005-03-31.
$46,802, same as above.Signed on 2004-10-01. Completion date: 2005-09-30.
$35,623, same as above.Signed on 2005-04-01. Completion date: 2005-08-31.
$29,057, same as above.Signed on 2005-10-01. Completion date: 2005-12-31.
COUNTY OF MERCER (81 HAMILTON AVE; small business) : $31,000 in 2 contractsfrom 2004 to 2005
$17,000 with Army for Advertising Services. Signed on 2005-08-29. Completion date: 2006-09-14.
$14,000, same as above.Signed on 2004-09-15. Completion date: 2005-09-14.
GARDEN STATE BASEBALL, LP (ONE THUNDER RD; small business) : $26,100 in 2 contractsfrom 2003 to 2006
$21,000 with Army for Advertising Services. Signed on 2006-04-18. Completion date: 2006-09-20.
$5,100 with Army for Miscellaneous Printed Matter. Signed on 2003-06-12. Completion date: 2003-09-09.
VASICEK,BOHUMIL (162 MERCER ST; small business) : $20,312 in 5 contractsfrom 2003 to 2005
Contracts for Condiments and Related Products, Food Services by Army Signed by year:2000: $0; 2001: $0; 2002: $0; 2003: $16,374; 2004: $0; 2005: $3,938; 2006: $0.
Biggest contracts:
$14,190 with Army for Condiments and Related Products. Signed on 2003-01-09. Completion date: 2003-01-13.
$4,455, same as above.Signed on 2003-04-07. Completion date: 2003-04-22.
$3,938 with Army for Food Services. Signed on 2005-12-01. Completion date: 2005-12-05.
$270 with Army for Condiments and Related Products. Signed on 2003-05-02. Completion date: 2003-04-22.
GRIFFITH ELECTRIC SUPPLY CO I (5 SECOND STREET; small business)
$16,715 with Army for ADP Support Equipment. Signed on 2004-07-20. Completion date: 2004-08-06.
MARANATHA NOW INC (445 BUNTING AVE; small business)
$4,200 with Navy for Hardware, Commercial. Signed on 2005-04-12. Completion date: 2005-07-04.
Top industries in this zip code by the number of employees in 2005:
Health Care and Social Assistance: General Medical and Surgical Hospitals (500-999 employees: 1 establishment)
Health Care and Social Assistance: Nursing Care Facilities (100-249: 2, 20-49: 1)
Administrative and Support and Waste Management and Remediation Services: Temporary Help Services (100-249: 2, 10-19: 1, 1-4: 1)
2002 - 2018 National Fire Incident Reporting System (NFIRS) incidents
According to the data from the years 2002 - 2018 the average number of fire incidents per year is 66. The highest number of fire incidents - 136 took place in 2007, and the least - 20 in 2017. The data has a dropping trend.
When looking into fire subcategories, the most incidents belonged to: Structure Fires (48.7%), and Other (23.4%).
Fire incident types reported to NFIRS in Zip Code 08611


 Nearest zip codes: 08610, 08629, 08609, 08608, 08619, 08638.
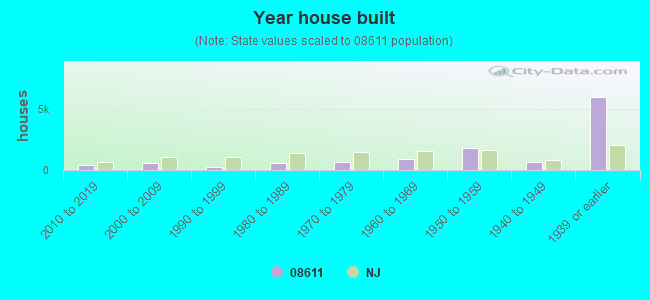


 According to the data from the years 2002 - 2018 the average number of fire incidents per year is 66. The highest number of fire incidents - 136 took place in 2007, and the least - 20 in 2017. The data has a dropping trend.
 When looking into fire subcategories, the most incidents belonged to: Structure Fires (48.7%), and Other (23.4%).