Estimated zip code population in 2022: 16,102 Zip code population in 2010: 16,008 Zip code population in 2000: 15,322
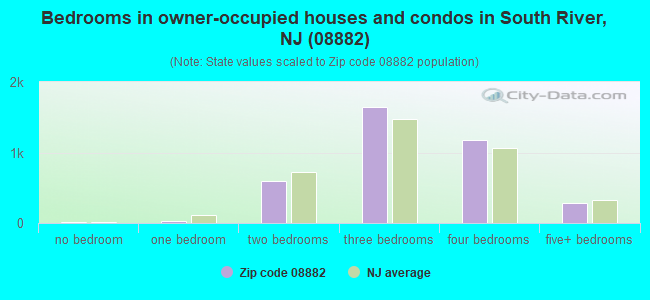
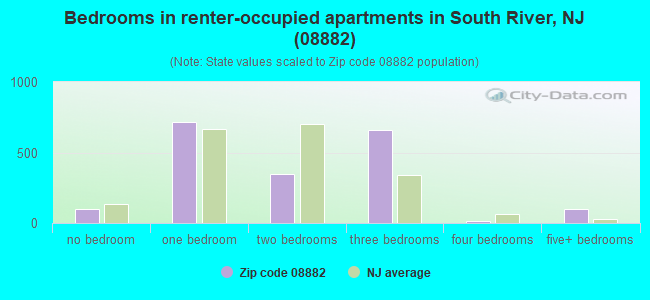
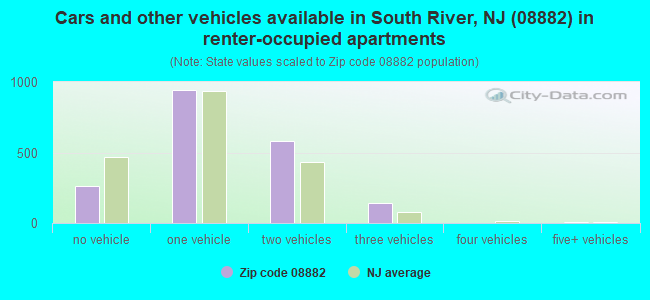
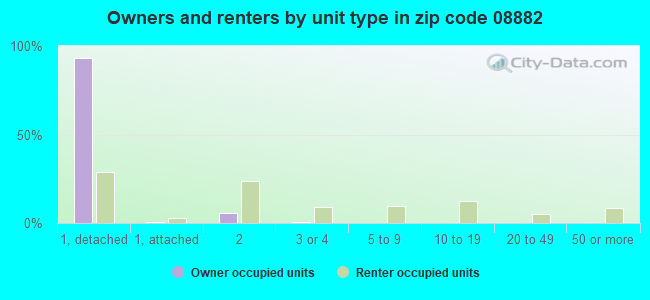
Houses and condos: 5,813 Renter-occupied apartments: 1,933
% of renters here:
34%
State:
35%
March 2022 cost of living index in zip code 08882: 118.9 (more than average, U.S. average is 100)
Land area: 2.8 sq. mi. Water area: 0.1 sq. mi.
Population density: 5,815 people per square mile
(average).
OSM Map
Google Map
MSN Map
OSM Map
General Map
Google Map
MSN Map
OSM Map
Google Map
MSN Map
OSM Map
Google Map
MSN Map
Please wait while loading the map...
Real estate property taxes paid for housing units in 2022:
This zip code:
1.8% ($7,078)
New Jersey:
2.1% ($8,897)
Median real estate property taxes paid for housing units with mortgages in 2022: $7,161 (1.8%) Median real estate property taxes paid for housing units with no mortgage in 2022: $6,962 (1.9%)
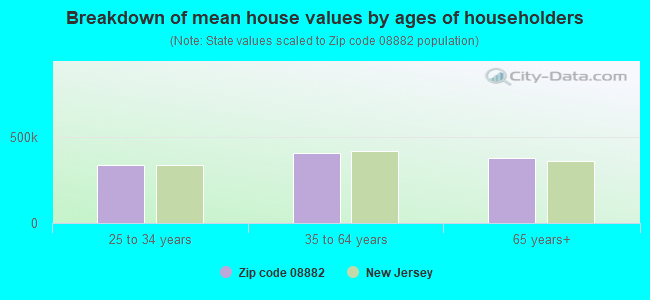
Estimated median house/condo value in 2022: $385,518
08882:
$385,518
New Jersey:
$428,900
According to our research of New Jersey and other state lists, there were 8 registered sex offenders living in 08882 zip code as of April 27, 2024. The ratio of all residents to sex offenders in zip code 08882 is 2,060 to 1. The ratio of registered sex offenders to all residents in this zip code is near the state average.
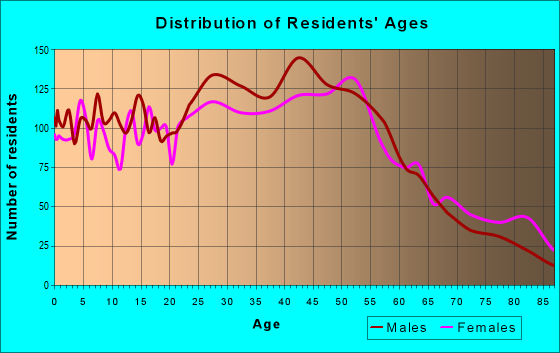
Median resident age:
This zip code:
37.5 years
New Jersey median age:
40.4 years
Average household size:
This zip code:
2.8 people
New Jersey:
2.6 people
Averages for the 2020 tax year for zip code 08882, filed in 2021:
Average Adjusted Gross Income (AGI) in 2020: $64,615 (Individual Income Tax Returns)
Here:
$64,615
State:
$95,247
Salary/wage: $59,916 (reported on 82.2% of returns)
Here:
$59,916
State:
$80,635
(% of AGI for various income ranges: 1277.8% for AGIs below $25k, 3974.5% for AGIs $25k-50k, 7215.1% for AGIs $50k-75k, 10387.8% for AGIs $75k-100k, 19113.9% for AGIs $100k-200k, 68536.7% for AGIs over 200k)
Taxable interest for individuals: $1,400 (reported on 25.9% of returns)
This zip code:
$1,400
New Jersey:
$2,414
(% of AGI for various income ranges: 23.9% for AGIs below $25k, 25.1% for AGIs $25k-50k, 50.9% for AGIs $50k-75k, 62.9% for AGIs $75k-100k, 102.2% for AGIs $100k-200k, 763.3% for AGIs over 200k)
Ordinary dividends: $3,808 (reported on 16.2% of returns)
Here:
$3,808
State:
$8,057
(% of AGI for various income ranges: 17.8% for AGIs below $25k, 26.4% for AGIs $25k-50k, 54.7% for AGIs $50k-75k, 91.2% for AGIs $75k-100k, 244.9% for AGIs $100k-200k, 1740.0% for AGIs over 200k)
Net capital gain/loss in AGI: +$7,004 (reported on 13.2% of returns)
Here:
+$7,004
State:
+$25,022
(% of AGI for various income ranges: 8.3% for AGIs below $25k, 11.2% for AGIs $25k-50k, 43.3% for AGIs $50k-75k, 76.9% for AGIs $75k-100k, 305.6% for AGIs $100k-200k, 4583.3% for AGIs over 200k)
Profit/loss from business: +$10,660 (reported on 16.9% of returns)
Here:
+$10,660
State:
+$18,035
(% of AGI for various income ranges: 292.8% for AGIs below $25k, 201.8% for AGIs $25k-50k, 298.2% for AGIs $50k-75k, 223.9% for AGIs $75k-100k, 326.5% for AGIs $100k-200k, 1585.6% for AGIs over 200k)
Taxable individual retirement arrangement distribution: $13,176 (reported on 6.4% of returns)
08882:
$13,176
New Jersey:
$21,558
(% of AGI for various income ranges: 53.9% for AGIs below $25k, 67.6% for AGIs $25k-50k, 137.9% for AGIs $50k-75k, 180.3% for AGIs $75k-100k, 325.1% for AGIs $100k-200k, 494.4% for AGIs over 200k)
Total itemized deductions: $26,513 (reported on 10.5% of returns)
Here:
$26,513
State:
$32,863
(% of AGI for various income ranges: 84.2% for AGIs below $25k, 188.7% for AGIs $25k-50k, 364.9% for AGIs $50k-75k, 680.7% for AGIs $75k-100k, 1030.1% for AGIs $100k-200k, 4351.1% for AGIs over 200k)
Charity contributions: $5,242 (reported on 8.2% of returns)
Here:
$5,242
State:
$7,880
(% of AGI for various income ranges: 5.8% for AGIs below $25k, 25.9% for AGIs $25k-50k, 47.1% for AGIs $50k-75k, 84.4% for AGIs $75k-100k, 159.3% for AGIs $100k-200k, 1077.8% for AGIs over 200k)
Taxes paid: $8,722 (reported on 10.3% of returns)
08882:
$8,722
State:
$9,183
(% of AGI for various income ranges: 26.2% for AGIs below $25k, 60.7% for AGIs $25k-50k, 132.2% for AGIs $50k-75k, 245.1% for AGIs $75k-100k, 354.2% for AGIs $100k-200k, 1000.0% for AGIs over 200k)
Earned income credit: $2,055 (reported on 11.6% of returns)
Here:
$2,055
State:
$2,148
(% of AGI for various income ranges: 83.1% for AGIs below $25k, 55.8% for AGIs $25k-50k)
Percentage of individuals using paid preparers for their 2020 taxes: 89.0%
Here:
89%
State:
92%
(% for various income ranges: 86.4% for AGIs below $25k, 90.1% for AGIs $25k-50k, 88.4% for AGIs $50k-75k, 90.9% for AGIs $75k-100k, 91.3% for AGIs $100k-200k, 92.3% for AGIs over 200k)
Averages for the 2012 tax year for zip code 08882, filed in 2013:
Average Adjusted Gross Income (AGI) in 2012: $52,211 (Individual Income Tax Returns)
Here:
$52,211
State:
$79,688
Salary/wage: $49,982 (reported on 83.5% of returns)
Here:
$49,982
State:
$68,122
(% of AGI for various income ranges: 69.8% for AGIs below $25k, 80.5% for AGIs $25k-50k, 79.4% for AGIs $50k-75k, 82.1% for AGIs $75k-100k, 82.6% for AGIs $100k-200k, 77.5% for AGIs over 200k)
Taxable interest for individuals: $992 (reported on 33.4% of returns)
This zip code:
$992
New Jersey:
$2,193
(% of AGI for various income ranges: 1.5% for AGIs below $25k, 0.5% for AGIs $25k-50k, 0.7% for AGIs $50k-75k, 0.5% for AGIs $75k-100k, 0.5% for AGIs $100k-200k, 0.4% for AGIs over 200k)
Ordinary dividends: $3,254 (reported on 18.5% of returns)
Here:
$3,254
State:
$6,828
(% of AGI for various income ranges: 1.1% for AGIs below $25k, 0.6% for AGIs $25k-50k, 0.7% for AGIs $50k-75k, 0.6% for AGIs $75k-100k, 1.3% for AGIs $100k-200k, 3.4% for AGIs over 200k)
Net capital gain/loss in AGI: +$2,918 (reported on 10.9% of returns)
Here:
+$2,918
State:
+$15,358
(% of AGI for various income ranges: 0.9% for AGIs $100k-200k, 4.1% for AGIs over 200k)
Profit/loss from business: +$11,372 (reported on 13.4% of returns)
Here:
+$11,372
State:
+$19,577
(% of AGI for various income ranges: 10.6% for AGIs below $25k, 3.8% for AGIs $25k-50k, 3.0% for AGIs $50k-75k, 1.8% for AGIs $75k-100k, 1.8% for AGIs $100k-200k)
Taxable individual retirement arrangement distribution: $12,417 (reported on 7.1% of returns)
08882:
$12,417
New Jersey:
$18,214
(% of AGI for various income ranges: 2.1% for AGIs below $25k, 1.5% for AGIs $25k-50k, 1.7% for AGIs $50k-75k, 1.3% for AGIs $75k-100k, 2.4% for AGIs $100k-200k)
Self-employment retirement plans: $13,400 (reported on 0.3% of returns)
08882:
$13,400
New Jersey:
$24,511
Total itemized deductions: $21,966 (25% of AGI, reported on 37.9% of returns)
Here:
$21,966
State:
$30,827
Here:
24.7% of AGI
State:
21.2% of AGI
(% of AGI for various income ranges: 12.4% for AGIs below $25k, 12.6% for AGIs $25k-50k, 16.3% for AGIs $50k-75k, 17.5% for AGIs $75k-100k, 18.1% for AGIs $100k-200k, 15.2% for AGIs over 200k)
Charity contributions: $2,160 (reported on 31.2% of returns)
Here:
$2,160
State:
$3,451
(% of AGI for various income ranges: 0.7% for AGIs below $25k, 1.1% for AGIs $25k-50k, 1.3% for AGIs $50k-75k, 1.4% for AGIs $75k-100k, 1.5% for AGIs $100k-200k, 1.4% for AGIs over 200k)
Taxes paid: $9,036 (reported on 37.9% of returns)
08882:
$9,036
State:
$15,801
(% of AGI for various income ranges: 4.2% for AGIs below $25k, 4.1% for AGIs $25k-50k, 5.7% for AGIs $50k-75k, 6.9% for AGIs $75k-100k, 8.4% for AGIs $100k-200k, 8.5% for AGIs over 200k)
Earned income credit: $2,005 (reported on 12.4% of returns)
Here:
$2,005
State:
$2,182
(% of AGI for various income ranges: 4.1% for AGIs below $25k, 0.7% for AGIs $25k-50k)
Percentage of individuals using paid preparers for their 2012 taxes: 63.2%
Here:
63%
State:
65%
(% for various income ranges: 59.7% for AGIs below $25k, 63.3% for AGIs $25k-50k, 65.5% for AGIs $50k-75k, 67.5% for AGIs $75k-100k, 67.4% for AGIs $100k-200k, 64.3% for AGIs over 200k)
Averages for the 2004 tax year for zip code 08882, filed in 2005:
Average Adjusted Gross Income (AGI) in 2004: $46,731 (Individual Income Tax Returns)
Here:
$46,731
State:
$64,921
Salary/wage: $44,267 (reported on 84.1% of returns)
Here:
$44,267
State:
$57,755
(% of AGI for various income ranges: 71.0% for AGIs below $10k, 70.5% for AGIs $10k-25k, 84.9% for AGIs $25k-50k, 83.6% for AGIs $50k-75k, 85.7% for AGIs $75k-100k, 73.1% for AGIs over 100k)
Taxable interest for individuals: $1,176 (reported on 49.8% of returns)
This zip code:
$1,176
New Jersey:
$2,068
(% of AGI for various income ranges: 4.7% for AGIs below $10k, 3.4% for AGIs $10k-25k, 1.1% for AGIs $25k-50k, 1.2% for AGIs $50k-75k, 0.9% for AGIs $75k-100k, 0.8% for AGIs over 100k)
Taxable dividends: $2,337 (reported on 23.0% of returns)
Here:
$2,337
State:
$3,959
(% of AGI for various income ranges: 1.9% for AGIs below $10k, 1.3% for AGIs $10k-25k, 0.7% for AGIs $25k-50k, 0.8% for AGIs $50k-75k, 1.3% for AGIs $75k-100k, 1.5% for AGIs over 100k)
Net capital gain/loss: +$5,881 (reported on 15.1% of returns)
Here:
+$5,881
State:
+$13,591
(% of AGI for various income ranges: -1.7% for AGIs below $10k, -0.1% for AGIs $10k-25k, 0.2% for AGIs $25k-50k, 0.3% for AGIs $50k-75k, 0.7% for AGIs $75k-100k, 5.5% for AGIs over 100k)
Profit/loss from business: +$11,697 (reported on 11.3% of returns)
Here:
+$11,697
State:
+$17,520
(% of AGI for various income ranges: 15.7% for AGIs below $10k, 6.6% for AGIs $10k-25k, 2.8% for AGIs $25k-50k, 2.4% for AGIs $50k-75k, 1.0% for AGIs $75k-100k, 2.4% for AGIs over 100k)
IRA payment deduction: $3,217 (reported on 2.2% of returns)
08882:
$3,217
New Jersey:
$3,270
(% of AGI for various income ranges: 0.2% for AGIs $10k-25k, 0.1% for AGIs $25k-50k, 0.2% for AGIs $50k-75k, 0.2% for AGIs $75k-100k, 0.1% for AGIs over 100k)
Self-employed pension: $10,909 (reported on 0.4% of returns)
Here:
$10,909
New Jersey:
$17,258
Total itemized deductions: $19,818 (26% of AGI, reported on 40.3% of returns)
Here:
$19,818
State:
$23,924
Here:
25.8% of AGI
State:
21.1% of AGI
(% of AGI for various income ranges: 13.2% for AGIs below $10k, 13.4% for AGIs $10k-25k, 14.2% for AGIs $25k-50k, 23.4% for AGIs $50k-75k, 18.3% for AGIs $75k-100k, 15.3% for AGIs over 100k)
Charity contributions deductions: $2,365 (3% of AGI, reported on 36.6% of returns)
Here:
$2,365
State:
$3,242
Here:
3.0% of AGI
State:
2.7% of AGI
(% of AGI for various income ranges: 0.9% for AGIs below $10k, 1.2% for AGIs $10k-25k, 1.5% for AGIs $25k-50k, 2.1% for AGIs $50k-75k, 2.1% for AGIs $75k-100k, 2.0% for AGIs over 100k)
Total tax: $6,273 (reported on 78.4% of returns)
08882:
$6,273
State:
$12,321
(% of AGI for various income ranges: 3.3% for AGIs below $10k, 4.4% for AGIs $10k-25k, 7.0% for AGIs $25k-50k, 8.9% for AGIs $50k-75k, 9.8% for AGIs $75k-100k, 16.4% for AGIs over 100k)
Earned income credit: $1,646 (reported on 9.2% of returns)
Here:
$1,646
State:
$1,711
Percentage of individuals using paid preparers for their 2004 taxes: 66.8%
Here:
67%
State:
65%
(% for various income ranges: 55.9% for AGIs below $10k, 66.3% for AGIs $10k-25k, 68.8% for AGIs $25k-50k, 71.8% for AGIs $50k-75k, 71.0% for AGIs $75k-100k, 69.3% for AGIs over 100k)
Likely homosexual households (counted as self-reported same-sex unmarried-partner households)
Lesbian couples: 0.0% of all households
Gay men: 0.2% of all households
Household received Food Stamps/SNAP in the past 12 months: 419 Household did not receive Food Stamps/SNAP in the past 12 months: 5,247
Women who had a birth in the past 12 months: 431 (231 now married, 194 unmarried) Women who did not have a birth in the past 12 months: 2,916 (1,084 now married, 1,834 unmarried)
Housing units in zip code 08882 with a mortgage: 2,215 (236 second mortgage, 20 home equity loan, 181 both second mortgage and home equity loan) Houses without a mortgage: 87
Median monthly owner costs for units with a mortgage: $2,244 Median monthly owner costs for units without a mortgage: $903
Residents with income below the poverty level in 2022:
This zip code:
12.2%
Whole state:
9.7%
Residents with income below 50% of the poverty level in 2022:
This zip code:
8.4%
Whole state:
5.2%
Median number of rooms in houses and condos:
Here:
6.8
State:
6.8
Median number of rooms in apartments:
Here:
4.6
State:
3.9
Notable locations in this zip code not listed on our city pages
Notable locations in zip code 08882: South River Rescue Squad (A), South River Fire Station 2 Summit Fire House (B), South River Fire Department (C). Display/hide their locations on the map
Churches in zip code 08882 include: First Russian Baptist Church (A), Evangelical Church of God (B), Christian Life Fellowship Center (C), Redentor Presbyterian Church (D), Union Baptist Church (E), Conklin United Methodist Church (F), Congregation Anshe Emethodist (G), Tabernacle Baptist Church (H), Saint Mary of Ostrabrama Church (I). Display/hide their locations on the map
Parks in zip code 08882 include: Bissett's Recreation Area (1), Daley's Pond Recreation Area (2), Pacer's Field (3), Veterans Park Recreation Area (4). Display/hide their locations on the map
1,913 married couples with children.
1,595 single-parent households (506 men, 1,089 women).
51.3% of residents of 08882 zip code speak English at home.
22.8% of residents speak Spanish at home (45% very well, 20% well, 30% not well, 5% not at all).
19.8% of residents speak other Indo-European language at home (60% very well, 25% well, 13% not well, 1% not at all).
3.6% of residents speak Asian or Pacific Island language at home (79% very well, 21% well).
2.1% of residents speak other language at home (38% very well, 29% well, 18% not well, 15% not at all).
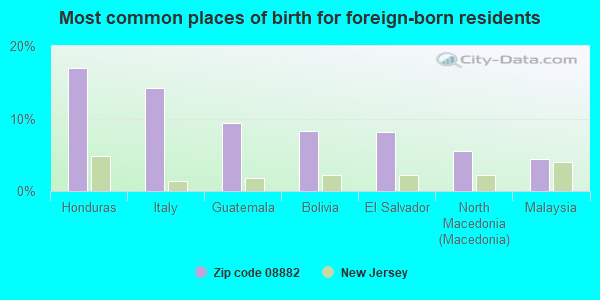
Foreign born population: 4,636 (28.8%) (57.0% of them are naturalized citizens)
This zip code:
28.8%
Whole state:
23.5%
17%Honduras
14%Italy
9%Guatemala
8%Bolivia
8%El Salvador
6%North Macedonia (Macedonia)
4%Malaysia
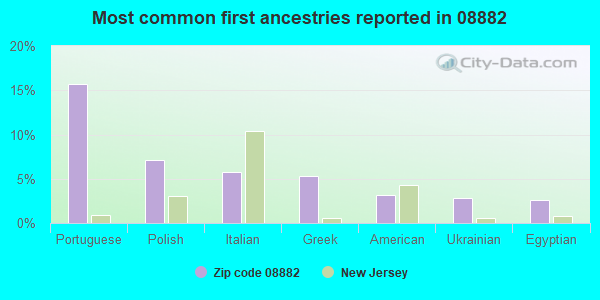
16%Portuguese
7%Polish
6%Italian
5%Greek
3%American
3%Ukrainian
3%Egyptian
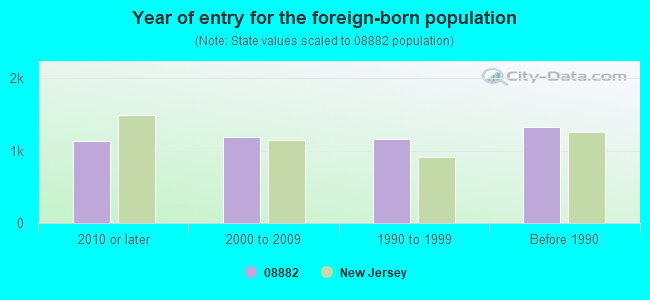
Year of entry for the foreign-born population
1,1292010 or later
1,1872000 to 2009
1,1651990 to 1999
1,324Before 1990
Facilities with environmental interests located in this zip code:
ESTATE OF KROSNOWSKI ADAM C (22 OLD BRIDGE TNPK in SOUTH RIVER, NJ)
STATE MASTER (New Jersey environmental info) - NJEMS-030601, STATE CLEANUP SITE (Resource Conservation and Recovery Act (tracking hazardous waste)) Organizations: ESTATE OF KROSWOWSKI ADAM C (CONTACT/OWNER)
Alternative names: KROSNOWSKI ADAM C ESTATE OF, KROSNOWSKI ADAM ESTATE OF
FINE LINE AUTO BODY (20 GATES AVE in SOUTH RIVER, NJ)
STATE MASTER (New Jersey environmental info) - NJEMS-G1599, AIR PROGRAM (Resource Conservation and Recovery Act (tracking hazardous waste))
70 MAIN STREET (70 MAIN STREET in SOUTH RIVER, NJ)
AIR MINOR (AIRS/AFS) STATE MASTER (New Jersey environmental info) - NJEMS-130255, STATE CLEANUP SITE Business SIC classification: DRYCLEANING PLANTS, EXCEPT RUG CLEANING Alternative names: HOMS LAUNDRY
AMERICAN INTERNATIONAL CHEMICAL INCORPORATED (330 WILLIAMS STREET in SOUTH RIVER, NJ)
COMPLIANCE ACTIVITY (Tracking inspections of insecticide, fungicide, and rodenticide, and toxic substances) Alternative names: AMERICA INTERNATIONAL, INC C/O INGREDIEN, AMERICAN INT'L CHEM, INC C/O INGREDIENT
CIFELLI & SONS INC (38 OBERT ST in SOUTH RIVER, NJ)
National Pollutant Discharge Elimination System NON-MAJOR (Tracking pollutant discharge elimination systems) - permit
NJDOT BRIDGE BLASTING PAINTING (STRUCTURE 1251-160 RTE 527 in SOUTH RIVER, NJ)
(Resource Conservation and Recovery Act (tracking hazardous waste)) Organizations: STATE OF NJ (CONTACT/OWNER)
NJDOT BRIDGE BLASTING PAINTING (STRUCTURE 1251-161 RTE 535 in SOUTH RIVER, NJ)
(Resource Conservation and Recovery Act (tracking hazardous waste)) Organizations: STATE OF NJ (CONTACT/OWNER)
NORTH END INDUSTRIAL PARK (BRICK PLANT RD & N END DR in SOUTH RIVER, NJ)
(Resource Conservation and Recovery Act (tracking hazardous waste))
CHRYSLER REALTY CORP (PROSPECT ST & OLD BRG TNPK in SOUTH RIVER, NJ)
(Resource Conservation and Recovery Act (tracking hazardous waste))
ALUMET CORPORATION (WHITEHEAD AVENUE in SOUTH RIVER, NJ)
AIR SYNTHETIC MINOR (AIRS/AFS) Business SIC classification: MINERALS AND EARTHS, GROUND OR OTHERWISE TREATED; SECONDARY SMELTING AND REFINING OF NONFERROUS METALS
BOROUGH OF SOUTH RIVER ELECTRIC (WILLET ST SUBSTATION in SOUTH RIVER, NJ)
COMPLIANCE ACTIVITY (Tracking inspections of insecticide, fungicide, and rodenticide, and toxic substances)
BOROUGH OF SOUTH RIVER ELECTRIC (POLE - MAIN & JACKSON ST in SOUTH RIVER, NJ)
COMPLIANCE ACTIVITY (Tracking inspections of insecticide, fungicide, and rodenticide, and toxic substances)
Housing units lacking complete kitchen facilities: 0.1%
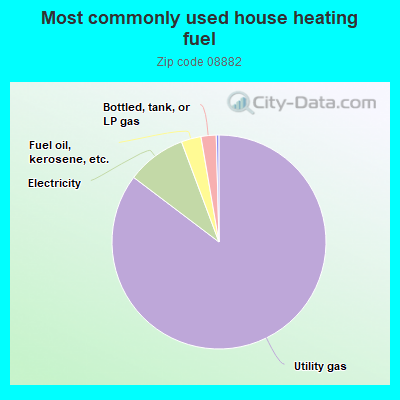
85.4%Utility gas
9.0%Electricity
3.0%Fuel oil, kerosene, etc.
2.3%Bottled, tank, or LP gas
Population in 1990: 13,692. Population change in the 1990s: +1,630 (+11.9%).
Place of birth for U.S.-born residents:
This state: 9,449
Northeast: 1,171
Midwest: 107
South: 431
West: 19
63% of the 08882 zip code residents lived in the same house 5 years ago. Out of people who lived in different houses, 69% lived in this county. Out of people who lived in different counties, 50% lived in New Jersey.
92% of the 08882 zip code residents lived in the same house 1 year ago. Out of people who lived in different houses, 61% moved from this county. Out of people who lived in different houses, 15% moved from different county within same state. Out of people who lived in different houses, 20% moved from different state. Out of people who lived in different houses, 2% moved from abroad.
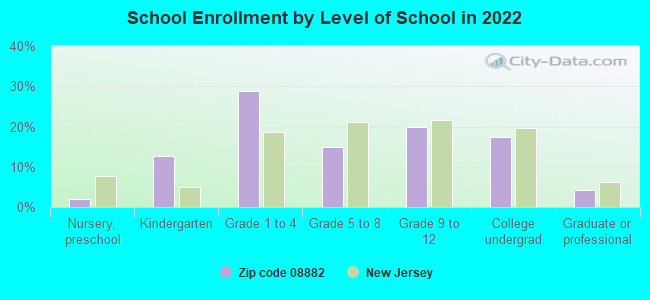
Private vs. public school enrollment:
Students in private schools in grades 1 to 8 (elementary and middle school): 173
Here:
11.6%
New Jersey:
12.3%
Students in private schools in grades 9 to 12 (high school): 133
Here:
19.5%
New Jersey:
13.1%
Students in private undergraduate colleges: 178
Here:
29.9%
New Jersey:
33.2%
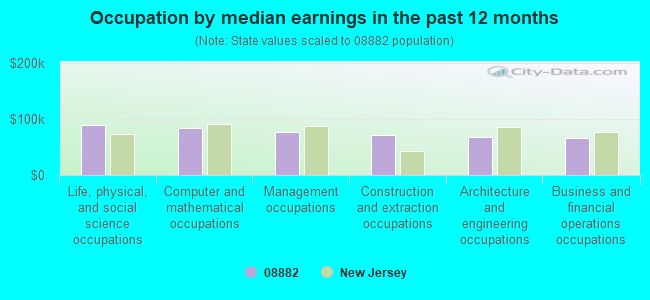
Occupation by median earnings in the past 12 months ($)
89,502Life, physical, and social science occupations
83,961Computer and mathematical occupations
76,682Management occupations
72,570Construction and extraction occupations
68,574Architecture and engineering occupations
67,065Business and financial operations occupations
Companies with federal contracts located in this zip code:
DAGREEN ELECTRONICS LTD (37 MAIN ST in SOUTH RIVER, NJ; small business) : $1,107,990 in 73 contractsfrom 1999 to 2006
Contracts for Connectors, Electrical, Lugs, Terminals, and Terminal Strips, Scientific Data Studies, Miscellaneous Electrical and Electronic Components, and moreby Bureau of Prisoners/Federal Prison System, Defense Logistics Agency, NASA, Army, and others Signed by year:2000: $33,227; 2001: $142,590; 2002: $104,000; 2003: $46,045; 2004: $376,404; 2005: $221,469; 2006: $111,380.
Biggest contracts:
$77,000 with Bureau of Prisoners/Federal Prison System for Connectors, Electrical. Signed on 2004-06-04. Completion date: 2009-04-04.
$74,205, same as above.Signed on 2004-04-20. Completion date: 2004-07-30.
$53,618 with Defense Logistics Agency for Lugs, Terminals, and Terminal Strips. Signed on 2005-01-06. Completion date: 2005-04-16.
$49,225 with Defense Logistics Agency for Connectors, Electrical. Signed on 2004-06-28. Completion date: 2004-09-30.
GMT ELECTRONICS, INC (171 MAIN STREET in SOUTH RIVER, NJ; small business) 50 employees, $0 revenue.
$4,794 with Navy for Non-nuclear Ship Repair (East) Ship repair (including overhauls and conversions) performed on non-nuclear propelled and nonpropelled ships east of the 108th meridian. Taking place in VA. Signed on 2003-08-07. Completion date: 2003-08-01.
Top industries in this zip code by the number of employees in 2005:
Wholesale Trade: Men's and Boys' Clothing and Furnishings Merchant Wholesalers (250-499 employees: 1 establishment, 10-19 employees: 1 establishment)
2004 - 2018 National Fire Incident Reporting System (NFIRS) incidents
Based on the data from the years 2004 - 2018 the average number of fire incidents per year is 31. The highest number of fire incidents - 95 took place in 2012, and the least - 3 in 2011. The data has a dropping trend.
When looking into fire subcategories, the most incidents belonged to: Structure Fires (65.8%), and Outside Fires (25.4%).
Fire incident types reported to NFIRS in Zip Code 08882


 Nearest zip codes: 08872, 08816, 08884, 08850, 08817, 08857.


 Based on the data from the years 2004 - 2018 the average number of fire incidents per year is 31. The highest number of fire incidents - 95 took place in 2012, and the least - 3 in 2011. The data has a dropping trend.
 When looking into fire subcategories, the most incidents belonged to: Structure Fires (65.8%), and Outside Fires (25.4%).