Estimated zip code population in 2022: 28,604 Zip code population in 2010: 28,647 Zip code population in 2000: 29,368
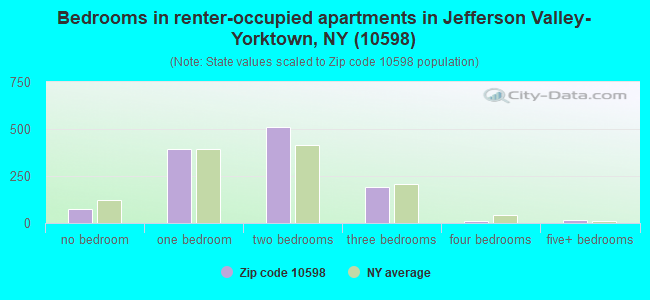
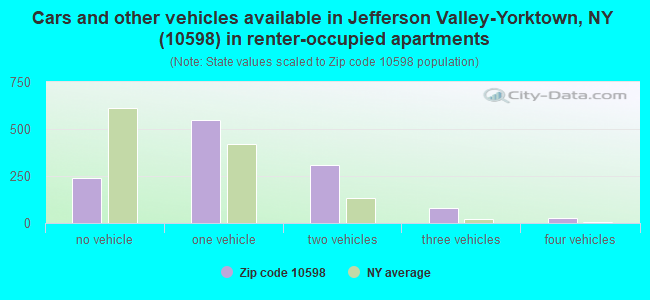
Houses and condos: 11,236 Renter-occupied apartments: 1,199
% of renters here:
11%
State:
46%
March 2022 cost of living index in zip code 10598: 146.9 (very high, U.S. average is 100)
Land area: 26.5 sq. mi. Water area: 2.9 sq. mi.
Population density: 1,080 people per square mile
(low).
OSM Map
General Map
Google Map
MSN Map
OSM Map
General Map
Google Map
MSN Map
OSM Map
General Map
Google Map
MSN Map
OSM Map
General Map
Google Map
MSN Map
Please wait while loading the map...
Real estate property taxes paid for housing units in 2022:
This zip code:
1.7% ($9,805)
New York:
1.5% ($6,180)
Median real estate property taxes paid for housing units with mortgages in 2022: $9,858 (1.6%) Median real estate property taxes paid for housing units with no mortgage in 2022: $9,755 (1.8%)
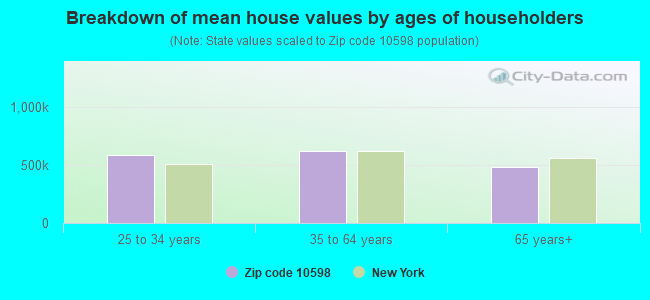
Estimated median house/condo value in 2022: $588,768
10598:
$588,768
New York:
$400,400
According to our research of New York and other state lists, there were 3 registered sex offenders living in 10598 zip code as of April 27, 2024. The ratio of all residents to sex offenders in zip code 10598 is 9,970 to 1. The ratio of registered sex offenders to all residents in this zip code is much lower than the state average.
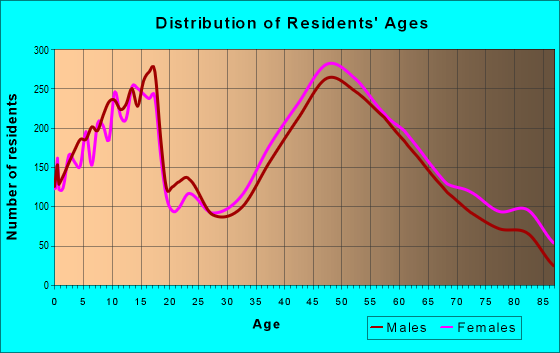
Median resident age:
This zip code:
46.4 years
New York median age:
40.0 years
Average household size:
This zip code:
2.7 people
New York:
2.5 people
Averages for the 2020 tax year for zip code 10598, filed in 2021:
Average Adjusted Gross Income (AGI) in 2020: $123,530 (Individual Income Tax Returns)
Here:
$123,530
State:
$90,930
Salary/wage: $108,557 (reported on 79.4% of returns)
Here:
$108,557
State:
$72,104
(% of AGI for various income ranges: 1044.8% for AGIs below $25k, 3524.2% for AGIs $25k-50k, 6563.3% for AGIs $50k-75k, 9491.5% for AGIs $75k-100k, 19430.9% for AGIs $100k-200k, 81474.7% for AGIs over 200k)
Taxable interest for individuals: $1,498 (reported on 55.2% of returns)
This zip code:
$1,498
New York:
$3,075
(% of AGI for various income ranges: 33.2% for AGIs below $25k, 55.5% for AGIs $25k-50k, 84.5% for AGIs $50k-75k, 114.8% for AGIs $75k-100k, 177.7% for AGIs $100k-200k, 659.5% for AGIs over 200k)
Ordinary dividends: $6,623 (reported on 39.2% of returns)
Here:
$6,623
State:
$11,095
(% of AGI for various income ranges: 76.1% for AGIs below $25k, 134.5% for AGIs $25k-50k, 191.0% for AGIs $50k-75k, 277.1% for AGIs $75k-100k, 487.0% for AGIs $100k-200k, 2572.7% for AGIs over 200k)
Net capital gain/loss in AGI: +$18,832 (reported on 33.4% of returns)
Here:
+$18,832
State:
+$44,925
(% of AGI for various income ranges: 32.1% for AGIs below $25k, 89.5% for AGIs $25k-50k, 225.8% for AGIs $50k-75k, 244.2% for AGIs $75k-100k, 555.3% for AGIs $100k-200k, 9365.6% for AGIs over 200k)
Profit/loss from business: +$18,530 (reported on 15.2% of returns)
Here:
+$18,530
State:
+$14,940
(% of AGI for various income ranges: 112.1% for AGIs below $25k, 194.2% for AGIs $25k-50k, 183.2% for AGIs $50k-75k, 254.0% for AGIs $75k-100k, 563.9% for AGIs $100k-200k, 2654.9% for AGIs over 200k)
Taxable individual retirement arrangement distribution: $21,129 (reported on 12.8% of returns)
10598:
$21,129
New York:
$19,609
(% of AGI for various income ranges: 112.3% for AGIs below $25k, 186.4% for AGIs $25k-50k, 280.3% for AGIs $50k-75k, 426.4% for AGIs $75k-100k, 762.5% for AGIs $100k-200k, 1598.0% for AGIs over 200k)
Self-employed (Keogh) retirement plans: $23,395 (reported on 1.4% of returns)
10598:
$23,395
New York:
$32,497
(% of AGI for various income ranges: 7.0% for AGIs below $25k, 44.6% for AGIs $100k-200k, 478.4% for AGIs over 200k)
Total itemized deductions: $30,719 (reported on 22.0% of returns)
Here:
$30,719
State:
$39,326
(% of AGI for various income ranges: 151.2% for AGIs below $25k, 376.7% for AGIs $25k-50k, 633.7% for AGIs $50k-75k, 1010.2% for AGIs $75k-100k, 1746.6% for AGIs $100k-200k, 5043.5% for AGIs over 200k)
Charity contributions: $5,882 (reported on 19.3% of returns)
Here:
$5,882
State:
$15,420
(% of AGI for various income ranges: 6.0% for AGIs below $25k, 27.0% for AGIs $25k-50k, 61.1% for AGIs $50k-75k, 112.8% for AGIs $75k-100k, 235.8% for AGIs $100k-200k, 1218.4% for AGIs over 200k)
Taxes paid: $9,523 (reported on 22.0% of returns)
10598:
$9,523
State:
$9,183
(% of AGI for various income ranges: 42.2% for AGIs below $25k, 114.2% for AGIs $25k-50k, 214.1% for AGIs $50k-75k, 344.9% for AGIs $75k-100k, 594.2% for AGIs $100k-200k, 1384.4% for AGIs over 200k)
Earned income credit: $1,577 (reported on 4.4% of returns)
Here:
$1,577
State:
$2,138
(% of AGI for various income ranges: 33.2% for AGIs below $25k, 32.7% for AGIs $25k-50k)
Percentage of individuals using paid preparers for their 2020 taxes: 94.2%
Here:
94%
State:
95%
(% for various income ranges: 92.4% for AGIs below $25k, 94.0% for AGIs $25k-50k, 94.3% for AGIs $50k-75k, 94.0% for AGIs $75k-100k, 94.8% for AGIs $100k-200k, 95.6% for AGIs over 200k)
Averages for the 2012 tax year for zip code 10598, filed in 2013:
Average Adjusted Gross Income (AGI) in 2012: $113,712 (Individual Income Tax Returns)
Here:
$113,712
State:
$77,088
Salary/wage: $103,397 (reported on 81.4% of returns)
Here:
$103,397
State:
$60,593
(% of AGI for various income ranges: 65.7% for AGIs below $25k, 68.2% for AGIs $25k-50k, 65.0% for AGIs $50k-75k, 67.5% for AGIs $75k-100k, 76.7% for AGIs $100k-200k, 75.5% for AGIs over 200k)
Taxable interest for individuals: $1,397 (reported on 61.5% of returns)
This zip code:
$1,397
New York:
$3,125
(% of AGI for various income ranges: 2.8% for AGIs below $25k, 1.6% for AGIs $25k-50k, 1.3% for AGIs $50k-75k, 1.0% for AGIs $75k-100k, 0.7% for AGIs $100k-200k, 0.5% for AGIs over 200k)
Ordinary dividends: $8,133 (reported on 40.8% of returns)
Here:
$8,133
State:
$10,299
(% of AGI for various income ranges: 4.3% for AGIs below $25k, 2.3% for AGIs $25k-50k, 2.4% for AGIs $50k-75k, 1.7% for AGIs $75k-100k, 1.5% for AGIs $100k-200k, 4.1% for AGIs over 200k)
Net capital gain/loss in AGI: +$8,647 (reported on 30.3% of returns)
Here:
+$8,647
State:
+$42,474
(% of AGI for various income ranges: 0.5% for AGIs $25k-50k, 0.8% for AGIs $50k-75k, 1.2% for AGIs $75k-100k, 0.8% for AGIs $100k-200k, 4.0% for AGIs over 200k)
Profit/loss from business: +$21,184 (reported on 15.7% of returns)
Here:
+$21,184
State:
+$16,168
(% of AGI for various income ranges: 6.9% for AGIs below $25k, 3.9% for AGIs $25k-50k, 3.0% for AGIs $50k-75k, 3.2% for AGIs $75k-100k, 2.7% for AGIs $100k-200k, 2.7% for AGIs over 200k)
Taxable individual retirement arrangement distribution: $16,886 (reported on 15.5% of returns)
10598:
$16,886
New York:
$17,621
(% of AGI for various income ranges: 5.6% for AGIs below $25k, 3.9% for AGIs $25k-50k, 4.2% for AGIs $50k-75k, 3.4% for AGIs $75k-100k, 2.7% for AGIs $100k-200k, 1.3% for AGIs over 200k)
Self-employment retirement plans: $18,725 (reported on 1.7% of returns)
10598:
$18,725
New York:
$27,330
(% of AGI for various income ranges: 0.3% for AGIs $75k-100k, 0.2% for AGIs $100k-200k, 0.4% for AGIs over 200k)
Total itemized deductions: $36,687 (21% of AGI, reported on 58.8% of returns)
Here:
$36,687
State:
$34,985
Here:
21.2% of AGI
State:
21.3% of AGI
(% of AGI for various income ranges: 22.0% for AGIs below $25k, 20.8% for AGIs $25k-50k, 21.6% for AGIs $50k-75k, 22.9% for AGIs $75k-100k, 22.5% for AGIs $100k-200k, 15.2% for AGIs over 200k)
Charity contributions: $3,007 (reported on 53.2% of returns)
Here:
$3,007
State:
$5,572
(% of AGI for various income ranges: 0.9% for AGIs below $25k, 1.4% for AGIs $25k-50k, 1.6% for AGIs $50k-75k, 1.8% for AGIs $75k-100k, 1.7% for AGIs $100k-200k, 1.1% for AGIs over 200k)
Taxes paid: $21,495 (reported on 58.7% of returns)
10598:
$21,495
State:
$18,656
(% of AGI for various income ranges: 8.2% for AGIs below $25k, 8.7% for AGIs $25k-50k, 9.9% for AGIs $50k-75k, 11.9% for AGIs $75k-100k, 12.3% for AGIs $100k-200k, 10.7% for AGIs over 200k)
Earned income credit: $1,682 (reported on 4.7% of returns)
Here:
$1,682
State:
$2,230
(% of AGI for various income ranges: 2.1% for AGIs below $25k, 0.4% for AGIs $25k-50k)
Percentage of individuals using paid preparers for their 2012 taxes: 67.3%
Here:
67%
State:
66%
(% for various income ranges: 59.8% for AGIs below $25k, 66.5% for AGIs $25k-50k, 69.5% for AGIs $50k-75k, 71.1% for AGIs $75k-100k, 71.7% for AGIs $100k-200k, 70.6% for AGIs over 200k)
Averages for the 2004 tax year for zip code 10598, filed in 2005:
Average Adjusted Gross Income (AGI) in 2004: $82,642 (Individual Income Tax Returns)
Here:
$82,642
State:
$59,519
Salary/wage: $78,108 (reported on 80.7% of returns)
Here:
$78,108
State:
$50,673
(% of AGI for various income ranges: 114.1% for AGIs below $10k, 55.6% for AGIs $10k-25k, 67.9% for AGIs $25k-50k, 71.1% for AGIs $50k-75k, 76.9% for AGIs $75k-100k, 78.1% for AGIs over 100k)
Taxable interest for individuals: $1,529 (reported on 76.2% of returns)
This zip code:
$1,529
New York:
$2,377
(% of AGI for various income ranges: 12.5% for AGIs below $10k, 5.4% for AGIs $10k-25k, 2.6% for AGIs $25k-50k, 1.9% for AGIs $50k-75k, 1.2% for AGIs $75k-100k, 1.0% for AGIs over 100k)
Taxable dividends: $2,857 (reported on 50.2% of returns)
Here:
$2,857
State:
$5,394
(% of AGI for various income ranges: 11.2% for AGIs below $10k, 3.9% for AGIs $10k-25k, 2.3% for AGIs $25k-50k, 1.9% for AGIs $50k-75k, 1.3% for AGIs $75k-100k, 1.6% for AGIs over 100k)
Net capital gain/loss: +$6,373 (reported on 40.0% of returns)
Here:
+$6,373
State:
+$23,581
(% of AGI for various income ranges: -8.5% for AGIs below $10k, -0.2% for AGIs $10k-25k, 0.2% for AGIs $25k-50k, 0.7% for AGIs $50k-75k, 0.8% for AGIs $75k-100k, 4.3% for AGIs over 100k)
Profit/loss from business: +$20,638 (reported on 16.3% of returns)
Here:
+$20,638
State:
+$13,809
(% of AGI for various income ranges: 6.1% for AGIs below $10k, 7.0% for AGIs $10k-25k, 5.3% for AGIs $25k-50k, 4.4% for AGIs $50k-75k, 3.4% for AGIs $75k-100k, 3.9% for AGIs over 100k)
IRA payment deduction: $3,600 (reported on 4.1% of returns)
10598:
$3,600
New York:
$3,115
(% of AGI for various income ranges: 0.3% for AGIs below $10k, 0.4% for AGIs $10k-25k, 0.5% for AGIs $25k-50k, 0.3% for AGIs $50k-75k, 0.2% for AGIs $75k-100k, 0.1% for AGIs over 100k)
Self-employed pension: $13,414 (reported on 2.5% of returns)
Here:
$13,414
New York:
$19,016
(% of AGI for various income ranges: 0.8% for AGIs below $10k, 0.3% for AGIs $25k-50k, 0.2% for AGIs $50k-75k, 0.3% for AGIs $75k-100k, 0.5% for AGIs over 100k)
Total itemized deductions: $28,445 (23% of AGI, reported on 59.9% of returns)
Here:
$28,445
State:
$25,864
Here:
23.1% of AGI
State:
21.9% of AGI
(% of AGI for various income ranges: 23.0% for AGIs below $10k, 22.0% for AGIs $10k-25k, 21.8% for AGIs $25k-50k, 24.9% for AGIs $50k-75k, 25.2% for AGIs $75k-100k, 19.0% for AGIs over 100k)
Charity contributions deductions: $3,035 (2% of AGI, reported on 57.1% of returns)
Here:
$3,035
State:
$4,439
Here:
2.4% of AGI
State:
3.6% of AGI
(% of AGI for various income ranges: 1.0% for AGIs below $10k, 1.9% for AGIs $10k-25k, 2.1% for AGIs $25k-50k, 2.4% for AGIs $50k-75k, 2.4% for AGIs $75k-100k, 2.0% for AGIs over 100k)
Total tax: $14,781 (reported on 82.9% of returns)
10598:
$14,781
State:
$11,730
(% of AGI for various income ranges: 3.6% for AGIs below $10k, 4.6% for AGIs $10k-25k, 7.7% for AGIs $25k-50k, 8.9% for AGIs $50k-75k, 9.3% for AGIs $75k-100k, 17.8% for AGIs over 100k)
Earned income credit: $1,239 (reported on 3.0% of returns)
Here:
$1,239
State:
$1,757
Percentage of individuals using paid preparers for their 2004 taxes: 66.3%
Here:
66%
State:
67%
(% for various income ranges: 56.0% for AGIs below $10k, 66.4% for AGIs $10k-25k, 67.1% for AGIs $25k-50k, 72.6% for AGIs $50k-75k, 72.0% for AGIs $75k-100k, 67.5% for AGIs over 100k)
Likely homosexual households (counted as self-reported same-sex unmarried-partner households)
Lesbian couples: 0.2% of all households
Gay men: 0.1% of all households
Household received Food Stamps/SNAP in the past 12 months: 449 Household did not receive Food Stamps/SNAP in the past 12 months: 10,110
Women who had a birth in the past 12 months: 159 (156 now married, 0 unmarried) Women who did not have a birth in the past 12 months: 5,801 (2,665 now married, 3,109 unmarried)
Housing units in zip code 10598 with a mortgage: 5,801 (584 second mortgage, 558 both second mortgage and home equity loan) Houses without a mortgage: 157
Median monthly owner costs for units with a mortgage: $3,360 Median monthly owner costs for units without a mortgage: $1,487
Residents with income below the poverty level in 2022:
This zip code:
4.3%
Whole state:
14.3%
Residents with income below 50% of the poverty level in 2022:
This zip code:
2.0%
Whole state:
6.8%
Median number of rooms in houses and condos:
Here:
7.0
State:
6.3
Median number of rooms in apartments:
Here:
3.8
State:
3.8
Notable locations in this zip code not listed on our city pages
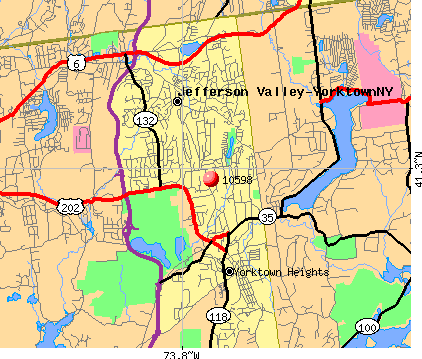
Notable locations in zip code 10598: Yorktown Heights Sewer District Wastewater Treatment Plant (A), Yorktown Heights Water Pollution Control Plant (B), Mohansic Golf Course (C), Wilkens Fruit And Fir Farm (D), Locke Ledge Country Club (E), Yorktown Heights Town Hall (F), Yorktown Heights Fire Department Engine Company 1 (G), Jefferson Valley Fire Station (H), Country House in Westchester Adult Care Facility (I), Yorktown Museum (J), Yorktown Heights Fire Department (K). Display/hide their locations on the map
Churches in zip code 10598 include: Amawalk Friends Meeting House (A), Saint Andrews Evangelical Lutheran Church (B), Tomahawk Chapel (C), Leila Leeds Memorial Chapel (D), Hebrew Congregation of Somers (E), First Presbyterian Church (F), Saint Patrick's Church (G), Temple Beth Am (H), Calvary Bible Church (I). Display/hide their locations on the map
Lakes, reservoirs, and swamps: Loretta Lake (A), Mill Pond (B), Mohansic Lake (C), Sparkle Lake (D), Crom Pond (E), Deer Pond (F), Lake Shenorock (G), Amawalk Reservoir (H). Display/hide their locations on the map
Parks in zip code 10598 include: Hemlock Brook Preserve (1), Koegel Park (2), Mohansic State Park (3), Downing Park (4), Yorktown Memorial Park (5). Display/hide their locations on the map
In group quarters: 105 (-1 institutionalized population)
Size of family households: 3,568 2-persons, 1,908 3-persons, 1,734 4-persons, 713 5-persons, 191 6-persons, 88 7-or-more-persons
Size of nonfamily households: 2,228 1-person, 159 2-persons, 15 4-persons
4,774 married couples with children.
514 single-parent households (201 men, 313 women).
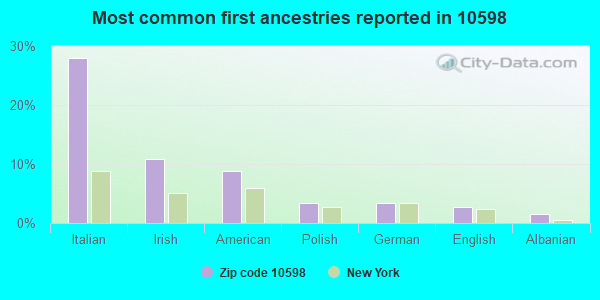
80.5% of residents of 10598 zip code speak English at home.
7.7% of residents speak Spanish at home (78% very well, 18% well, 2% not well, 2% not at all).
7.0% of residents speak other Indo-European language at home (80% very well, 14% well, 7% not well).
3.0% of residents speak Asian or Pacific Island language at home (57% very well, 28% well, 15% not well).
1.6% of residents speak other language at home (88% very well, 6% well, 7% not well).
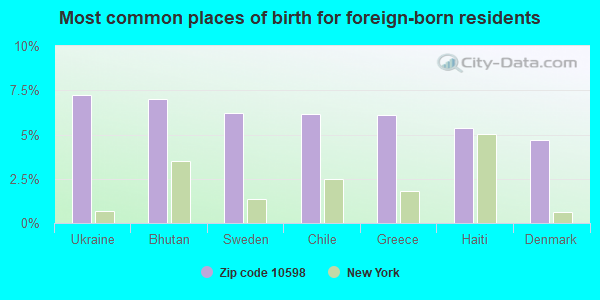
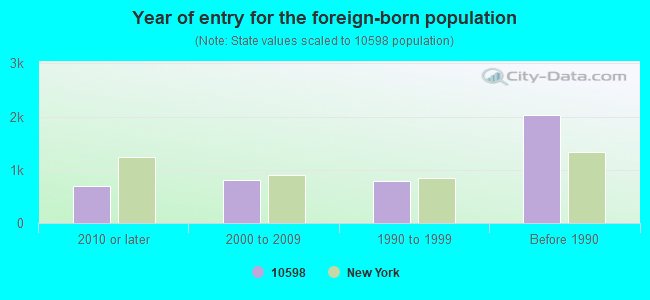
Foreign born population: 3,912 (13.7%) (74.3% of them are naturalized citizens)
Facilities with environmental interests located in this zip code:
CROTON LAKE GATEHOUSE (1120 CROTON DAM ROAD in YORKTOWN HEIGHTS, NY)
STATE MASTER (New York facility tracking) - SECTION 404 PERMITTING HAZARDOUS WASTE BIENNIAL REPORTER (Resource Conservation and Recovery Act (tracking hazardous waste)) Large Quantity Generators, more that 1000 kg of hazardous waste/month (Resource Conservation and Recovery Act (tracking hazardous waste)) Organizations: NYC DEPT OF ENVIRONMENTAL PROTECTION (LEGALLY RESPONSIBLE PARTY)
Alternative names: CROTON LAKE GATE HOUSE, NYCDEP CROTON GATEHOUSE LAB
CROMPOND SCHOOL ( in YORKTOWN HEIGHTS, NY)
(National Center for Education Statistics) - STATE ID-662402060004 Organizations: YORKTOWN CSD (SCHOOL DISTRICT)
BENJAMIN FRANKLIN ES ( in YORKTOWN HEIGHTS, NY)
(National Center for Education Statistics) - STATE ID-662401060009 Organizations: LAKELAND CSD (SCHOOL DISTRICT)
HOME OWNERS ASBESTOS REMOVAL (858 HERITAGE CT in YORKTOWN HEIGHTS, NY)
(Integrated Compliance Information System) - ICIS-02-1997-0136, FORMAL ENFORCEMENT ACTION Business SIC classification: SPECIAL TRADE CONTRACTORS
BENJAMIN FRANKLIN ELEMENTARY SCHOOL (3477 KAMHI DRIVE in YORKTOWN HEIGHTS, NY)
HAZARDOUS WASTE BIENNIAL REPORTER (Resource Conservation and Recovery Act (tracking hazardous waste)) (Resource Conservation and Recovery Act (tracking hazardous waste)) Alternative names: LAKELAND CENTRAL SCHOOL DIST
CON ED - V 7 (NEW COMPOUND RD & STONEY ST in YORKTOWN, NY)
HAZARDOUS WASTE BIENNIAL REPORTER (Resource Conservation and Recovery Act (tracking hazardous waste)) (Resource Conservation and Recovery Act (tracking hazardous waste))
ALL COUNTY MEDICAL REMOVAL INC 3A-734 (768 DELANO RD in YORKTOWN HEIGHTS, NY)
TRANSPORTER (Resource Conservation and Recovery Act (tracking hazardous waste)) Organizations: NICHOLAS CAPANO JR (CONTACT/OPERATOR)
A CLEAN AMERICA LTD (11-3 WOODSBROOKE LANE in YORKTOWN HEIGHTS, NY)
TRANSPORTER (Resource Conservation and Recovery Act (tracking hazardous waste))
ALGONQUIN GAS TRANSMISSION CO - VALVE 15 (LEXINGTON AVE & RTE 22 in YORKTOWN HEIGHTS, NY)
Small Quantity Generators, between 100 kg and 1000 kg of hazardous waste/month (Resource Conservation and Recovery Act (tracking hazardous waste)) - notification Organizations: ALGONQUIN GAS TRANSMISSION COMPANY (CONTACT/OWNER)
ALGONQUIN GAS TRANSMISSION CO - VALVE 16 (GOMER ST & ANDREA DR in YORKTOWN HEIGHTS, NY)
Small Quantity Generators, between 100 kg and 1000 kg of hazardous waste/month (Resource Conservation and Recovery Act (tracking hazardous waste)) - notification Organizations: ALGONQUIN GAS TRANSMISSION COMPANY (CONTACT/OWNER)
GRIES DYNACAST CO (1401 FRONT ST in YORKTOWN HEIGHTS, NY)
Small Quantity Generators, between 100 kg and 1000 kg of hazardous waste/month (Resource Conservation and Recovery Act (tracking hazardous waste)) - notification Organizations: COATS & CLARK INC (CONTACT/OWNER)
BILLYS AUTO BODY (3330 OLD CROMPOND RD in YORKTOWN HEIGHTS, NY)
Small Quantity Generators, between 100 kg and 1000 kg of hazardous waste/month (Resource Conservation and Recovery Act (tracking hazardous waste)) - notification Organizations: BILLY KASPER (CONTACT/OWNER)
Housing units lacking complete plumbing facilities: 0.6% Housing units lacking complete kitchen facilities: 2.2%
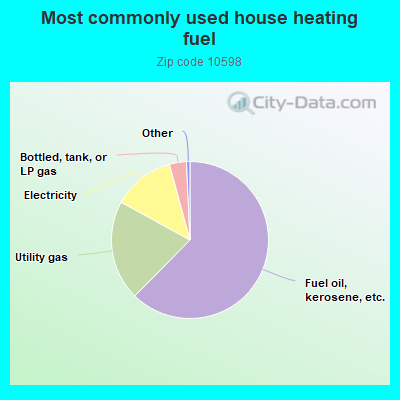
62.4%Fuel oil, kerosene, etc.
20.6%Utility gas
12.8%Electricity
3.5%Bottled, tank, or LP gas
Population in 1990: 28,501. Population change in the 1990s: +867 (+3.0%).
Place of birth for U.S.-born residents:
This state: 21,749
Northeast: 1,202
Midwest: 323
South: 492
West: 356
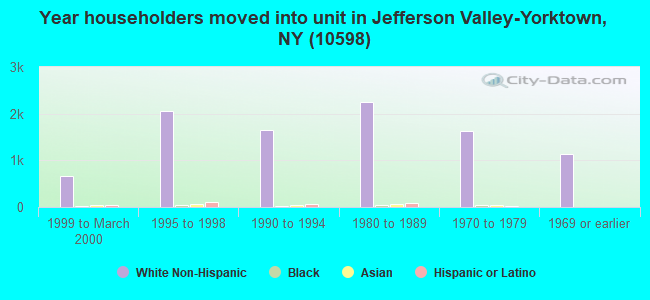
73% of the 10598 zip code residents lived in the same house 5 years ago. Out of people who lived in different houses, 64% lived in this county. Out of people who lived in different counties, 50% lived in New York.
96% of the 10598 zip code residents lived in the same house 1 year ago. Out of people who lived in different houses, 67% moved from this county. Out of people who lived in different houses, 11% moved from different county within same state. Out of people who lived in different houses, 14% moved from different state. Out of people who lived in different houses, 6% moved from abroad.
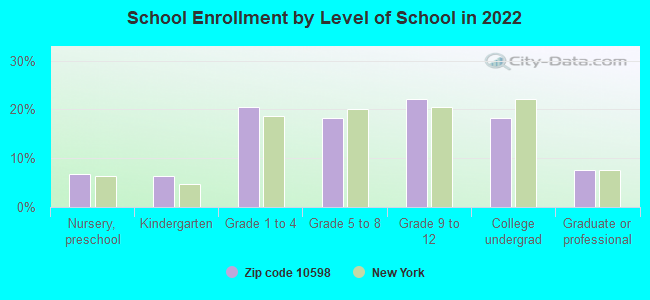
Private vs. public school enrollment:
Students in private schools in grades 1 to 8 (elementary and middle school): 102
Here:
3.8%
New York:
15.6%
Students in private schools in grades 9 to 12 (high school): 182
Here:
11.8%
New York:
15.0%
Students in private undergraduate colleges: 531
Here:
41.6%
New York:
39.2%
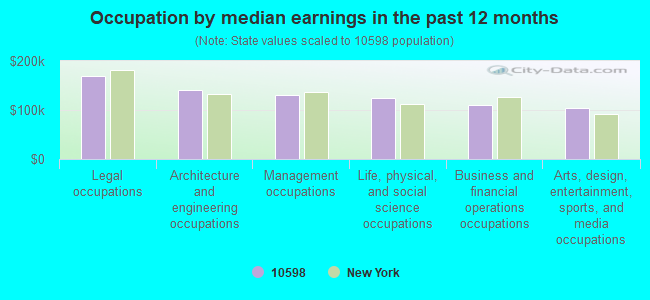
Occupation by median earnings in the past 12 months ($)
169,835Legal occupations
141,365Architecture and engineering occupations
130,582Management occupations
124,951Life, physical, and social science occupations
109,678Business and financial operations occupations
104,854Arts, design, entertainment, sports, and media occupations
Companies with federal contracts located in this zip code (YORKTOWN HEIGH, NY):
QUTRONICS, INC (1725 FRONT ST; small business)
$70,000 with Army for Defense Missile and Space Systems -- Advanced Development (R&D). Signed on 2002-05-06. Completion date: 2002-11-15.
DAVIT SALES INC (2516 DUNNING DR; small business)
$63,273 with Navy for Maintenance, Repair and Rebuilding of Equipment -- Special Industry Machinery. Signed on 2005-08-26. Completion date: 2005-11-22.
MILLS, SHEILA A (1329 ETHAN CT) : $7,000 in 2 contractsin 2005
$3,500 with U.S. Army Corps of Engineers - civil program financing only for Other Professional Services. Taking place in MI. Signed on 2005-08-29. Completion date: 2005-08-09.
$3,500 with Army for Other Professional Services. Taking place in MI. Signed on 2005-08-29. Completion date: 2005-08-09.
SIGNS INK LTD (3255 CROMPOND RD; small business)
$5,750 with Army for Signs, Advertising Displays, and Identification Plates. Signed on 2005-09-29. Completion date: 2005-11-09.
Top industries in this zip code by the number of employees in 2005:
Professional, Scientific, and Technical Services: Research and Development in the Physical, Engineering, and Life Sciences (over 1000 employees: 1 establishment)
Administrative and Support and Waste Management and Remediation Services: Temporary Help Services (250-499: 1, 50-99: 2, 20-49: 1, 1-4: 1)
Finance and Insurance: Direct Health and Medical Insurance Carriers (250-499: 1)
Health Care and Social Assistance: Offices of Physicians (except Mental Health Specialists) (20-49: 3, 10-19: 9, 5-9: 12, 1-4: 19)
2002 - 2018 National Fire Incident Reporting System (NFIRS) incidents
According to the data from the years 2002 - 2018 the average number of fires per year is 48. The highest number of reported fire incidents - 96 took place in 2007, and the least - 13 in 2002. The data has a growing trend.
When looking into fire subcategories, the most incidents belonged to: Structure Fires (52.6%), and Outside Fires (25.7%).
Fire incident types reported to NFIRS in Zip Code 10598
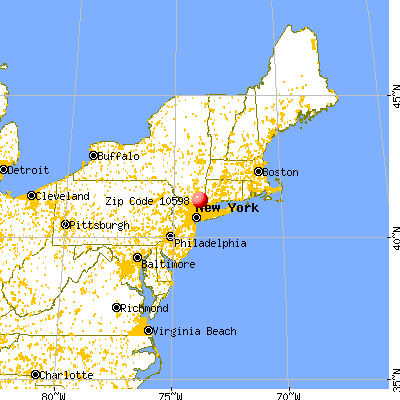


 Nearest zip codes: 10501, 10527, 10535, 10588, 10547, 10517.
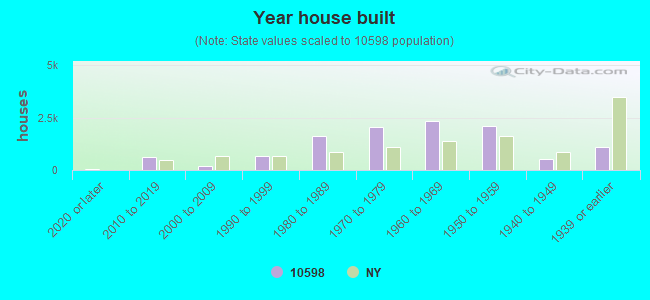


 According to the data from the years 2002 - 2018 the average number of fires per year is 48. The highest number of reported fire incidents - 96 took place in 2007, and the least - 13 in 2002. The data has a growing trend.
 When looking into fire subcategories, the most incidents belonged to: Structure Fires (52.6%), and Outside Fires (25.7%).