Estimated zip code population in 2022: 13,996 Zip code population in 2010: 15,093 Zip code population in 2000: 14,687
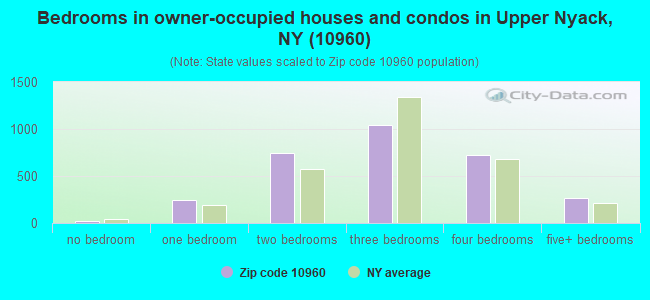
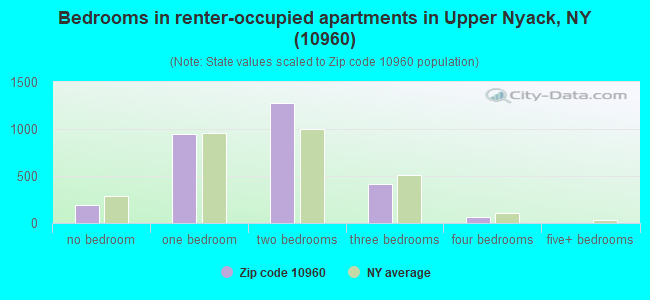
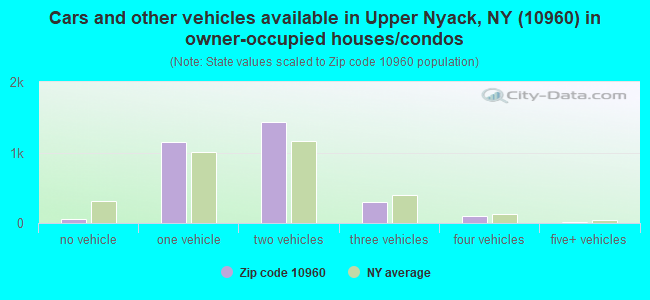
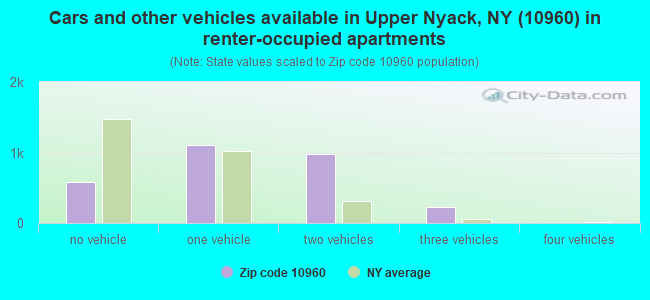
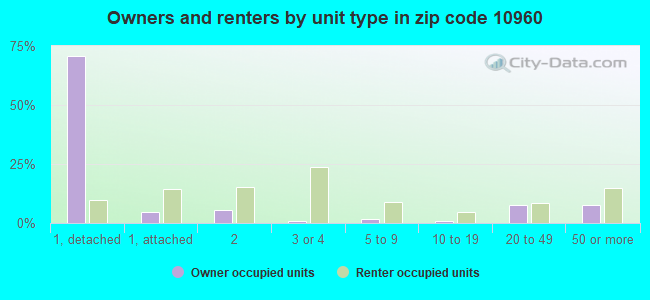
Houses and condos: 6,394 Renter-occupied apartments: 2,907
% of renters here:
49%
State:
46%
March 2022 cost of living index in zip code 10960: 137.9 (high, U.S. average is 100)
Land area: 4.2 sq. mi. Water area: 0.0 sq. mi.
Population density: 3,337 people per square mile
(average).
OSM Map
General Map
Google Map
MSN Map
OSM Map
General Map
Google Map
MSN Map
OSM Map
General Map
Google Map
MSN Map
OSM Map
General Map
Google Map
MSN Map
Please wait while loading the map...
Real estate property taxes paid for housing units in 2022:
This zip code:
1.5% ($9,805)
New York:
1.5% ($6,180)
Median real estate property taxes paid for housing units with mortgages in 2022: $9,858 (1.5%) Median real estate property taxes paid for housing units with no mortgage in 2022: $9,755 (1.4%)
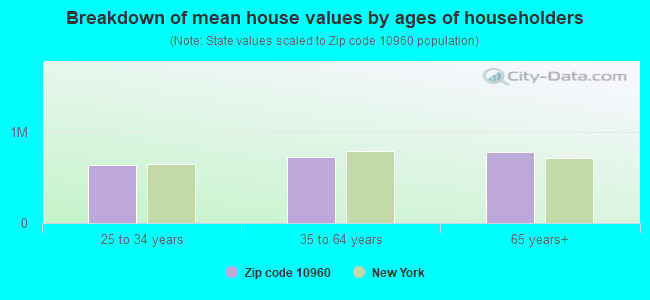
Estimated median house/condo value in 2022: $658,820
10960:
$658,820
New York:
$400,400
According to our research of New York and other state lists, there were 2 registered sex offenders living in 10960 zip code as of April 27, 2024. The ratio of all residents to sex offenders in zip code 10960 is 7,789 to 1. The ratio of registered sex offenders to all residents in this zip code is much lower than the state average.
Median resident age:
This zip code:
44.7 years
New York median age:
40.0 years
Average household size:
This zip code:
2.2 people
New York:
2.5 people
Averages for the 2020 tax year for zip code 10960, filed in 2021:
Average Adjusted Gross Income (AGI) in 2020: $138,170 (Individual Income Tax Returns)
Here:
$138,170
State:
$90,930
Salary/wage: $106,692 (reported on 79.3% of returns)
Here:
$106,692
State:
$72,104
(% of AGI for various income ranges: 1206.2% for AGIs below $25k, 3617.9% for AGIs $25k-50k, 6801.7% for AGIs $50k-75k, 10135.9% for AGIs $75k-100k, 19233.0% for AGIs $100k-200k, 174674.8% for AGIs over 200k)
Taxable interest for individuals: $1,678 (reported on 39.3% of returns)
This zip code:
$1,678
New York:
$3,075
(% of AGI for various income ranges: 16.1% for AGIs below $25k, 25.1% for AGIs $25k-50k, 64.6% for AGIs $50k-75k, 75.2% for AGIs $75k-100k, 157.2% for AGIs $100k-200k, 1280.5% for AGIs over 200k)
Ordinary dividends: $12,775 (reported on 30.9% of returns)
Here:
$12,775
State:
$11,095
(% of AGI for various income ranges: 55.0% for AGIs below $25k, 82.0% for AGIs $25k-50k, 225.1% for AGIs $50k-75k, 303.0% for AGIs $75k-100k, 658.0% for AGIs $100k-200k, 10130.0% for AGIs over 200k)
Net capital gain/loss in AGI: +$36,388 (reported on 28.3% of returns)
Here:
+$36,388
State:
+$44,925
(% of AGI for various income ranges: 38.2% for AGIs below $25k, 49.8% for AGIs $25k-50k, 145.4% for AGIs $50k-75k, 172.0% for AGIs $75k-100k, 770.0% for AGIs $100k-200k, 34068.1% for AGIs over 200k)
Profit/loss from business: +$24,482 (reported on 21.1% of returns)
Here:
+$24,482
State:
+$14,940
(% of AGI for various income ranges: 194.4% for AGIs below $25k, 281.8% for AGIs $25k-50k, 424.3% for AGIs $50k-75k, 317.7% for AGIs $75k-100k, 998.4% for AGIs $100k-200k, 10890.0% for AGIs over 200k)
Taxable individual retirement arrangement distribution: $23,910 (reported on 10.6% of returns)
10960:
$23,910
New York:
$19,609
(% of AGI for various income ranges: 52.8% for AGIs below $25k, 110.1% for AGIs $25k-50k, 224.0% for AGIs $50k-75k, 572.3% for AGIs $75k-100k, 917.4% for AGIs $100k-200k, 3255.2% for AGIs over 200k)
Self-employed (Keogh) retirement plans: $28,262 (reported on 2.1% of returns)
10960:
$28,262
New York:
$32,497
(% of AGI for various income ranges: 39.5% for AGIs $25k-50k, 135.7% for AGIs $100k-200k, 1466.2% for AGIs over 200k)
Total itemized deductions: $33,211 (reported on 18.0% of returns)
Here:
$33,211
State:
$39,326
(% of AGI for various income ranges: 155.2% for AGIs below $25k, 221.4% for AGIs $25k-50k, 510.7% for AGIs $50k-75k, 784.8% for AGIs $75k-100k, 1784.3% for AGIs $100k-200k, 10408.6% for AGIs over 200k)
Charity contributions: $9,216 (reported on 15.7% of returns)
Here:
$9,216
State:
$15,420
(% of AGI for various income ranges: 5.6% for AGIs below $25k, 17.0% for AGIs $25k-50k, 58.9% for AGIs $50k-75k, 115.9% for AGIs $75k-100k, 266.8% for AGIs $100k-200k, 3847.1% for AGIs over 200k)
Taxes paid: $9,293 (reported on 18.0% of returns)
10960:
$9,293
State:
$9,183
(% of AGI for various income ranges: 51.0% for AGIs below $25k, 75.8% for AGIs $25k-50k, 195.1% for AGIs $50k-75k, 301.8% for AGIs $75k-100k, 597.4% for AGIs $100k-200k, 2099.0% for AGIs over 200k)
Earned income credit: $1,812 (reported on 10.0% of returns)
Here:
$1,812
State:
$2,138
(% of AGI for various income ranges: 72.4% for AGIs below $25k, 49.7% for AGIs $25k-50k)
Percentage of individuals using paid preparers for their 2020 taxes: 94.0%
Here:
94%
State:
95%
(% for various income ranges: 91.5% for AGIs below $25k, 94.1% for AGIs $25k-50k, 94.6% for AGIs $50k-75k, 93.3% for AGIs $75k-100k, 95.2% for AGIs $100k-200k, 96.7% for AGIs over 200k)
Averages for the 2012 tax year for zip code 10960, filed in 2013:
Average Adjusted Gross Income (AGI) in 2012: $96,203 (Individual Income Tax Returns)
Here:
$96,203
State:
$77,088
Salary/wage: $76,920 (reported on 80.8% of returns)
Here:
$76,920
State:
$60,593
(% of AGI for various income ranges: 71.6% for AGIs below $25k, 75.9% for AGIs $25k-50k, 74.4% for AGIs $50k-75k, 73.9% for AGIs $75k-100k, 71.4% for AGIs $100k-200k, 55.5% for AGIs over 200k)
Taxable interest for individuals: $2,066 (reported on 42.2% of returns)
This zip code:
$2,066
New York:
$3,125
(% of AGI for various income ranges: 1.4% for AGIs below $25k, 0.9% for AGIs $25k-50k, 0.9% for AGIs $50k-75k, 0.7% for AGIs $75k-100k, 0.9% for AGIs $100k-200k, 0.9% for AGIs over 200k)
Ordinary dividends: $8,185 (reported on 29.6% of returns)
Here:
$8,185
State:
$10,299
(% of AGI for various income ranges: 3.3% for AGIs below $25k, 2.1% for AGIs $25k-50k, 2.1% for AGIs $50k-75k, 1.9% for AGIs $75k-100k, 2.4% for AGIs $100k-200k, 2.8% for AGIs over 200k)
Net capital gain/loss in AGI: +$21,671 (reported on 25.6% of returns)
Here:
+$21,671
State:
+$42,474
(% of AGI for various income ranges: 0.4% for AGIs $75k-100k, 1.2% for AGIs $100k-200k, 11.4% for AGIs over 200k)
Profit/loss from business: +$25,094 (reported on 19.7% of returns)
Here:
+$25,094
State:
+$16,168
(% of AGI for various income ranges: 12.7% for AGIs below $25k, 6.8% for AGIs $25k-50k, 4.1% for AGIs $50k-75k, 2.9% for AGIs $75k-100k, 4.8% for AGIs $100k-200k, 5.0% for AGIs over 200k)
Taxable individual retirement arrangement distribution: $22,278 (reported on 11.5% of returns)
10960:
$22,278
New York:
$17,621
(% of AGI for various income ranges: 2.8% for AGIs below $25k, 2.5% for AGIs $25k-50k, 3.2% for AGIs $50k-75k, 3.4% for AGIs $75k-100k, 3.4% for AGIs $100k-200k, 2.1% for AGIs over 200k)
Self-employment retirement plans: $20,833 (reported on 2.3% of returns)
10960:
$20,833
New York:
$27,330
(% of AGI for various income ranges: 0.6% for AGIs $50k-75k, 0.5% for AGIs $100k-200k, 0.7% for AGIs over 200k)
Total itemized deductions: $39,878 (23% of AGI, reported on 45.9% of returns)
Here:
$39,878
State:
$34,985
Here:
23.2% of AGI
State:
21.3% of AGI
(% of AGI for various income ranges: 17.6% for AGIs below $25k, 16.9% for AGIs $25k-50k, 17.9% for AGIs $50k-75k, 20.3% for AGIs $75k-100k, 21.9% for AGIs $100k-200k, 18.0% for AGIs over 200k)
Charity contributions: $4,109 (reported on 40.0% of returns)
Here:
$4,109
State:
$5,572
(% of AGI for various income ranges: 0.7% for AGIs below $25k, 1.3% for AGIs $25k-50k, 1.6% for AGIs $50k-75k, 1.7% for AGIs $75k-100k, 1.7% for AGIs $100k-200k, 1.9% for AGIs over 200k)
Taxes paid: $22,377 (reported on 45.8% of returns)
10960:
$22,377
State:
$18,656
(% of AGI for various income ranges: 6.9% for AGIs below $25k, 6.9% for AGIs $25k-50k, 7.6% for AGIs $50k-75k, 9.9% for AGIs $75k-100k, 11.7% for AGIs $100k-200k, 11.7% for AGIs over 200k)
Earned income credit: $2,000 (reported on 12.3% of returns)
Here:
$2,000
State:
$2,230
(% of AGI for various income ranges: 5.0% for AGIs below $25k, 0.7% for AGIs $25k-50k)
Percentage of individuals using paid preparers for their 2012 taxes: 69.8%
Here:
70%
State:
66%
(% for various income ranges: 63.6% for AGIs below $25k, 64.4% for AGIs $25k-50k, 72.8% for AGIs $50k-75k, 73.7% for AGIs $75k-100k, 75.0% for AGIs $100k-200k, 86.2% for AGIs over 200k)
Averages for the 2004 tax year for zip code 10960, filed in 2005:
Average Adjusted Gross Income (AGI) in 2004: $72,912 (Individual Income Tax Returns)
Here:
$72,912
State:
$59,519
Salary/wage: $64,631 (reported on 81.0% of returns)
Here:
$64,631
State:
$50,673
(% of AGI for various income ranges: 73.7% for AGIs $10k-25k, 81.6% for AGIs $25k-50k, 78.6% for AGIs $50k-75k, 76.4% for AGIs $75k-100k, 66.1% for AGIs over 100k)
Taxable interest for individuals: $1,958 (reported on 56.6% of returns)
This zip code:
$1,958
New York:
$2,377
(% of AGI for various income ranges: 3.1% for AGIs $10k-25k, 1.3% for AGIs $25k-50k, 1.4% for AGIs $50k-75k, 1.2% for AGIs $75k-100k, 1.4% for AGIs over 100k)
Taxable dividends: $4,450 (reported on 35.2% of returns)
Here:
$4,450
State:
$5,394
(% of AGI for various income ranges: 2.2% for AGIs $10k-25k, 1.7% for AGIs $25k-50k, 2.1% for AGIs $50k-75k, 1.9% for AGIs $75k-100k, 2.1% for AGIs over 100k)
Net capital gain/loss: +$12,736 (reported on 29.8% of returns)
Here:
+$12,736
State:
+$23,581
(% of AGI for various income ranges: -0.1% for AGIs $10k-25k, -0.3% for AGIs $25k-50k, 1.1% for AGIs $50k-75k, 1.7% for AGIs $75k-100k, 7.9% for AGIs over 100k)
Profit/loss from business: +$21,814 (reported on 19.4% of returns)
Here:
+$21,814
State:
+$13,809
(% of AGI for various income ranges: 8.1% for AGIs $10k-25k, 5.2% for AGIs $25k-50k, 4.7% for AGIs $50k-75k, 3.3% for AGIs $75k-100k, 6.1% for AGIs over 100k)
IRA payment deduction: $3,263 (reported on 2.8% of returns)
10960:
$3,263
New York:
$3,115
(% of AGI for various income ranges: 0.3% for AGIs $10k-25k, 0.2% for AGIs $25k-50k, 0.2% for AGIs $50k-75k, 0.1% for AGIs $75k-100k, 0.1% for AGIs over 100k)
Self-employed pension: $17,801 (reported on 2.7% of returns)
Here:
$17,801
New York:
$19,016
(% of AGI for various income ranges: 0.3% for AGIs $25k-50k, 0.3% for AGIs $50k-75k, 0.2% for AGIs $75k-100k, 0.9% for AGIs over 100k)
Total itemized deductions: $28,453 (22% of AGI, reported on 46.9% of returns)
Here:
$28,453
State:
$25,864
Here:
22.4% of AGI
State:
21.9% of AGI
(% of AGI for various income ranges: 15.9% for AGIs $10k-25k, 17.1% for AGIs $25k-50k, 19.8% for AGIs $50k-75k, 22.7% for AGIs $75k-100k, 17.3% for AGIs over 100k)
Charity contributions deductions: $3,504 (3% of AGI, reported on 43.7% of returns)
Here:
$3,504
State:
$4,439
Here:
2.7% of AGI
State:
3.6% of AGI
(% of AGI for various income ranges: 1.4% for AGIs $10k-25k, 2.1% for AGIs $25k-50k, 2.5% for AGIs $50k-75k, 2.7% for AGIs $75k-100k, 2.0% for AGIs over 100k)
Total tax: $15,144 (reported on 79.9% of returns)
10960:
$15,144
State:
$11,730
(% of AGI for various income ranges: 4.7% for AGIs $10k-25k, 8.2% for AGIs $25k-50k, 11.1% for AGIs $50k-75k, 11.5% for AGIs $75k-100k, 20.8% for AGIs over 100k)
Earned income credit: $1,408 (reported on 9.5% of returns)
Here:
$1,408
State:
$1,757
Percentage of individuals using paid preparers for their 2004 taxes: 73.5%
Here:
73%
State:
67%
(% for various income ranges: 66.6% for AGIs below $10k, 76.8% for AGIs $10k-25k, 70.0% for AGIs $25k-50k, 72.7% for AGIs $50k-75k, 74.2% for AGIs $75k-100k, 81.5% for AGIs over 100k)
Likely homosexual households (counted as self-reported same-sex unmarried-partner households)
Lesbian couples: 1.3% of all households
Gay men: 0.0% of all households
Household received Food Stamps/SNAP in the past 12 months: 589 Household did not receive Food Stamps/SNAP in the past 12 months: 5,318
Women who had a birth in the past 12 months: 110 (80 now married, 29 unmarried) Women who did not have a birth in the past 12 months: 2,829 (847 now married, 1,991 unmarried)
Housing units in zip code 10960 with a mortgage: 1,745 (212 second mortgage, 5 home equity loan, 158 both second mortgage and home equity loan) Houses without a mortgage: 182
Median monthly owner costs for units with a mortgage: $3,610 Median monthly owner costs for units without a mortgage: $1,487
Residents with income below the poverty level in 2022:
This zip code:
4.2%
Whole state:
14.3%
Residents with income below 50% of the poverty level in 2022:
This zip code:
2.3%
Whole state:
6.8%
Median number of rooms in houses and condos:
Here:
6.2
State:
6.3
Median number of rooms in apartments:
Here:
4.1
State:
3.8
Notable locations in this zip code not listed on our city pages
Notable locations in zip code 10960: Marydell Camp (A), Nyack Boat Club (B), Bethel House (C), Bethany House (D), Mazeppa Engine Company 2 (E), Rockland Theatre (F), Bailey Library (G), Dunbar Hall (H), Harmony Hall (I), Jaffrey Hall (J), Moseley Hall (K), Pardington Hall (L), Shuman Hall (M), Simpson Hall (N), Nyack Village Hall (O), South Nyack Village Hall (P), Upper Nyack Village Hall (Q), Orangetown Fire Company (R), Nyack Public Library (S), Christie Hall (T). Display/hide their locations on the map
Churches in zip code 10960 include: Temple Israel (A), Simpson Memorial Church of the Christian Missionary Alliance (B), Saint Phillips African Methodist Episcopal Zion Church (C), Saint Paul's United Methodist Church (D), Saint Paul's Evangelical Lutheran Church (E), Saint Ann's Roman Catholic Church (F), Pilgrim Baptist Church (G), First Baptist Church (H), First Church of Christ Scientist (I). Display/hide their locations on the map
Parks in zip code 10960 include: Memorial Park (1), Mountainview Nature Park (2), Schuyler Town Park (3), Aldine Park (4). Display/hide their locations on the map
In group quarters: 767 (-1 institutionalized population)
Size of family households: 1,614 2-persons, 666 3-persons, 694 4-persons, 119 5-persons, 91 6-persons, 46 7-or-more-persons
Size of nonfamily households: 1,945 1-person, 819 2-persons, 10 4-persons
1,161 married couples with children.
553 single-parent households (22 men, 531 women).
73.6% of residents of 10960 zip code speak English at home.
10.9% of residents speak Spanish at home (69% very well, 18% well, 12% not well, 1% not at all).
10.4% of residents speak other Indo-European language at home (78% very well, 15% well, 6% not well, 1% not at all).
3.4% of residents speak Asian or Pacific Island language at home (22% very well, 68% well, 6% not well, 4% not at all).
1.4% of residents speak other language at home (81% very well, 15% well, 4% not at all).
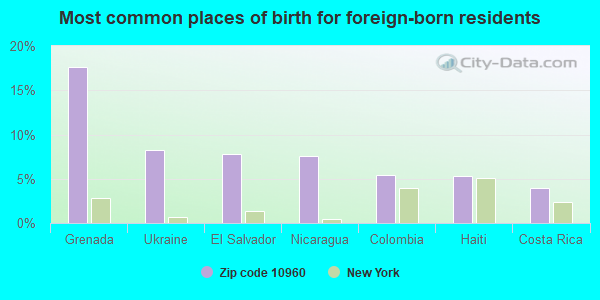
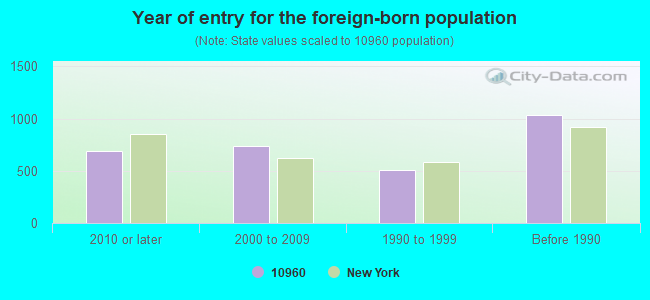
Foreign born population: 2,697 (19.3%) (63.3% of them are naturalized citizens)
Facilities with environmental interests located in this zip code:
ALL PHASE AUTOMOTIVE (30-34 NEW ST in NYACK, NY)
STATE MASTER (New York facility tracking) - AIR PROGRAM Conditionally Exempt Small Quantity Generators, less than 100 kg/month of hazardous waste (Resource Conservation and Recovery Act (tracking hazardous waste)) - notification Business SIC classification: TOP, BODY, AND UPHOLSTERY REPAIR SHOPS AND PAINT SHOPS Business NAICS classification: AUTOMOTIVE BODY, PAINT, AND INTERIOR REPAIR AND MAINTENANCE. Organizations: DRAKE II (CONTACT/OWNER)
Alternative names: ALL PHASE AUTOMOTIVE LLC
IMPERIAL COLLISION (64 CATHERINE ST in NYACK, NY)
STATE MASTER (New York facility tracking) - AIR PROGRAM, Conditionally Exempt Small Quantity Generators, less than 100 kg/month of hazardous waste (Resource Conservation and Recovery Act (tracking hazardous waste)) - notification Business SIC classification: TOP, BODY, AND UPHOLSTERY REPAIR SHOPS AND PAINT SHOPS Business NAICS classification: AUTOMOTIVE BODY, PAINT, AND INTERIOR REPAIR AND MAINTENANCE. Organizations: IMPERIAL COLLISION INC (AIR PERMITTING FACILITY OWNER CONTACT)
, FRANK KEENE - FMK REALITY INC (CONTACT/OWNER)
GROUP HOME 5 ( in SOUTH NYACK, NY)
(National Center for Education Statistics) - STATE ID-500304890047 Organizations: NYACK UFSD (SCHOOL DISTRICT)
111 LARCHDALE AVE ( in UPPER NYACK, NY)
National Pollutant Discharge Elimination System NON-MAJOR (Tracking pollutant discharge elimination systems) - permit Organizations: VICTORIA BADI (CONTACT/OWNER)
Alternative names: VICTORIA BADI SUBDIVISION
HAND BATTERY LAB SITE (122 SOUTH FRANKLIN STREET in SOUTH NYACK, NY)
(Resource Conservation and Recovery Act (tracking hazardous waste)) Alternative names: HAND BATTERY SITE
Conditionally Exempt Small Quantity Generators, less than 100 kg/month of hazardous waste (Resource Conservation and Recovery Act (tracking hazardous waste)) Organizations: HUDSON AVENUE ASSCOCIATES (CONTACT/OWNER)
Alternative names: LAWLER MATUSKY & SKELLY ENGINEERS
COUNTY TOYOTA (115 E RTE 59 in NYACK, NY)
(Resource Conservation and Recovery Act (tracking hazardous waste))
CLERMONT CONDOMINIUM FACILITY PHASE 3 (GEDNEY & MAIN ST in NYACK, NY)
(Resource Conservation and Recovery Act (tracking hazardous waste))
CLINTON SQUARE PLAZA INC (RTE 303 & 59 in NYACK, NY)
(Resource Conservation and Recovery Act (tracking hazardous waste))
GETTY SERVICE STATION (316 MAIN ST in NYACK, NY)
Conditionally Exempt Small Quantity Generators, less than 100 kg/month of hazardous waste (Resource Conservation and Recovery Act (tracking hazardous waste)) - notification Organizations: GETTY PETROLEUM CORP (CONTACT/OWNER)
CLASSIC ROCKLAND CAR REPAIR (33B RTE 59 in NYACK, NY)
Conditionally Exempt Small Quantity Generators, less than 100 kg/month of hazardous waste (Resource Conservation and Recovery Act (tracking hazardous waste)) - notification Organizations: MIKE PIAZZA REAL ESTATE (CONTACT/OWNER)
Housing units lacking complete plumbing facilities: 0.6% Housing units lacking complete kitchen facilities: 2.4%
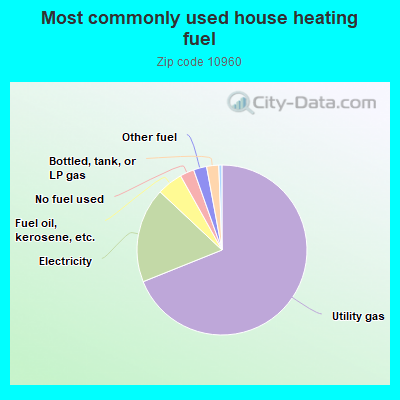
69.0%Utility gas
18.1%Electricity
4.9%Fuel oil, kerosene, etc.
2.7%No fuel used
2.5%Other fuel
2.3%Bottled, tank, or LP gas
Population in 1990: 14,542. Population change in the 1990s: +145 (+1.0%).
Place of birth for U.S.-born residents:
This state: 7,535
Northeast: 1,619
Midwest: 425
South: 851
West: 588
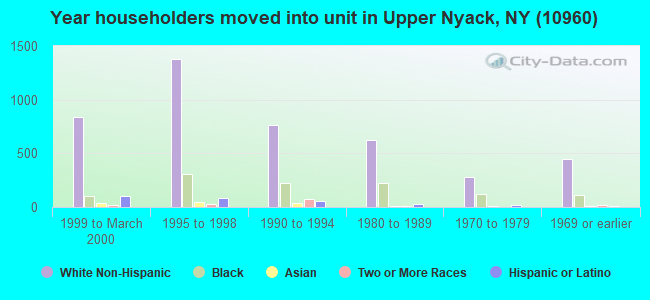
56% of the 10960 zip code residents lived in the same house 5 years ago. Out of people who lived in different houses, 51% lived in this county. Out of people who lived in different counties, 50% lived in New York.
84% of the 10960 zip code residents lived in the same house 1 year ago. Out of people who lived in different houses, 32% moved from this county. Out of people who lived in different houses, 36% moved from different county within same state. Out of people who lived in different houses, 31% moved from different state. Out of people who lived in different houses, 4% moved from abroad.
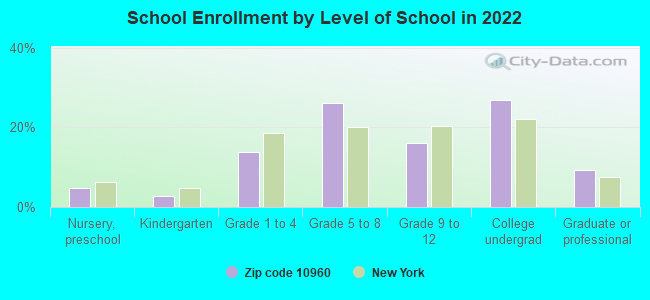
Private vs. public school enrollment:
Students in private schools in grades 1 to 8 (elementary and middle school): 229
Here:
18.6%
New York:
15.6%
Students in private schools in grades 9 to 12 (high school): 92
Here:
18.7%
New York:
15.0%
Students in private undergraduate colleges: 514
Here:
60.8%
New York:
39.2%
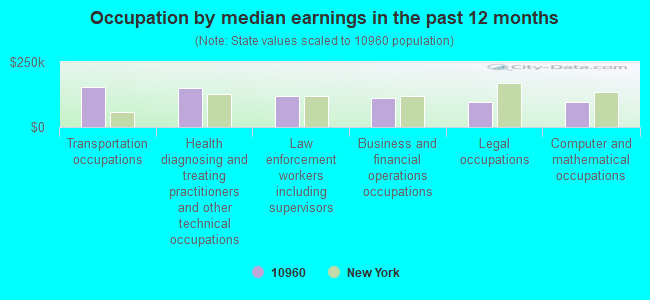
Occupation by median earnings in the past 12 months ($)
154,129Transportation occupations
148,588Health diagnosing and treating practitioners and other technical occupations
119,334Law enforcement workers including supervisors
109,709Business and financial operations occupations
96,327Legal occupations
94,688Computer and mathematical occupations
Companies with federal contracts located in this zip code (NYACK, NY):
BERRY INDUSTRIAL GROUP INC (30 MAIN ST; small business) : $408,697 in 62 contractsfrom 2003 to 2006
Contracts for Miscellaneous Materials Handling Equipment, Lumber and Related Basic Wood Materials by Navy, Army, Defense Logistics Agency, Bureau of Prisoners/Federal Prison System, and others Signed by year:2000: $0; 2001: $0; 2002: $0; 2003: $92,000; 2004: $98,500; 2005: $190,217; 2006: $27,980.
Biggest contracts:
$37,688 with Navy for Miscellaneous Materials Handling Equipment. Signed on 2005-06-22. Completion date: 2005-07-15.
$33,500, same as above.Signed on 2005-04-06. Completion date: 2005-04-15.
$30,500 with Army for Miscellaneous Materials Handling Equipment. Signed on 2004-04-15. Completion date: 2004-08-02.
$20,938 with Navy for Miscellaneous Materials Handling Equipment. Signed on 2005-06-15. Completion date: 2005-06-06.
BUSINESS DYNAMICS CONSULTING, INC. (96 SOUTH BROADWAY)
$286,650 with Offices, Boards and Divisions (includes Attorney General, Deputy Attorney General, etc.) for Expert Witness. Taking place in DC. Signed on 2005-09-30. Completion date: 2006-10-30.
ADDO ENTERPRISES (312 S BROADWAY; small business) : $0 in 2 contractsin 2005
$9,808 with Army for Electronic Countermeasures, Counter-Countermeasures and Quick Reaction Capability Equipment. Signed on 2005-09-13. Completion date: 2005-10-13.
-$9,808, same as above.Signed on 2005-09-20. Completion date: 2005-10-13.
TRI-COUNTY POLICE SUPPLY CO , (76 S FRANKLIN ST # 78; small business) : $0 in 2 contractsin 2004
$10,208 with Navy for Armor, Personal. Signed on 2004-09-25. Completion date: 2004-11-08.
-$10,208, same as above.Signed on 2004-09-29. Completion date: 2004-11-08.
Top industries in this zip code by the number of employees in 2005:
Educational Services: Colleges, Universities, and Professional Schools (over 1000 employees: 1 establishment)
Health Care and Social Assistance: General Medical and Surgical Hospitals (over 1000: 1)
2002 - 2018 National Fire Incident Reporting System (NFIRS) incidents
Based on the data from the years 2002 - 2018 the average number of fires per year is 19. The highest number of fire incidents - 84 took place in 2002, and the least - 3 in 2007. The data has a declining trend.
When looking into fire subcategories, the most reports belonged to: Structure Fires (59.6%), and Outside Fires (18.5%).
Fire incident types reported to NFIRS in Zip Code 10960


 Nearest zip codes: 10989, 10913, 10994, 10962, 10968, 10983.


 Based on the data from the years 2002 - 2018 the average number of fires per year is 19. The highest number of fire incidents - 84 took place in 2002, and the least - 3 in 2007. The data has a declining trend.
 When looking into fire subcategories, the most reports belonged to: Structure Fires (59.6%), and Outside Fires (18.5%).