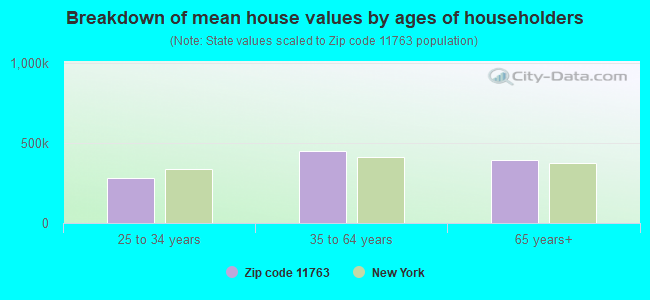
Estimated zip code population in 2022: 29,292 Zip code population in 2010: 28,506 Zip code population in 2000: 24,743
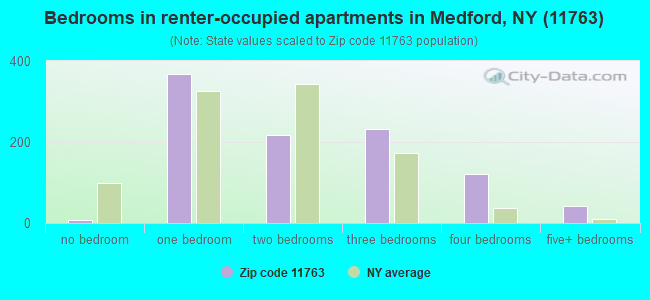
Houses and condos: 9,959 Renter-occupied apartments: 999
% of renters here:
10%
State:
46%
March 2022 cost of living index in zip code 11763: 148.6 (very high, U.S. average is 100)
Land area: 13.8 sq. mi. Water area: 0.0 sq. mi.
Population density: 2,118 people per square mile
(low).
OSM Map
General Map
Google Map
MSN Map
OSM Map
General Map
Google Map
MSN Map
OSM Map
General Map
Google Map
MSN Map
OSM Map
General Map
Google Map
MSN Map
Please wait while loading the map...
Real estate property taxes paid for housing units in 2022:
This zip code:
2.1% ($8,866)
New York:
1.5% ($6,180)
Median real estate property taxes paid for housing units with mortgages in 2022: $9,382 (2.2%) Median real estate property taxes paid for housing units with no mortgage in 2022: $7,397 (1.7%)
Averages for the 2020 tax year for zip code 11763, filed in 2021:
Average Adjusted Gross Income (AGI) in 2020: $67,522 (Individual Income Tax Returns)
Here:
$67,522
State:
$90,930
Salary/wage: $61,707 (reported on 83.0% of returns)
Here:
$61,707
State:
$72,104
(% of AGI for various income ranges: 1202.1% for AGIs below $25k, 3639.2% for AGIs $25k-50k, 6642.7% for AGIs $50k-75k, 9425.0% for AGIs $75k-100k, 16985.6% for AGIs $100k-200k, 55914.2% for AGIs over 200k)
Taxable interest for individuals: $738 (reported on 39.2% of returns)
This zip code:
$738
New York:
$3,075
(% of AGI for various income ranges: 15.2% for AGIs below $25k, 20.0% for AGIs $25k-50k, 28.5% for AGIs $50k-75k, 51.5% for AGIs $75k-100k, 80.3% for AGIs $100k-200k, 412.1% for AGIs over 200k)
Ordinary dividends: $2,795 (reported on 16.4% of returns)
Here:
$2,795
State:
$11,095
(% of AGI for various income ranges: 17.1% for AGIs below $25k, 24.6% for AGIs $25k-50k, 40.3% for AGIs $50k-75k, 77.2% for AGIs $75k-100k, 98.7% for AGIs $100k-200k, 1090.4% for AGIs over 200k)
Net capital gain/loss in AGI: +$5,967 (reported on 14.5% of returns)
Here:
+$5,967
State:
+$44,925
(% of AGI for various income ranges: 4.8% for AGIs below $25k, 17.6% for AGIs $25k-50k, 38.0% for AGIs $50k-75k, 78.3% for AGIs $75k-100k, 229.3% for AGIs $100k-200k, 3062.9% for AGIs over 200k)
Profit/loss from business: +$7,962 (reported on 13.3% of returns)
Here:
+$7,962
State:
+$14,940
(% of AGI for various income ranges: 153.8% for AGIs below $25k, 101.3% for AGIs $25k-50k, 90.0% for AGIs $50k-75k, 119.8% for AGIs $75k-100k, 229.0% for AGIs $100k-200k, 900.8% for AGIs over 200k)
Taxable individual retirement arrangement distribution: $15,080 (reported on 7.6% of returns)
11763:
$15,080
New York:
$19,609
(% of AGI for various income ranges: 40.6% for AGIs below $25k, 73.3% for AGIs $25k-50k, 130.1% for AGIs $50k-75k, 223.0% for AGIs $75k-100k, 390.9% for AGIs $100k-200k, 1165.4% for AGIs over 200k)
Self-employed (Keogh) retirement plans: $12,600 (reported on 0.3% of returns)
11763:
$12,600
New York:
$32,497
(% of AGI for various income ranges: 28.2% for AGIs $100k-200k)
Total itemized deductions: $24,963 (reported on 15.0% of returns)
Here:
$24,963
State:
$39,326
(% of AGI for various income ranges: 93.1% for AGIs below $25k, 219.8% for AGIs $25k-50k, 575.6% for AGIs $50k-75k, 934.2% for AGIs $75k-100k, 1147.4% for AGIs $100k-200k, 3454.6% for AGIs over 200k)
Charity contributions: $3,635 (reported on 12.5% of returns)
Here:
$3,635
State:
$15,420
(% of AGI for various income ranges: 4.8% for AGIs below $25k, 17.6% for AGIs $25k-50k, 52.8% for AGIs $50k-75k, 89.0% for AGIs $75k-100k, 158.2% for AGIs $100k-200k, 694.6% for AGIs over 200k)
Taxes paid: $9,132 (reported on 15.0% of returns)
11763:
$9,132
State:
$9,183
(% of AGI for various income ranges: 31.0% for AGIs below $25k, 81.9% for AGIs $25k-50k, 223.6% for AGIs $50k-75k, 361.2% for AGIs $75k-100k, 434.3% for AGIs $100k-200k, 979.6% for AGIs over 200k)
Earned income credit: $2,040 (reported on 11.3% of returns)
Here:
$2,040
State:
$2,138
(% of AGI for various income ranges: 73.0% for AGIs below $25k, 51.8% for AGIs $25k-50k, 0.6% for AGIs $50k-75k)
Percentage of individuals using paid preparers for their 2020 taxes: 95.3%
Here:
95%
State:
95%
(% for various income ranges: 92.9% for AGIs below $25k, 95.9% for AGIs $25k-50k, 95.9% for AGIs $50k-75k, 95.9% for AGIs $75k-100k, 96.9% for AGIs $100k-200k, 96.9% for AGIs over 200k)
Averages for the 2012 tax year for zip code 11763, filed in 2013:
Average Adjusted Gross Income (AGI) in 2012: $57,340 (Individual Income Tax Returns)
Here:
$57,340
State:
$77,088
Salary/wage: $52,750 (reported on 87.6% of returns)
Here:
$52,750
State:
$60,593
(% of AGI for various income ranges: 78.2% for AGIs below $25k, 83.3% for AGIs $25k-50k, 79.4% for AGIs $50k-75k, 80.7% for AGIs $75k-100k, 83.0% for AGIs $100k-200k, 72.5% for AGIs over 200k)
Taxable interest for individuals: $627 (reported on 40.5% of returns)
This zip code:
$627
New York:
$3,125
(% of AGI for various income ranges: 0.7% for AGIs below $25k, 0.5% for AGIs $25k-50k, 0.4% for AGIs $50k-75k, 0.4% for AGIs $75k-100k, 0.3% for AGIs $100k-200k, 0.7% for AGIs over 200k)
Ordinary dividends: $2,032 (reported on 16.0% of returns)
Here:
$2,032
State:
$10,299
(% of AGI for various income ranges: 0.8% for AGIs below $25k, 0.5% for AGIs $25k-50k, 0.7% for AGIs $50k-75k, 0.4% for AGIs $75k-100k, 0.4% for AGIs $100k-200k, 1.0% for AGIs over 200k)
Net capital gain/loss in AGI: +$2,481 (reported on 11.5% of returns)
Here:
+$2,481
State:
+$42,474
(% of AGI for various income ranges: 0.2% for AGIs $75k-100k, 0.3% for AGIs $100k-200k, 3.1% for AGIs over 200k)
Profit/loss from business: +$8,151 (reported on 11.4% of returns)
Here:
+$8,151
State:
+$16,168
(% of AGI for various income ranges: 6.6% for AGIs below $25k, 1.7% for AGIs $25k-50k, 1.2% for AGIs $50k-75k, 1.1% for AGIs $75k-100k, 1.1% for AGIs $100k-200k, 0.9% for AGIs over 200k)
Taxable individual retirement arrangement distribution: $13,469 (reported on 7.3% of returns)
11763:
$13,469
New York:
$17,621
(% of AGI for various income ranges: 2.1% for AGIs below $25k, 1.8% for AGIs $25k-50k, 1.9% for AGIs $50k-75k, 1.7% for AGIs $75k-100k, 1.4% for AGIs $100k-200k, 1.9% for AGIs over 200k)
Self-employment retirement plans: $10,400 (reported on 0.2% of returns)
11763:
$10,400
New York:
$27,330
Total itemized deductions: $24,765 (26% of AGI, reported on 44.9% of returns)
Here:
$24,765
State:
$34,985
Here:
26.1% of AGI
State:
21.3% of AGI
(% of AGI for various income ranges: 10.5% for AGIs below $25k, 16.2% for AGIs $25k-50k, 20.8% for AGIs $50k-75k, 22.3% for AGIs $75k-100k, 21.5% for AGIs $100k-200k, 16.9% for AGIs over 200k)
Charity contributions: $2,180 (reported on 40.2% of returns)
Here:
$2,180
State:
$5,572
(% of AGI for various income ranges: 0.6% for AGIs below $25k, 1.2% for AGIs $25k-50k, 1.7% for AGIs $50k-75k, 1.7% for AGIs $75k-100k, 1.8% for AGIs $100k-200k, 1.3% for AGIs over 200k)
Taxes paid: $11,529 (reported on 44.8% of returns)
11763:
$11,529
State:
$18,656
(% of AGI for various income ranges: 4.1% for AGIs below $25k, 6.2% for AGIs $25k-50k, 8.8% for AGIs $50k-75k, 10.2% for AGIs $75k-100k, 10.4% for AGIs $100k-200k, 10.0% for AGIs over 200k)
Earned income credit: $2,196 (reported on 16.1% of returns)
Here:
$2,196
State:
$2,230
(% of AGI for various income ranges: 6.2% for AGIs below $25k, 0.8% for AGIs $25k-50k)
Percentage of individuals using paid preparers for their 2012 taxes: 68.0%
Here:
68%
State:
66%
(% for various income ranges: 59.2% for AGIs below $25k, 68.7% for AGIs $25k-50k, 71.9% for AGIs $50k-75k, 75.5% for AGIs $75k-100k, 78.1% for AGIs $100k-200k, 78.8% for AGIs over 200k)
Averages for the 2004 tax year for zip code 11763, filed in 2005:
Average Adjusted Gross Income (AGI) in 2004: $49,367 (Individual Income Tax Returns)
Here:
$49,367
State:
$59,519
Salary/wage: $46,994 (reported on 89.4% of returns)
Here:
$46,994
State:
$50,673
(% of AGI for various income ranges: 99.7% for AGIs below $10k, 78.1% for AGIs $10k-25k, 86.5% for AGIs $25k-50k, 86.0% for AGIs $50k-75k, 88.8% for AGIs $75k-100k, 82.4% for AGIs over 100k)
Taxable interest for individuals: $651 (reported on 57.1% of returns)
This zip code:
$651
New York:
$2,377
(% of AGI for various income ranges: 3.7% for AGIs below $10k, 1.5% for AGIs $10k-25k, 0.8% for AGIs $25k-50k, 0.7% for AGIs $50k-75k, 0.5% for AGIs $75k-100k, 0.7% for AGIs over 100k)
Taxable dividends: $1,090 (reported on 21.4% of returns)
Here:
$1,090
State:
$5,394
(% of AGI for various income ranges: 2.0% for AGIs below $10k, 0.9% for AGIs $10k-25k, 0.5% for AGIs $25k-50k, 0.4% for AGIs $50k-75k, 0.3% for AGIs $75k-100k, 0.5% for AGIs over 100k)
Net capital gain/loss: +$2,982 (reported on 15.8% of returns)
Here:
+$2,982
State:
+$23,581
(% of AGI for various income ranges: -0.6% for AGIs below $10k, -0.2% for AGIs $10k-25k, 0.0% for AGIs $25k-50k, 0.2% for AGIs $50k-75k, 0.2% for AGIs $75k-100k, 2.6% for AGIs over 100k)
Profit/loss from business: +$7,139 (reported on 11.8% of returns)
Here:
+$7,139
State:
+$13,809
(% of AGI for various income ranges: 4.6% for AGIs below $10k, 5.9% for AGIs $10k-25k, 2.2% for AGIs $25k-50k, 0.8% for AGIs $50k-75k, 1.2% for AGIs $75k-100k, 1.3% for AGIs over 100k)
IRA payment deduction: $3,275 (reported on 2.7% of returns)
11763:
$3,275
New York:
$3,115
(% of AGI for various income ranges: 0.3% for AGIs $10k-25k, 0.3% for AGIs $25k-50k, 0.2% for AGIs $50k-75k, 0.1% for AGIs $75k-100k, 0.1% for AGIs over 100k)
Self-employed pension: $7,533 (reported on 0.4% of returns)
Here:
$7,533
New York:
$19,016
Total itemized deductions: $21,269 (28% of AGI, reported on 51.1% of returns)
Here:
$21,269
State:
$25,864
Here:
28.1% of AGI
State:
21.9% of AGI
(% of AGI for various income ranges: 14.4% for AGIs below $10k, 15.0% for AGIs $10k-25k, 21.3% for AGIs $25k-50k, 25.4% for AGIs $50k-75k, 24.9% for AGIs $75k-100k, 20.4% for AGIs over 100k)
Charity contributions deductions: $2,385 (3% of AGI, reported on 47.8% of returns)
Here:
$2,385
State:
$4,439
Here:
3.1% of AGI
State:
3.6% of AGI
(% of AGI for various income ranges: 0.7% for AGIs below $10k, 1.0% for AGIs $10k-25k, 2.0% for AGIs $25k-50k, 2.6% for AGIs $50k-75k, 2.7% for AGIs $75k-100k, 2.4% for AGIs over 100k)
Total tax: $6,228 (reported on 77.4% of returns)
11763:
$6,228
State:
$11,730
(% of AGI for various income ranges: 2.5% for AGIs below $10k, 4.2% for AGIs $10k-25k, 6.6% for AGIs $25k-50k, 7.8% for AGIs $50k-75k, 8.9% for AGIs $75k-100k, 14.6% for AGIs over 100k)
Earned income credit: $1,553 (reported on 10.7% of returns)
Here:
$1,553
State:
$1,757
Percentage of individuals using paid preparers for their 2004 taxes: 67.9%
Here:
68%
State:
67%
(% for various income ranges: 56.3% for AGIs below $10k, 64.6% for AGIs $10k-25k, 68.3% for AGIs $25k-50k, 72.6% for AGIs $50k-75k, 75.7% for AGIs $75k-100k, 75.8% for AGIs over 100k)
Household received Food Stamps/SNAP in the past 12 months: 757 Household did not receive Food Stamps/SNAP in the past 12 months: 8,937
Women who had a birth in the past 12 months: 186 (130 now married, 56 unmarried) Women who did not have a birth in the past 12 months: 5,908 (2,358 now married, 3,539 unmarried)
Housing units in zip code 11763 with a mortgage: 5,747 (547 second mortgage, 6 home equity loan, 397 both second mortgage and home equity loan) Houses without a mortgage: 174
Median monthly owner costs for units with a mortgage: $2,791 Median monthly owner costs for units without a mortgage: $1,129
Residents with income below the poverty level in 2022:
This zip code:
6.9%
Whole state:
14.3%
Residents with income below 50% of the poverty level in 2022:
This zip code:
2.0%
Whole state:
6.8%
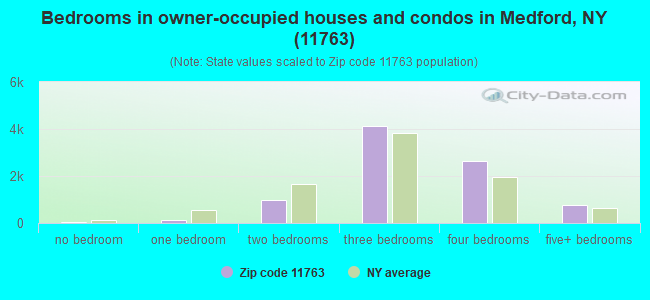
Median number of rooms in houses and condos:
Here:
6.9
State:
6.3
Median number of rooms in apartments:
Here:
4.6
State:
3.8
Notable locations in this zip code not listed on our city pages
Churches in zip code 11763 include: Saint Marks Episcopal Church (A), Saint Michaels and All Angels Church (B), Mount Olive Baptist Church (C), Community Church (D), Saint Sylvesters Church (E), Mary Church (F), Feed My Sheep Baptist Church (G), Medford Assembly of God (H), New Apostolic Church (I). Display/hide their locations on the map
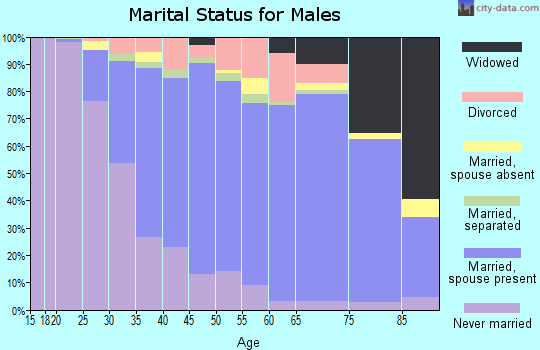
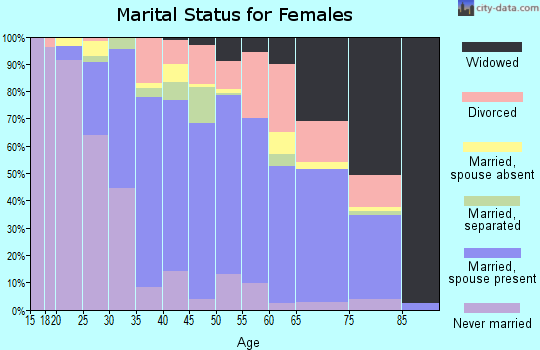
3,983 married couples with children.
1,006 single-parent households (193 men, 813 women).
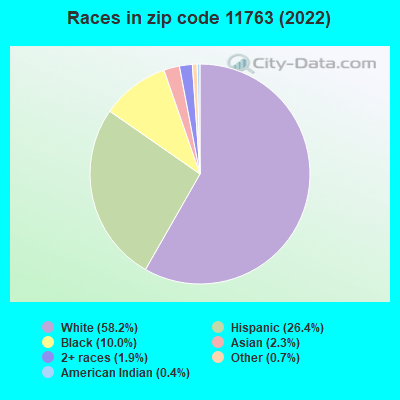
74.9% of residents of 11763 zip code speak English at home.
18.9% of residents speak Spanish at home (60% very well, 19% well, 13% not well, 8% not at all).
3.9% of residents speak other Indo-European language at home (54% very well, 41% well, 5% not well).
1.9% of residents speak Asian or Pacific Island language at home (58% very well, 36% well, 6% not well).
0.2% of residents speak other language at home (100% very well).
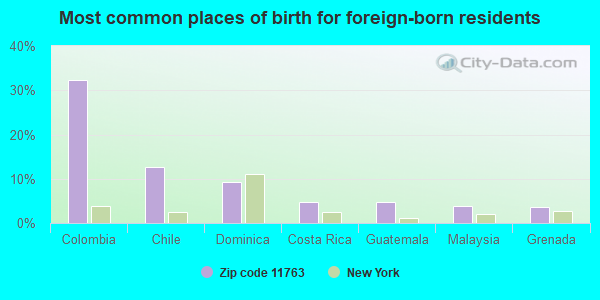
Foreign born population: 4,662 (15.9%) (61.6% of them are naturalized citizens)
This zip code:
15.9%
Whole state:
22.7%
32%Colombia
13%Chile
9%Dominica
5%Costa Rica
5%Guatemala
4%Malaysia
4%Grenada
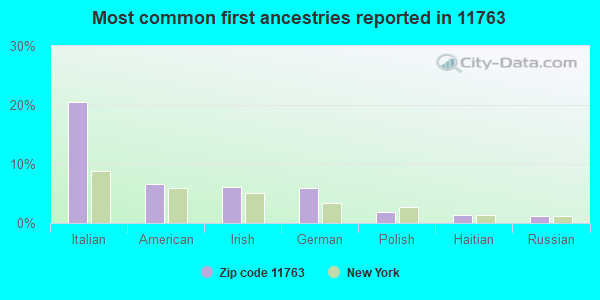
20%Italian
7%American
6%Irish
6%German
2%Polish
1%Haitian
1%Russian
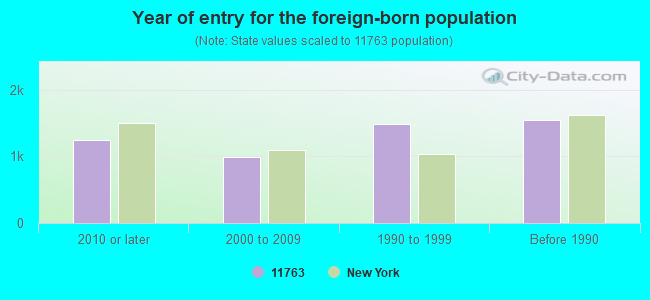
Year of entry for the foreign-born population
1,2442010 or later
9912000 to 2009
1,4911990 to 1999
1,542Before 1990
Major facilities with environmental interests located in this zip code:
CONNIES PRESTIGE FRENCH CLEANERS (1699 ROUTE 112 #F in MEDFORD, NY)
AIR MINOR (AIRS/AFS) STATE MASTER (New York facility tracking) - AIR PROGRAM, HAZARDOUS WASTE PROGRAM Small Quantity Generators, between 100 kg and 1000 kg of hazardous waste/month (Resource Conservation and Recovery Act (tracking hazardous waste)) - notification Business SIC classification: DRYCLEANING PLANTS, EXCEPT RUG CLEANING Business NAICS classification: DRYCLEANING AND LAUNDRY SERVICES (EXCEPT COIN-OPERATED). Organizations: CONNIE CLEANERS (CONTACT/OWNER)
Alternative names: CONNIE PRESTIGE FRENCH CLEANERS
GERSHOW RECYCLING CORP (71 PECONIC AVENUE in MEDFORD, NY)
AIR MAJOR (AIRS/AFS) - ICIS-, ENFORCEMENT/COMPLIANCE ACTIVITY CRITERIA AND HAZARDOUS AIR POLLUTANT INVENTORY (Inventory of air pollution sources) (Resource Conservation and Recovery Act (tracking hazardous waste)) Business SIC classification: SCRAP AND WASTE MATERIALS Alternative names: GERSHOW RECYCLING PLANT
GIORDANO S COLLISION, INC. (2164 RTE 112 in MEDFORD, NY)
STATE MASTER (New York facility tracking) - AIR PROGRAM Conditionally Exempt Small Quantity Generators, less than 100 kg/month of hazardous waste (Resource Conservation and Recovery Act (tracking hazardous waste)) - notification Organizations: LOUIS GIORDANO (CONTACT/OWNER)
, PAT LAGREGA (FACILITY APPLICATION CONTACT)
, GIORDANOS COLLISION INC (LEGALLY RESPONSIBLE PARTY)
Alternative names: GIORDANOS COLLISION INC
GLIDE-A-WAY COLLISION PROPERTY (2430 HORSEBLOCK RD in MEDFORD, NY)
STATE MASTER (New York facility tracking) - AIR PROGRAM Small Quantity Generators, between 100 kg and 1000 kg of hazardous waste/month (Resource Conservation and Recovery Act (tracking hazardous waste)) Organizations: GLIDE-A-WAY COLLISION INC (LEGALLY RESPONSIBLE PARTY)
Alternative names: GLIDE-A-WAY COLLISION INC
AMERICAN AVIONIC TECHNOLOGIES INC (198 INDUSTRIAL BLVD in MEDFORD, NY)
National Pollutant Discharge Elimination System NON-MAJOR (Tracking pollutant discharge elimination systems) - permit Business SIC classification: COIN-OPERATED LAUNDRIES AND DRYCLEANING Organizations: ANA'S LAUNDROMAT, INC (CONTACT/OWNER)
H S M MACHINE CO (3671 HORSEBLOCK RD in MEDFORD, NY)
(Resource Conservation and Recovery Act (tracking hazardous waste))
112 LEASEHOLDS LLC - VACANT LAND (1972 MEDFORD AVE in MEDFORD, NY)
(Resource Conservation and Recovery Act (tracking hazardous waste))
7-ELEVEN #32211 (2810 RTE 112 in MEDFORD, NY)
Small Quantity Generators, between 100 kg and 1000 kg of hazardous waste/month (Resource Conservation and Recovery Act (tracking hazardous waste)) - notification Organizations: 7-ELEVEN INC (CONTACT/OPERATOR)
, 7 ELEVEN INC (CONTACT/OWNER)
A & L LIGHTING LTD (15 COMMERCIAL BLVD in MEDFORD, NY)
Conditionally Exempt Small Quantity Generators, less than 100 kg/month of hazardous waste (Resource Conservation and Recovery Act (tracking hazardous waste)) Organizations: GLENN ALTMAN (CONTACT/OPERATOR)
A C A AMOCO #580 (RTE 112 & 495 in MEDFORD, NY)
(Resource Conservation and Recovery Act (tracking hazardous waste))
Housing units lacking complete plumbing facilities: 0.3% Housing units lacking complete kitchen facilities: 0.5%
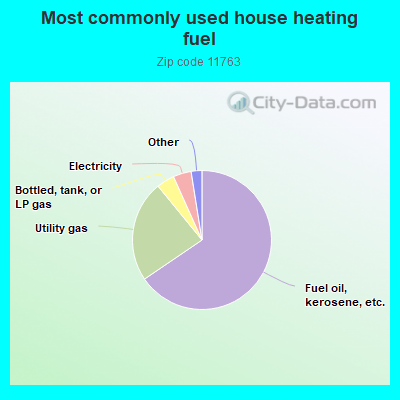
65.5%Fuel oil, kerosene, etc.
23.6%Utility gas
4.2%Bottled, tank, or LP gas
4.2%Electricity
1.0%Other fuel
0.7%Solar energy
0.6%Wood
Population in 1990: 20,669. Population change in the 1990s: +4,074 (+19.7%).
Place of birth for U.S.-born residents:
This state: 22,352
Northeast: 564
Midwest: 229
South: 551
West: 199
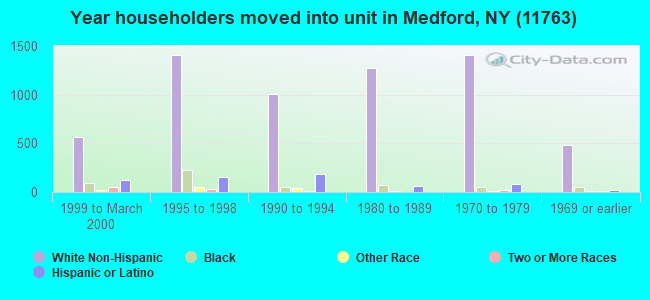
68% of the 11763 zip code residents lived in the same house 5 years ago. Out of people who lived in different houses, 77% lived in this county. Out of people who lived in different counties, 50% lived in New York.
94% of the 11763 zip code residents lived in the same house 1 year ago. Out of people who lived in different houses, 59% moved from this county. Out of people who lived in different houses, 26% moved from different county within same state. Out of people who lived in different houses, 13% moved from different state. Out of people who lived in different houses, 1% moved from abroad.
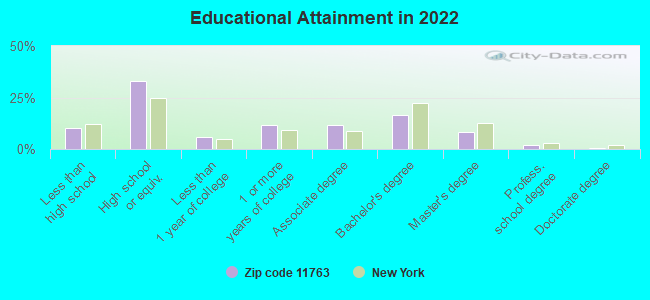
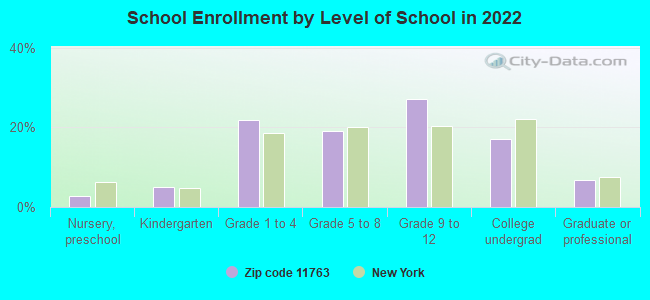
Private vs. public school enrollment:
Students in private schools in grades 1 to 8 (elementary and middle school): 45
Here:
1.5%
New York:
15.6%
Students in private schools in grades 9 to 12 (high school): 48
Here:
2.4%
New York:
15.0%
Students in private undergraduate colleges: 385
Here:
30.4%
New York:
39.2%
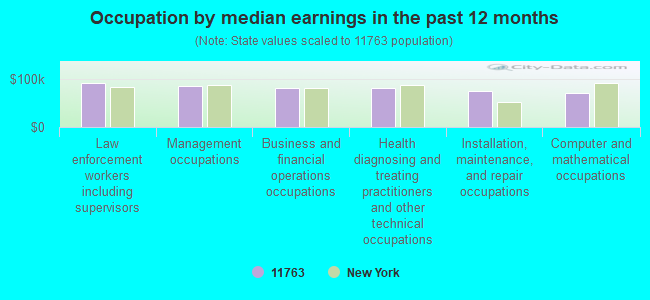
Occupation by median earnings in the past 12 months ($)
91,536Law enforcement workers including supervisors
86,777Management occupations
81,137Business and financial operations occupations
80,860Health diagnosing and treating practitioners and other technical occupations
74,649Installation, maintenance, and repair occupations
72,137Computer and mathematical occupations
Companies with biggest federal contracts located in this zip code (MEDFORD, NY):
ADVANCED ENERGY SYSTEMS, INC (27 INDUSTRIAL BLVD UNIT E; small business) : $9,971,092 in 25 contractsfrom 2001 to 2006
Contracts for Other Research and Development -- Advanced Development (R&D), Defense Missile and Space Systems -- Advanced Development (R&D), Other Defense -- Applied Research and Exploratory Development (R&D), Weapons -- Basic Research (R&D), and moreby Navy, Army, Department of Defense, Air Force, and others Signed by year:2000: $0; 2001: $740,224; 2002: $1,186,299; 2003: $1,561,934; 2004: $769,730; 2005: $2,905,000; 2006: $2,807,905.
Biggest contracts:
$2,515,000 with Navy for Other Research and Development -- Advanced Development (R&D). Signed on 2005-05-04. Completion date: 2008-05-03.
$2,234,400, same as above.Signed on 2006-04-14. Completion date: 2008-05-08.
$680,724 with Army for Defense Missile and Space Systems -- Advanced Development (R&D). Signed on 2001-10-25. Completion date: 2003-10-24.
$457,546, same as above.Signed on 2003-02-17. Completion date: 2003-10-24.
BLAIR INDUSTRIES INC (3671 HORSEBLOCK ROAD; small business) : $3,404,121 in 12 contractsfrom 2000 to 2006
Contracts for Airframe Structural Components, Aircraft Landing Gear Components, Bearings, Plain, Unmounted, Aircraft Landing Equipment, and moreby Navy, Defense Logistics Agency, Army Signed by year:2000: $727,800; 2001: $1,600,646; 2002: $0; 2003: $500,000; 2004: $91,300; 2005: $0; 2006: $484,375.
Biggest contracts:
$688,600 with Navy for Airframe Structural Components. Signed on 2000-01-27. Completion date: 2000-10-10.
$650,057 with Navy for Aircraft Landing Gear Components. Signed on 2001-05-24. Completion date: 2002-06-18.
$581,010 with Navy for Airframe Structural Components. Signed on 2001-03-09. Completion date: 2002-03-31.
$500,000, same as above.Signed on 2003-01-30. Completion date: 2004-02-28.
JACOBI INDUSTRIES (131 MIDDLE ISLAND RD; small business) : $711,142 in 15 contractsfrom 2000 to 2004
Contracts for Miscellaneous Vehicular Components, Miscellaneous Materials Handling Equipment, Vehicular Power Transmission Components, Vehicular Furniture and Accessories, and moreby Defense Logistics Agency, Army Signed by year:2000: $38,850; 2001: $284,425; 2002: $0; 2003: $83,061; 2004: $304,806; 2005: $0; 2006: $0.
Biggest contracts:
$115,259 with Defense Logistics Agency for Miscellaneous Vehicular Components. Signed on 2004-03-26. Completion date: 2004-08-23.
$95,000 with Defense Logistics Agency for Miscellaneous Materials Handling Equipment. Signed on 2004-08-12. Completion date: 2004-09-12.
$93,250, same as above.Signed on 2004-11-05. Completion date: 2005-03-15.
$69,130 with Army for Vehicular Power Transmission Components. Taking place in UT. Signed on 2001-10-12. Completion date: 2002-04-19.
AUTOMATED PRODUCTION EQUIPMENT (3661 HORSEBLOCK RD # N) : $555,132 in 30 contractsfrom 2000 to 2006
Contracts for Miscellaneous Welding, Soldering, and Brazing Supplies and Accessories, Engine Electrical System Components, Aircraft Prime Moving, Miscellaneous Electrical and Electronic Components, Miscellaneous Communication Equipment, and moreby Defense Logistics Agency, NASA, Army Signed by year:2000: $121,916; 2001: $61,700; 2002: $0; 2003: $0; 2004: $71,495; 2005: $277,741; 2006: $22,280.
Biggest contracts:
$121,916 with Defense Logistics Agency for Miscellaneous Welding, Soldering, and Brazing Supplies and Accessories. Signed on 2000-04-01. Completion date: 2000-05-02.
$61,700, same as above.Signed on 2001-06-27. Completion date: 2001-08-21.
$60,800, same as above.Signed on 2005-02-07. Completion date: 2005-04-08.
$60,506, same as above.Signed on 2005-02-24. Completion date: 2005-03-26.
BIJAL CORPORATION (2695 ROUTE 112; small business) : $445,740 in 3 contractsin 2003
$398,820 with Army for Miscellaneous Items. Signed on 2003-05-04. Completion date: 2003-09-30.
$46,920 with Army for Purchase of Structures and Facilities -- Troop Housing Facilities. Signed on 2003-03-10. Completion date: 2003-03-11.
$0, same as above.Signed on 2003-03-10. Completion date: 2003-03-11.
AMERICAN AVIONIC TECHNOLOGIES (25-1 INDUSTRIAL BLVD; small business) : $435,187 in 10 contractsfrom 2000 to 2005
Contracts for Converters, Electrical, Nonrotating, Miscellaneous Items, Electrical and Electronic assemblies, Boards, Cards, and Associated Hardware by Air Force, Navy Signed by year:2000: $50,400; 2001: $235,180; 2002: $0; 2003: $110,046; 2004: $33,545; 2005: $6,016; 2006: $0.
Biggest contracts:
$69,485 with Air Force for Converters, Electrical, Nonrotating. Signed on 2001-05-10. Completion date: 2001-11-30.
$64,140, same as above.Signed on 2001-06-06. Completion date: 2001-12-31.
$53,450, same as above.Signed on 2001-12-06. Completion date: 2002-12-31.
$50,400, same as above.Signed on 2000-03-09. Completion date: 2000-06-30.
TRINITY TECHNOLOGIES, INC (37C CEDARHURST AVE; small business) 50 employees, $0 revenue. Woman Owned Business: $143,040 in 10 contractsfrom 2004 to 2006
Contracts for Bearings, Antifriction, Unmounted, Aircraft Hydraulic, Vacuum, and De-icing System Components, Automatic Pilot Mechanisms and Airborne Gyro Components, Capacitors, and moreby Army, Air Force, Defense Logistics Agency Signed by year:2000: $0; 2001: $0; 2002: $0; 2003: $0; 2004: $6,000; 2005: $107,820; 2006: $29,220.
Biggest contracts:
$86,888 with Army for Bearings, Antifriction, Unmounted. Signed on 2005-12-21. Completion date: 2006-01-27.
$22,662 with Air Force for Aircraft Hydraulic, Vacuum, and De-icing System Components. Signed on 2006-02-17. Completion date: 2006-03-03.
$13,700 with Army for Bearings, Antifriction, Unmounted. Signed on 2006-06-15. Completion date: 2006-06-30.
$9,764 with Defense Logistics Agency for Automatic Pilot Mechanisms and Airborne Gyro Components. Signed on 2005-04-13. Completion date: 2005-10-11.
CJ COMPONENT PRODUCTS, LLC (10 INDUSTRIAL BLVD; small business) : $133,810 in 15 contractsfrom 2004 to 2006
Contracts for Headsets, Handsets, Microphones and Speakers, Miscellaneous Electrical and Electronic Components, Switches by Defense Logistics Agency Signed by year:2000: $0; 2001: $0; 2002: $0; 2003: $0; 2004: $50,512; 2005: $52,533; 2006: $30,765.
Biggest contracts:
$22,225 with Defense Logistics Agency for Headsets, Handsets, Microphones and Speakers. Signed on 2006-04-28. Completion date: 2006-07-27.
$16,154, same as above.Signed on 2004-10-06. Completion date: 2004-12-06.
$16,154, same as above.Signed on 2004-10-06. Completion date: 2004-12-06.
$13,120, same as above.Signed on 2005-12-13. Completion date: 2006-02-12.
INTEGRATED DESIGN SOLUTIONS, L (3247 ROUTE 112, SUITE 3) : $70,641 in 4 contractsin 2005
$48,872 with Army for Office Furniture. Signed on 2005-08-04. Completion date: 2005-09-16.
$11,470, same as above.Signed on 2005-09-25. Completion date: 2005-10-22.
$6,536, same as above.Signed on 2005-08-16. Completion date: 2005-09-16.
$3,763, same as above.Signed on 2005-09-30. Completion date: 2005-10-23.
SANDEX MANUFACTURING CORP (173 ROBINSON AVE; small business) : $28,685 in 8 contractsfrom 2004 to 2005
Contracts for Airframe Structural Components, Screws, Antennas, Waveguides, and Related Equipment, Indoor and Outdoor Electric Lighting Fixtures, and moreby Air Force, Army Signed by year:2000: $0; 2001: $0; 2002: $0; 2003: $0; 2004: $8,565; 2005: $20,120; 2006: $0.
Biggest contracts:
$7,570 with Air Force for Airframe Structural Components. Signed on 2005-12-12. Completion date: 2005-12-14.
$5,300 with Air Force for Screws. Signed on 2005-06-27. Completion date: 2005-10-31.
$5,213 with Army for Antennas, Waveguides, and Related Equipment. Signed on 2004-10-28. Completion date: 2004-11-08.
$3,385 with Air Force for Indoor and Outdoor Electric Lighting Fixtures. Signed on 2005-09-15. Completion date: 2005-09-19.
Top industries in this zip code by the number of employees in 2005:
Administrative and Support and Waste Management and Remediation Services: Solid Waste Collection (50-99 employees: 2 establishments, 20-49 employees: 1 establishment, 10-19 employees: 1 establishment)
Wholesale Trade: Metal Service Centers and Other Metal Merchant Wholesalers (100-249: 1, 1-4: 1)
Wholesale Trade: Recyclable Material Merchant Wholesalers (100-249: 1)
Finance and Insurance: Credit Unions (100-249: 1)
People in group quarters in 2010:
307 people in nursing facilities/skilled-nursing facilities
77 people in group homes intended for adults
47 people in emergency and transitional shelters (with sleeping facilities) for people experiencing homelessness
38 people in other noninstitutional facilities
21 people in residential treatment centers for adults
12 people in workers' group living quarters and job corps centers
People in group quarters in 2000:
56 people in homes for the mentally ill
52 people in homes for the mentally retarded
16 people in other group homes
10 people in religious group quarters
3 people in other noninstitutional group quarters
Fatal accident statistics in 2014:
Fatal accident count: 1
Vehicles involved in fatal accidents: 2
Fatal accidents caused by drunken drivers: 0
Fatalities: 1
Persons involved in fatal accidents: 2
Pedestrians involved in fatal accidents: 0
Fatal accident statistics in 2013:
Fatal accident count: 4
Vehicles involved in fatal accidents: 7
Fatal accidents caused by drunken drivers: 0
Fatalities: 4
Persons involved in fatal accidents: 7
Pedestrians involved in fatal accidents: 0
Home Mortgage Disclosure Act Aggregated Statistics For Year 2009 (Based on 6 full and 10 partial tracts)
A) FHA, FSA/RHS & VA Home Purchase Loans
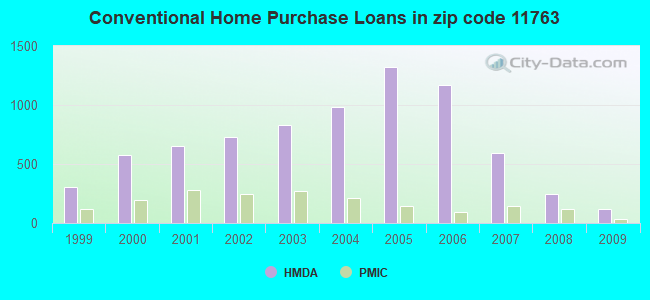
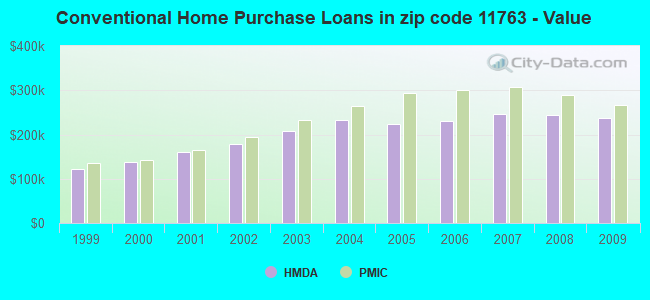
B) Conventional Home Purchase Loans
C) Refinancings
D) Home Improvement Loans
F) Non-occupant Loans on < 5 Family Dwellings (A B C & D)
Number
Average Value
Number
Average Value
Number
Average Value
Number
Average Value
Number
Average Value
LOANS ORIGINATED
175
$270,007
121
$237,808
647
$211,591
43
$130,775
16
$265,102
APPLICATIONS APPROVED, NOT ACCEPTED
20
$222,151
15
$276,423
82
$244,836
4
$40,408
2
$218,000
APPLICATIONS DENIED
47
$252,258
42
$219,258
406
$264,069
59
$66,938
9
$97,460
APPLICATIONS WITHDRAWN
44
$228,600
23
$292,623
268
$249,467
24
$84,676
5
$87,154
FILES CLOSED FOR INCOMPLETENESS
3
$186,917
5
$265,970
62
$255,139
4
$115,050
0
$0
Aggregated Statistics For Year 2008 (Based on 6 full and 10 partial tracts)
A) FHA, FSA/RHS & VA Home Purchase Loans
B) Conventional Home Purchase Loans
C) Refinancings
D) Home Improvement Loans
E) Loans on Dwellings For 5+ Families
F) Non-occupant Loans on < 5 Family Dwellings (A B C & D)
G) Loans On Manufactured Home Dwelling (A B C & D)
Number
Average Value
Number
Average Value
Number
Average Value
Number
Average Value
Number
Average Value
Number
Average Value
Number
Average Value
LOANS ORIGINATED
85
$303,979
245
$243,108
439
$212,929
136
$79,546
1
$64,820
24
$166,609
0
$0
APPLICATIONS APPROVED, NOT ACCEPTED
5
$309,000
51
$279,993
91
$229,766
29
$48,234
0
$0
7
$183,791
0
$0
APPLICATIONS DENIED
24
$323,991
106
$293,172
395
$251,958
148
$92,396
0
$0
34
$196,229
2
$70,000
APPLICATIONS WITHDRAWN
9
$293,937
50
$294,254
200
$275,420
23
$111,300
0
$0
4
$113,398
0
$0
FILES CLOSED FOR INCOMPLETENESS
3
$242,590
19
$277,104
42
$276,552
10
$55,878
0
$0
2
$210,015
0
$0
Aggregated Statistics For Year 2007 (Based on 6 full and 10 partial tracts)
A) FHA, FSA/RHS & VA Home Purchase Loans
B) Conventional Home Purchase Loans
C) Refinancings
D) Home Improvement Loans
E) Loans on Dwellings For 5+ Families
F) Non-occupant Loans on < 5 Family Dwellings (A B C & D)
G) Loans On Manufactured Home Dwelling (A B C & D)
Number
Average Value
Number
Average Value
Number
Average Value
Number
Average Value
Number
Average Value
Number
Average Value
Number
Average Value
LOANS ORIGINATED
32
$300,172
597
$246,126
980
$222,547
368
$78,073
2
$51,188,700
48
$222,114
0
$0
APPLICATIONS APPROVED, NOT ACCEPTED
1
$182,790
153
$234,834
226
$230,838
67
$56,893
0
$0
16
$290,991
0
$0
APPLICATIONS DENIED
7
$297,801
301
$262,908
888
$275,613
221
$103,021
0
$0
33
$275,974
2
$71,955
APPLICATIONS WITHDRAWN
10
$336,780
105
$233,050
333
$263,967
57
$150,065
0
$0
17
$227,513
0
$0
FILES CLOSED FOR INCOMPLETENESS
0
$0
37
$302,855
133
$267,629
16
$183,323
0
$0
3
$293,313
0
$0
Aggregated Statistics For Year 2006 (Based on 6 full and 10 partial tracts)
A) FHA, FSA/RHS & VA Home Purchase Loans
B) Conventional Home Purchase Loans
C) Refinancings
D) Home Improvement Loans
F) Non-occupant Loans on < 5 Family Dwellings (A B C & D)
G) Loans On Manufactured Home Dwelling (A B C & D)
Number
Average Value
Number
Average Value
Number
Average Value
Number
Average Value
Number
Average Value
Number
Average Value
LOANS ORIGINATED
26
$297,915
1,170
$229,776
1,514
$210,242
383
$103,721
99
$223,486
2
$61,000
APPLICATIONS APPROVED, NOT ACCEPTED
0
$0
145
$213,661
284
$220,296
69
$76,168
10
$228,211
2
$55,945
APPLICATIONS DENIED
1
$223,630
324
$254,549
908
$254,619
260
$89,954
41
$254,111
2
$134,000
APPLICATIONS WITHDRAWN
1
$436,240
158
$246,463
665
$241,361
70
$141,800
13
$237,244
0
$0
FILES CLOSED FOR INCOMPLETENESS
0
$0
42
$224,148
239
$273,830
12
$156,106
1
$202,980
0
$0
Aggregated Statistics For Year 2005 (Based on 6 full and 10 partial tracts)
A) FHA, FSA/RHS & VA Home Purchase Loans
B) Conventional Home Purchase Loans
C) Refinancings
D) Home Improvement Loans
E) Loans on Dwellings For 5+ Families
F) Non-occupant Loans on < 5 Family Dwellings (A B C & D)
G) Loans On Manufactured Home Dwelling (A B C & D)
Number
Average Value
Number
Average Value
Number
Average Value
Number
Average Value
Number
Average Value
Number
Average Value
Number
Average Value
LOANS ORIGINATED
5
$246,090
1,319
$224,481
1,771
$215,217
362
$89,515
0
$0
118
$208,580
0
$0
APPLICATIONS APPROVED, NOT ACCEPTED
0
$0
174
$220,364
267
$221,280
86
$72,374
1
$4,569,810
21
$223,093
0
$0
APPLICATIONS DENIED
1
$207,420
272
$231,563
945
$230,615
243
$90,564
0
$0
56
$197,095
0
$0
APPLICATIONS WITHDRAWN
3
$240,887
230
$236,803
767
$231,530
111
$166,837
0
$0
49
$218,241
1
$181,500
FILES CLOSED FOR INCOMPLETENESS
1
$168,530
76
$246,072
512
$246,466
13
$62,035
0
$0
9
$197,812
0
$0
Aggregated Statistics For Year 2004 (Based on 6 full and 10 partial tracts)
A) FHA, FSA/RHS & VA Home Purchase Loans
B) Conventional Home Purchase Loans
C) Refinancings
D) Home Improvement Loans
F) Non-occupant Loans on < 5 Family Dwellings (A B C & D)
G) Loans On Manufactured Home Dwelling (A B C & D)
Number
Average Value
Number
Average Value
Number
Average Value
Number
Average Value
Number
Average Value
Number
Average Value
LOANS ORIGINATED
19
$247,342
980
$233,151
2,118
$188,359
400
$90,568
118
$183,794
11
$32,731
APPLICATIONS APPROVED, NOT ACCEPTED
6
$189,943
167
$240,755
411
$203,216
60
$74,506
32
$185,907
1
$12,960
APPLICATIONS DENIED
7
$227,997
218
$247,927
813
$199,531
213
$79,213
40
$196,871
3
$35,157
APPLICATIONS WITHDRAWN
6
$277,478
157
$251,810
776
$200,035
94
$104,869
21
$204,770
0
$0
FILES CLOSED FOR INCOMPLETENESS
2
$345,580
54
$219,494
401
$217,425
16
$81,668
10
$153,482
0
$0
Aggregated Statistics For Year 2003 (Based on 6 full and 10 partial tracts)
A) FHA, FSA/RHS & VA Home Purchase Loans
B) Conventional Home Purchase Loans
C) Refinancings
D) Home Improvement Loans
F) Non-occupant Loans on < 5 Family Dwellings (A B C & D)
Number
Average Value
Number
Average Value
Number
Average Value
Number
Average Value
Number
Average Value
LOANS ORIGINATED
96
$218,904
828
$207,483
3,529
$160,855
323
$34,484
88
$163,348
APPLICATIONS APPROVED, NOT ACCEPTED
1
$253,810
124
$210,354
576
$161,915
72
$32,722
11
$146,550
APPLICATIONS DENIED
17
$191,266
137
$226,010
1,183
$170,753
234
$42,310
34
$185,678
APPLICATIONS WITHDRAWN
18
$207,496
94
$213,366
865
$167,101
92
$51,769
11
$157,803
FILES CLOSED FOR INCOMPLETENESS
5
$223,444
31
$213,656
160
$171,232
21
$72,724
1
$153,200
Aggregated Statistics For Year 2002 (Based on 6 full and 10 partial tracts)
A) FHA, FSA/RHS & VA Home Purchase Loans
B) Conventional Home Purchase Loans
C) Refinancings
D) Home Improvement Loans
E) Loans on Dwellings For 5+ Families
F) Non-occupant Loans on < 5 Family Dwellings (A B C & D)
Number
Average Value
Number
Average Value
Number
Average Value
Number
Average Value
Number
Average Value
Number
Average Value
LOANS ORIGINATED
143
$190,669
733
$178,297
2,294
$158,281
351
$39,462
0
$0
96
$133,178
APPLICATIONS APPROVED, NOT ACCEPTED
9
$189,800
110
$190,276
493
$135,828
110
$35,148
0
$0
17
$115,569
APPLICATIONS DENIED
19
$152,092
101
$174,995
960
$137,429
213
$35,221
0
$0
21
$141,678
APPLICATIONS WITHDRAWN
27
$190,120
89
$195,894
695
$142,932
133
$40,425
2
$4,662,000
6
$167,818
FILES CLOSED FOR INCOMPLETENESS
10
$188,421
35
$176,612
264
$143,896
5
$28,488
0
$0
7
$118,477
Aggregated Statistics For Year 2001 (Based on 6 full and 10 partial tracts)
A) FHA, FSA/RHS & VA Home Purchase Loans
B) Conventional Home Purchase Loans
C) Refinancings
D) Home Improvement Loans
F) Non-occupant Loans on < 5 Family Dwellings (A B C & D)
Number
Average Value
Number
Average Value
Number
Average Value
Number
Average Value
Number
Average Value
LOANS ORIGINATED
173
$158,198
652
$160,805
1,629
$127,349
344
$35,469
49
$110,122
APPLICATIONS APPROVED, NOT ACCEPTED
16
$172,073
82
$163,054
315
$102,931
135
$36,171
7
$111,440
APPLICATIONS DENIED
27
$173,437
120
$172,009
889
$111,308
302
$27,552
34
$113,521
APPLICATIONS WITHDRAWN
42
$162,569
92
$158,154
624
$121,276
127
$31,138
9
$130,183
FILES CLOSED FOR INCOMPLETENESS
9
$178,607
19
$172,055
157
$122,580
8
$48,939
4
$62,108
Aggregated Statistics For Year 2000 (Based on 6 full and 10 partial tracts)
A) FHA, FSA/RHS & VA Home Purchase Loans
B) Conventional Home Purchase Loans
C) Refinancings
D) Home Improvement Loans
F) Non-occupant Loans on < 5 Family Dwellings (A B C & D)
Number
Average Value
Number
Average Value
Number
Average Value
Number
Average Value
Number
Average Value
LOANS ORIGINATED
167
$140,112
578
$137,868
519
$82,283
292
$26,771
38
$96,709
APPLICATIONS APPROVED, NOT ACCEPTED
8
$132,719
91
$152,928
133
$78,423
131
$27,112
6
$99,918
APPLICATIONS DENIED
31
$164,812
164
$139,278
617
$89,759
280
$27,461
33
$93,425
APPLICATIONS WITHDRAWN
38
$155,664
79
$131,045
601
$80,623
41
$59,868
17
$91,495
FILES CLOSED FOR INCOMPLETENESS
3
$94,937
30
$132,836
96
$98,327
9
$60,781
5
$123,822
Aggregated Statistics For Year 1999 (Based on 3 full and 5 partial tracts)
A) FHA, FSA/RHS & VA Home Purchase Loans
B) Conventional Home Purchase Loans
C) Refinancings
D) Home Improvement Loans
E) Loans on Dwellings For 5+ Families
F) Non-occupant Loans on < 5 Family Dwellings (A B C & D)
2002 - 2018 National Fire Incident Reporting System (NFIRS) incidents
Based on the data from the years 2002 - 2018 the average number of fire incidents per year is 77. The highest number of reported fire incidents - 151 took place in 2002, and the least - 0 in 2005. The data has a decreasing trend.
When looking into fire subcategories, the most reports belonged to: Outside Fires (45.9%), and Structure Fires (30.0%).
Fire incident types reported to NFIRS in Zip Code 11763


 Nearest zip codes: 11738, 11727, 11742, 11980, 11772, 11713.


 Based on the data from the years 2002 - 2018 the average number of fire incidents per year is 77. The highest number of reported fire incidents - 151 took place in 2002, and the least - 0 in 2005. The data has a decreasing trend.
 When looking into fire subcategories, the most reports belonged to: Outside Fires (45.9%), and Structure Fires (30.0%).