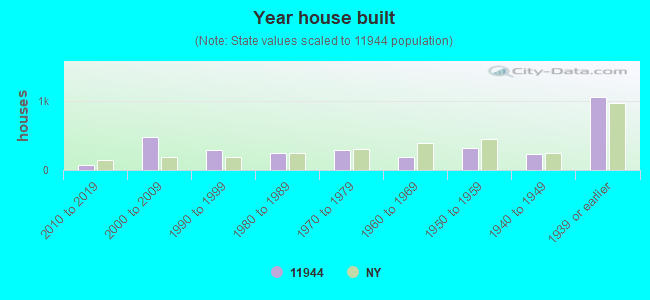
Estimated zip code population in 2022: 4,722 Zip code population in 2010: 4,299 Zip code population in 2000: 3,705
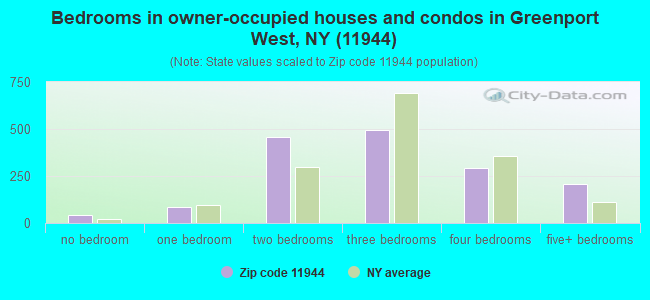
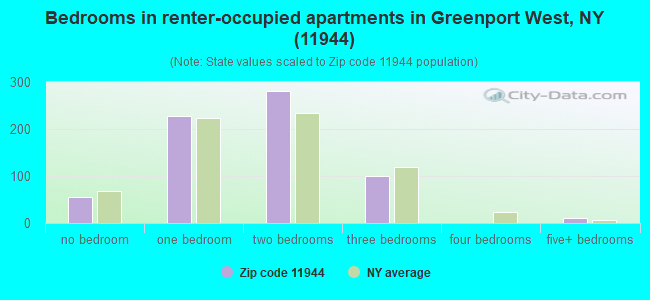
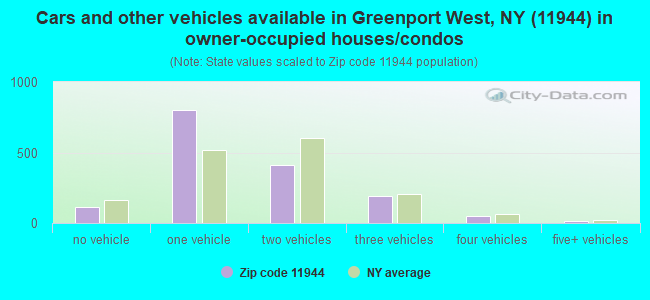
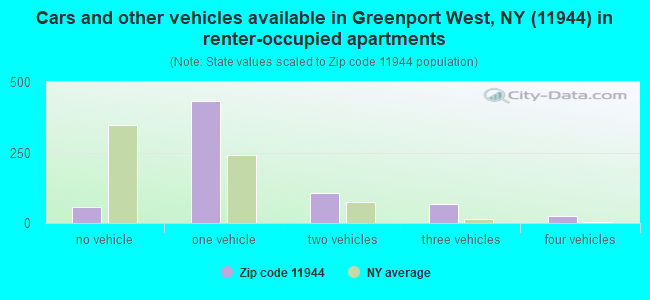
Houses and condos: 3,189 Renter-occupied apartments: 676
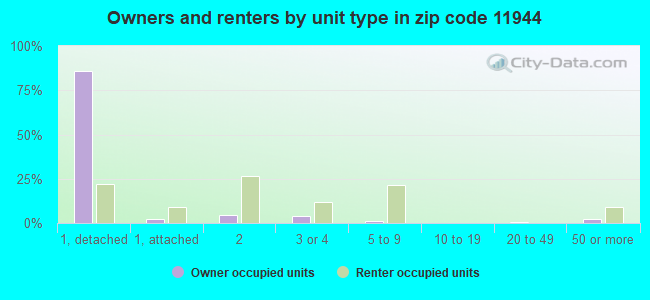
% of renters here:
30%
State:
46%
March 2022 cost of living index in zip code 11944: 156.7 (very high, U.S. average is 100)
Land area: 4.1 sq. mi. Water area: 3.5 sq. mi.
Population density: 1,159 people per square mile
(low).
OSM Map
General Map
Google Map
MSN Map
OSM Map
General Map
Google Map
MSN Map
OSM Map
General Map
Google Map
MSN Map
OSM Map
General Map
Google Map
MSN Map
Please wait while loading the map...
Real estate property taxes paid for housing units in 2022:
This zip code:
0.8% ($6,371)
New York:
1.5% ($6,180)
Median real estate property taxes paid for housing units with mortgages in 2022: $5,731 (0.8%) Median real estate property taxes paid for housing units with no mortgage in 2022: $7,325 (0.9%)
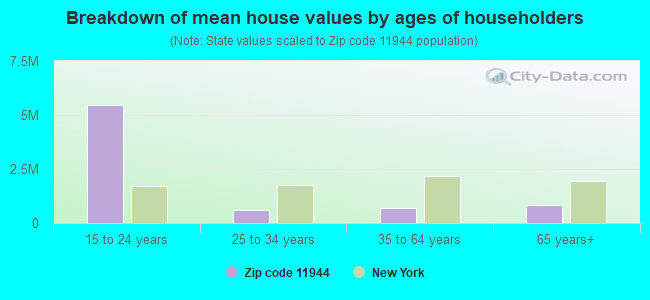
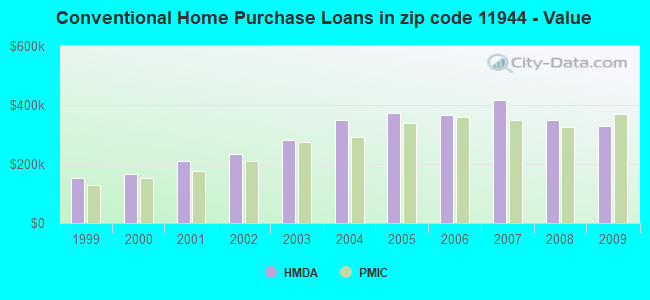
Estimated median house/condo value in 2022: $750,659
11944:
$750,659
New York:
$400,400
According to our research of New York and other state lists, there were 2 registered sex offenders living in 11944 zip code as of April 27, 2024. The ratio of all residents to sex offenders in zip code 11944 is 2,134 to 1. The ratio of registered sex offenders to all residents in this zip code is lower than the state average.
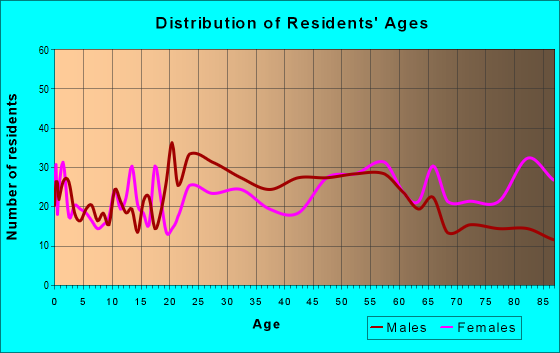
Median resident age:
This zip code:
56.0 years
New York median age:
40.0 years
Average household size:
This zip code:
2.0 people
New York:
2.5 people
Averages for the 2020 tax year for zip code 11944, filed in 2021:
Average Adjusted Gross Income (AGI) in 2020: $90,095 (Individual Income Tax Returns)
Here:
$90,095
State:
$90,930
Salary/wage: $68,671 (reported on 67.6% of returns)
Here:
$68,671
State:
$72,104
(% of AGI for various income ranges: 1390.5% for AGIs below $25k, 3843.3% for AGIs $25k-50k, 6082.1% for AGIs $50k-75k, 9320.9% for AGIs $75k-100k, 14322.7% for AGIs $100k-200k, 96458.0% for AGIs over 200k)
Taxable interest for individuals: $2,429 (reported on 41.1% of returns)
This zip code:
$2,429
New York:
$3,075
(% of AGI for various income ranges: 40.5% for AGIs below $25k, 52.1% for AGIs $25k-50k, 110.5% for AGIs $50k-75k, 164.5% for AGIs $75k-100k, 448.0% for AGIs $100k-200k, 1962.0% for AGIs over 200k)
Ordinary dividends: $15,247 (reported on 31.5% of returns)
Here:
$15,247
State:
$11,095
(% of AGI for various income ranges: 74.4% for AGIs below $25k, 107.7% for AGIs $25k-50k, 406.3% for AGIs $50k-75k, 829.1% for AGIs $75k-100k, 2502.7% for AGIs $100k-200k, 10880.0% for AGIs over 200k)
Net capital gain/loss in AGI: +$31,860 (reported on 29.0% of returns)
Here:
+$31,860
State:
+$44,925
(% of AGI for various income ranges: 10.5% for AGIs below $25k, 29.0% for AGIs $25k-50k, 303.2% for AGIs $50k-75k, 548.2% for AGIs $75k-100k, 1432.0% for AGIs $100k-200k, 37642.0% for AGIs over 200k)
Profit/loss from business: +$17,756 (reported on 17.8% of returns)
Here:
+$17,756
State:
+$14,940
(% of AGI for various income ranges: 337.9% for AGIs below $25k, 236.2% for AGIs $25k-50k, 518.9% for AGIs $50k-75k, 520.9% for AGIs $75k-100k, 1172.0% for AGIs $100k-200k, 4158.0% for AGIs over 200k)
Taxable individual retirement arrangement distribution: $27,713 (reported on 12.4% of returns)
11944:
$27,713
New York:
$19,609
(% of AGI for various income ranges: 49.7% for AGIs below $25k, 99.2% for AGIs $25k-50k, 234.7% for AGIs $50k-75k, 569.1% for AGIs $75k-100k, 2212.7% for AGIs $100k-200k, 6684.0% for AGIs over 200k)
Self-employed (Keogh) retirement plans: $16,267 (reported on 1.2% of returns)
11944:
$16,267
New York:
$32,497
(% of AGI for various income ranges: 325.3% for AGIs $100k-200k)
Total itemized deductions: $35,083 (reported on 19.5% of returns)
Here:
$35,083
State:
$39,326
(% of AGI for various income ranges: 262.8% for AGIs below $25k, 390.5% for AGIs $25k-50k, 993.2% for AGIs $50k-75k, 1707.3% for AGIs $75k-100k, 2986.0% for AGIs $100k-200k, 11394.0% for AGIs over 200k)
Charity contributions: $6,415 (reported on 16.2% of returns)
Here:
$6,415
State:
$15,420
(% of AGI for various income ranges: 9.7% for AGIs below $25k, 24.4% for AGIs $25k-50k, 102.1% for AGIs $50k-75k, 220.9% for AGIs $75k-100k, 389.3% for AGIs $100k-200k, 2696.0% for AGIs over 200k)
Taxes paid: $7,783 (reported on 19.5% of returns)
11944:
$7,783
State:
$9,183
(% of AGI for various income ranges: 55.9% for AGIs below $25k, 66.7% for AGIs $25k-50k, 246.8% for AGIs $50k-75k, 412.7% for AGIs $75k-100k, 726.0% for AGIs $100k-200k, 2336.0% for AGIs over 200k)
Earned income credit: $2,177 (reported on 12.4% of returns)
Here:
$2,177
State:
$2,138
(% of AGI for various income ranges: 103.6% for AGIs below $25k, 63.8% for AGIs $25k-50k)
Percentage of individuals using paid preparers for their 2020 taxes: 93.4%
Here:
93%
State:
95%
(% for various income ranges: 90.1% for AGIs below $25k, 94.7% for AGIs $25k-50k, 93.8% for AGIs $50k-75k, 95.5% for AGIs $75k-100k, 94.4% for AGIs $100k-200k, 95.7% for AGIs over 200k)
Averages for the 2012 tax year for zip code 11944, filed in 2013:
Average Adjusted Gross Income (AGI) in 2012: $61,138 (Individual Income Tax Returns)
Here:
$61,138
State:
$77,088
Salary/wage: $42,974 (reported on 68.6% of returns)
Here:
$42,974
State:
$60,593
(% of AGI for various income ranges: 66.8% for AGIs below $25k, 66.8% for AGIs $25k-50k, 57.0% for AGIs $50k-75k, 53.8% for AGIs $75k-100k, 48.2% for AGIs $100k-200k, 26.0% for AGIs over 200k)
Taxable interest for individuals: $2,397 (reported on 46.2% of returns)
This zip code:
$2,397
New York:
$3,125
(% of AGI for various income ranges: 2.0% for AGIs below $25k, 1.6% for AGIs $25k-50k, 1.8% for AGIs $50k-75k, 1.9% for AGIs $75k-100k, 2.1% for AGIs $100k-200k, 1.6% for AGIs over 200k)
Ordinary dividends: $11,235 (reported on 32.6% of returns)
Here:
$11,235
State:
$10,299
(% of AGI for various income ranges: 3.4% for AGIs below $25k, 2.9% for AGIs $25k-50k, 4.9% for AGIs $50k-75k, 5.4% for AGIs $75k-100k, 6.3% for AGIs $100k-200k, 8.9% for AGIs over 200k)
Net capital gain/loss in AGI: +$24,508 (reported on 25.4% of returns)
Here:
+$24,508
State:
+$42,474
(% of AGI for various income ranges: 0.6% for AGIs $25k-50k, 0.9% for AGIs $50k-75k, 1.5% for AGIs $75k-100k, 3.1% for AGIs $100k-200k, 34.9% for AGIs over 200k)
Profit/loss from business: +$13,980 (reported on 16.9% of returns)
Here:
+$13,980
State:
+$16,168
(% of AGI for various income ranges: 10.1% for AGIs below $25k, 4.7% for AGIs $25k-50k, 5.4% for AGIs $50k-75k, 3.0% for AGIs $75k-100k, 5.2% for AGIs $100k-200k)
Taxable individual retirement arrangement distribution: $20,455 (reported on 16.1% of returns)
11944:
$20,455
New York:
$17,621
(% of AGI for various income ranges: 3.2% for AGIs below $25k, 4.2% for AGIs $25k-50k, 3.9% for AGIs $50k-75k, 5.8% for AGIs $75k-100k, 7.3% for AGIs $100k-200k, 5.2% for AGIs over 200k)
Self-employment retirement plans: $24,250 (reported on 0.8% of returns)
11944:
$24,250
New York:
$27,330
Total itemized deductions: $29,059 (26% of AGI, reported on 40.3% of returns)
Here:
$29,059
State:
$34,985
Here:
26.2% of AGI
State:
21.3% of AGI
(% of AGI for various income ranges: 16.8% for AGIs below $25k, 15.8% for AGIs $25k-50k, 21.4% for AGIs $50k-75k, 19.9% for AGIs $75k-100k, 20.1% for AGIs $100k-200k, 19.0% for AGIs over 200k)
Charity contributions: $5,183 (reported on 35.2% of returns)
Here:
$5,183
State:
$5,572
(% of AGI for various income ranges: 0.9% for AGIs below $25k, 1.4% for AGIs $25k-50k, 2.1% for AGIs $50k-75k, 2.7% for AGIs $75k-100k, 2.4% for AGIs $100k-200k, 5.6% for AGIs over 200k)
Taxes paid: $11,353 (reported on 40.3% of returns)
11944:
$11,353
State:
$18,656
(% of AGI for various income ranges: 4.3% for AGIs below $25k, 4.2% for AGIs $25k-50k, 7.1% for AGIs $50k-75k, 7.5% for AGIs $75k-100k, 8.6% for AGIs $100k-200k, 9.2% for AGIs over 200k)
Earned income credit: $1,882 (reported on 11.9% of returns)
Here:
$1,882
State:
$2,230
(% of AGI for various income ranges: 3.5% for AGIs below $25k, 0.7% for AGIs $25k-50k)
Percentage of individuals using paid preparers for their 2012 taxes: 72.9%
Here:
73%
State:
66%
(% for various income ranges: 67.4% for AGIs below $25k, 71.4% for AGIs $25k-50k, 76.7% for AGIs $50k-75k, 81.0% for AGIs $75k-100k, 78.6% for AGIs $100k-200k, 88.9% for AGIs over 200k)
Averages for the 2004 tax year for zip code 11944, filed in 2005:
Average Adjusted Gross Income (AGI) in 2004: $58,303 (Individual Income Tax Returns)
Here:
$58,303
State:
$59,519
Salary/wage: $40,012 (reported on 67.2% of returns)
Here:
$40,012
State:
$50,673
(% of AGI for various income ranges: 154.7% for AGIs below $10k, 65.6% for AGIs $10k-25k, 65.8% for AGIs $25k-50k, 55.7% for AGIs $50k-75k, 49.7% for AGIs $75k-100k, 33.4% for AGIs over 100k)
Taxable interest for individuals: $3,334 (reported on 59.6% of returns)
This zip code:
$3,334
New York:
$2,377
(% of AGI for various income ranges: 14.1% for AGIs below $10k, 3.6% for AGIs $10k-25k, 3.0% for AGIs $25k-50k, 4.0% for AGIs $50k-75k, 4.3% for AGIs $75k-100k, 3.0% for AGIs over 100k)
Taxable dividends: $8,276 (reported on 41.4% of returns)
Here:
$8,276
State:
$5,394
(% of AGI for various income ranges: 26.7% for AGIs below $10k, 4.3% for AGIs $10k-25k, 3.3% for AGIs $25k-50k, 4.8% for AGIs $50k-75k, 4.4% for AGIs $75k-100k, 7.2% for AGIs over 100k)
Net capital gain/loss: +$33,055 (reported on 31.3% of returns)
Here:
+$33,055
State:
+$23,581
(% of AGI for various income ranges: -3.0% for AGIs below $10k, -1.2% for AGIs $10k-25k, 0.5% for AGIs $25k-50k, 3.4% for AGIs $50k-75k, 3.2% for AGIs $75k-100k, 32.4% for AGIs over 100k)
Profit/loss from business: +$15,122 (reported on 16.0% of returns)
Here:
+$15,122
State:
+$13,809
(% of AGI for various income ranges: 6.8% for AGIs below $10k, 7.8% for AGIs $10k-25k, 7.5% for AGIs $25k-50k, 3.6% for AGIs $50k-75k, 6.5% for AGIs $75k-100k, 2.3% for AGIs over 100k)
IRA payment deduction: $3,250 (reported on 4.2% of returns)
11944:
$3,250
New York:
$3,115
(% of AGI for various income ranges: 0.3% for AGIs $10k-25k, 0.7% for AGIs $25k-50k, 0.3% for AGIs $50k-75k, 0.3% for AGIs $75k-100k, 0.1% for AGIs over 100k)
Self-employed pension: $6,923 (reported on 0.6% of returns)
Here:
$6,923
New York:
$19,016
Total itemized deductions: $25,206 (25% of AGI, reported on 44.1% of returns)
Here:
$25,206
State:
$25,864
Here:
25.4% of AGI
State:
21.9% of AGI
(% of AGI for various income ranges: 45.8% for AGIs below $10k, 18.1% for AGIs $10k-25k, 18.8% for AGIs $25k-50k, 20.5% for AGIs $50k-75k, 23.6% for AGIs $75k-100k, 17.5% for AGIs over 100k)
Charity contributions deductions: $4,381 (4% of AGI, reported on 41.8% of returns)
Here:
$4,381
State:
$4,439
Here:
4.3% of AGI
State:
3.6% of AGI
(% of AGI for various income ranges: 2.1% for AGIs below $10k, 1.7% for AGIs $10k-25k, 1.8% for AGIs $25k-50k, 2.8% for AGIs $50k-75k, 3.1% for AGIs $75k-100k, 3.8% for AGIs over 100k)
Total tax: $9,471 (reported on 76.2% of returns)
11944:
$9,471
State:
$11,730
(% of AGI for various income ranges: 5.7% for AGIs below $10k, 4.5% for AGIs $10k-25k, 7.6% for AGIs $25k-50k, 9.3% for AGIs $50k-75k, 10.5% for AGIs $75k-100k, 16.1% for AGIs over 100k)
Earned income credit: $1,677 (reported on 10.8% of returns)
Here:
$1,677
State:
$1,757
Percentage of individuals using paid preparers for their 2004 taxes: 74.4%
Here:
74%
State:
67%
(% for various income ranges: 61.7% for AGIs below $10k, 71.8% for AGIs $10k-25k, 77.5% for AGIs $25k-50k, 76.9% for AGIs $50k-75k, 76.7% for AGIs $75k-100k, 87.2% for AGIs over 100k)
Household received Food Stamps/SNAP in the past 12 months: 103 Household did not receive Food Stamps/SNAP in the past 12 months: 2,117
Women who had a birth in the past 12 months: 27 (27 now married, 0 unmarried) Women who did not have a birth in the past 12 months: 638 (283 now married, 352 unmarried)
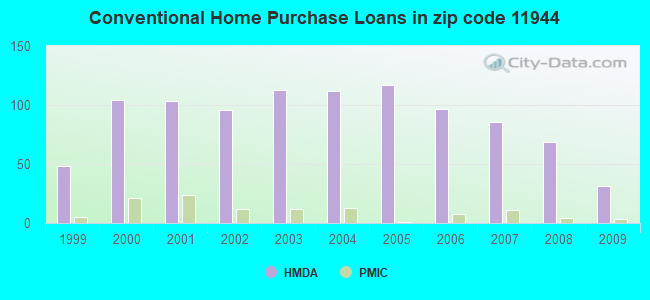
Housing units in zip code 11944 with a mortgage: 740 (75 second mortgage, 76 both second mortgage and home equity loan) Houses without a mortgage: 54
Median monthly owner costs for units with a mortgage: $2,341 Median monthly owner costs for units without a mortgage: $1,084
Residents with income below the poverty level in 2022:
This zip code:
10.1%
Whole state:
14.3%
Residents with income below 50% of the poverty level in 2022:
This zip code:
2.0%
Whole state:
6.8%
Median number of rooms in houses and condos:
Here:
6.0
State:
6.3
Median number of rooms in apartments:
Here:
4.1
State:
3.8
Notable locations in this zip code not listed on our city pages
Notable locations in zip code 11944: Greenport Village Sewage Treatment Plant (A), Brecknock Hall (B), Floyd Memorial Library (C), Greenport Fire Department Station 2 (D), Greenport Theatre (E), Greenport Village Hall (F), Greenport Fire Department Station 1 (G), The Shores at Peconic Landing (H). Display/hide their locations on the map
Churches in zip code 11944 include: Saint Peter's Evangelical Lutheran Church (A), Bible Baptist Church (B), Clinton Memorial African Methodist Episcopal Zion Church (C), Saint Agargyroi Greek Orthodox Church (D), First Baptist Church of Greenport (E), Greenport United Methodist Church (F), Saint Agnes Roman Catholic Church (G), Holy Trinity Episcopal Church (H). Display/hide their locations on the map
In group quarters: 237 (-1 institutionalized population)
Size of family households: 654 2-persons, 302 3-persons, 187 4-persons, 15 5-persons, 41 6-persons, 18 7-or-more-persons
Size of nonfamily households: 933 1-person, 112 2-persons
396 married couples with children.
176 single-parent households (128 men, 48 women).
79.4% of residents of 11944 zip code speak English at home.
14.3% of residents speak Spanish at home (48% very well, 14% well, 31% not well, 6% not at all).
5.2% of residents speak other Indo-European language at home (77% very well, 19% well, 4% not well).
1.0% of residents speak Asian or Pacific Island language at home (48% very well, 35% well, 17% not well).
0.8% of residents speak other language at home (70% very well, 30% not well).
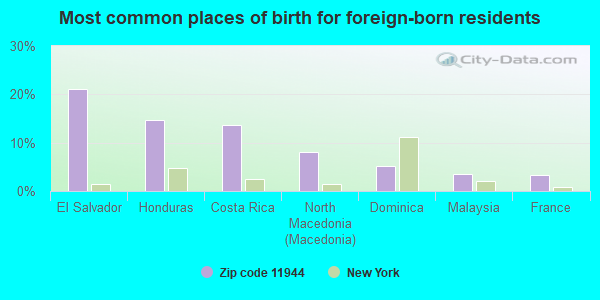
Foreign born population: 698 (14.8%) (33.0% of them are naturalized citizens)
This zip code:
14.8%
Whole state:
22.7%
21%El Salvador
15%Honduras
14%Costa Rica
8%North Macedonia (Macedonia)
5%Dominica
4%Malaysia
3%France
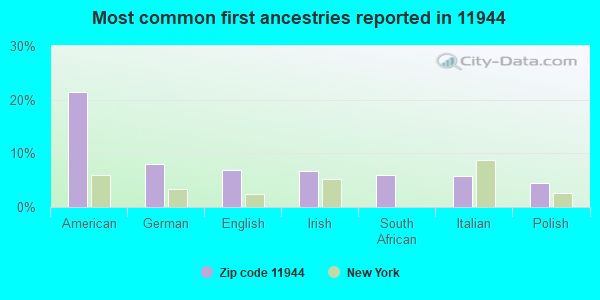
21%American
8%German
7%English
7%Irish
6%South African
6%Italian
5%Polish
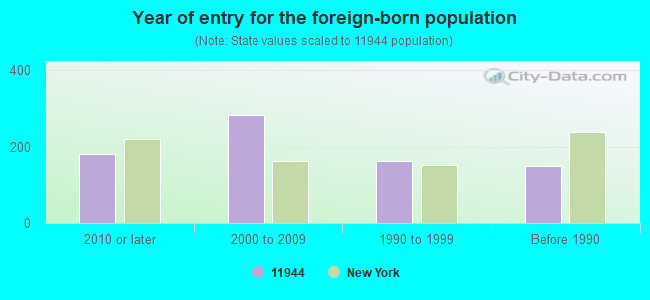
Year of entry for the foreign-born population
1822010 or later
2832000 to 2009
1621990 to 1999
149Before 1990
Major facilities with environmental interests located in this zip code:
GREENPORT POWER PLANT (236 3RD STREET in GREENPORT, NY)
AIR SYNTHETIC MINOR (AIRS/AFS) STATE MASTER (New York facility tracking) - AIR PROGRAM (Integrated Compliance Information System) - ICIS-02-1994-0062, FORMAL ENFORCEMENT ACTION, ICIS-02-2000-8426, COMPLIANCE ACTIVITY (Tracking inspections of insecticide, fungicide, and rodenticide, and toxic substances) Business SIC classification: WATER SUPPLY; GENERAL GOVERNMENT Organizations: GREENPORT - V (LEGALLY RESPONSIBLE PARTY)
Alternative names: VILLAGE OF GREENPORT, VILLAGE OF GREENPORT, MUNICIPAL, VILLAGE OF GREENPORT MUNICIPAL UTILITY
HOPPY S CLEANERS INC (329 FRONT ST in GREENPORT, NY)
AIR MINOR (AIRS/AFS) STATE MASTER (New York facility tracking) - AIR PROGRAM, HAZARDOUS WASTE PROGRAM (Resource Conservation and Recovery Act (tracking hazardous waste)) Business SIC classification: DRYCLEANING PLANTS, EXCEPT RUG CLEANING Business NAICS classification: DRYCLEANING AND LAUNDRY SERVICES (EXCEPT COIN-OPERATED). Alternative names: HOPPY'S CLEANERS INC, HOPPYS CLEANERS INC
GLOBAL COMMON GREENPORT LLC (1885 MOORES LANE in GREENPORT, NY)
AIR SYNTHETIC MINOR (AIRS/AFS) STATE MASTER (New York facility tracking) - AIR PROGRAM, Small Quantity Generators, between 100 kg and 1000 kg of hazardous waste/month (Resource Conservation and Recovery Act (tracking hazardous waste)) Business SIC classification: ELECTRIC SERVICES Business NAICS classification: FOSSIL FUEL ELECTRIC POWER GENERATION. Organizations: MICAHEL J GIARRATANO (CONTACT/OPERATOR)
, MICHAEL J GIARRATANO (CONTACT/OWNER)
, AIR RESOURCES GROUP LLC (FACILITY APPLICATION CONTACT)
, HAWKEYE ENERGY GREENPORT LLC (LEGALLY RESPONSIBLE PARTY)
GREENPORT UNION FREE SCHOOL DISTRICT (720 FRONT ST in GREENPORT, NY)
AIR SYNTHETIC MINOR (AIRS/AFS) STATE MASTER (New York facility tracking) - GROUNDWATER PROGRAM Business SIC and NAICS classification: ELEMENTARY AND SECONDARY SCHOOLS Organizations: GREENPORT UNION FREE SCH DIST (LEGALLY RESPONSIBLE PARTY)
Alternative names: GREENPORT PUBLIC SCHOOL
GREENPORT ES ( in GREENPORT, NY)
(National Center for Education Statistics) - STATE ID-581010020002 Organizations: GREENPORT UFSD (SCHOOL DISTRICT)
GREENPORT HS ( in GREENPORT, NY)
(National Center for Education Statistics) - STATE ID-581010020001 Organizations: GREENPORT UFSD (SCHOOL DISTRICT)
GREENPORT TOWN OF JOSLEN WATER TANK (JOSLEN BLVD - SEC 100.18 in GREENPORT, NY)
Large Quantity Generators, more that 1000 kg of hazardous waste/month (Resource Conservation and Recovery Act (tracking hazardous waste)) Organizations: TOWN OF GREENPORT (CONTACT/OPERATOR)
GREENPORT SERVICE STATION INC (1100 MAIN ST in GREENPORT, NY)
(Resource Conservation and Recovery Act (tracking hazardous waste))
GREENPORT TOWN OF 2 MG WATER STORAGE TK (RTE 9 & 10 BROECK RD INTERSECT in GREENPORT, NY)
(Resource Conservation and Recovery Act (tracking hazardous waste))
GULF - C/O TARTAN OIL CORP (MAIN ST & FRONT ST in GREENPORT, NY)
(Resource Conservation and Recovery Act (tracking hazardous waste))
INDEPENDENT CEMENT CORP (RTE 9 in GREENPORT, NY)
(Resource Conservation and Recovery Act (tracking hazardous waste))
COLUMBUS COUNTY - ENVIRON PRODUCTS & SVC (RTE 23 B - HIGHWAY GARAGE in GREENPORT, NY)
(Resource Conservation and Recovery Act (tracking hazardous waste))
GREENPORT (V) STP (236 THIRD STREET in GREENPORT, NY)
National Pollutant Discharge Elimination System MAJOR (Tracking pollutant discharge elimination systems) - permit Business SIC classification: SEWERAGE SYSTEMS Alternative names: GREENPORT (V) WWTP, SOUTHOLD TOWN WASTE PLANT
Housing units lacking complete plumbing facilities: 2.6% Housing units lacking complete kitchen facilities: 1.7%
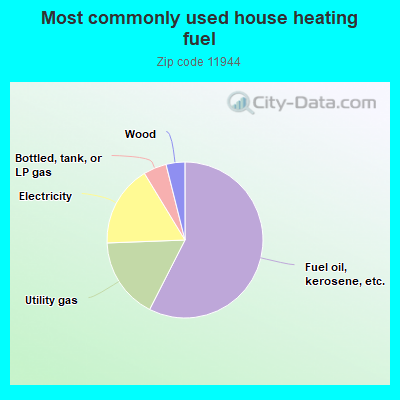
57.5%Fuel oil, kerosene, etc.
16.9%Utility gas
16.9%Electricity
4.8%Bottled, tank, or LP gas
3.9%Wood
Population in 1990: 3,657. Population change in the 1990s: +48 (+1.3%).
Place of birth for U.S.-born residents:
This state: 3,338
Northeast: 251
Midwest: 159
South: 112
West: 73
65% of the 11944 zip code residents lived in the same house 5 years ago. Out of people who lived in different houses, 76% lived in this county. Out of people who lived in different counties, 50% lived in New York.
89% of the 11944 zip code residents lived in the same house 1 year ago. Out of people who lived in different houses, 42% moved from this county. Out of people who lived in different houses, 42% moved from different county within same state. Out of people who lived in different houses, 11% moved from different state. Out of people who lived in different houses, 5% moved from abroad.
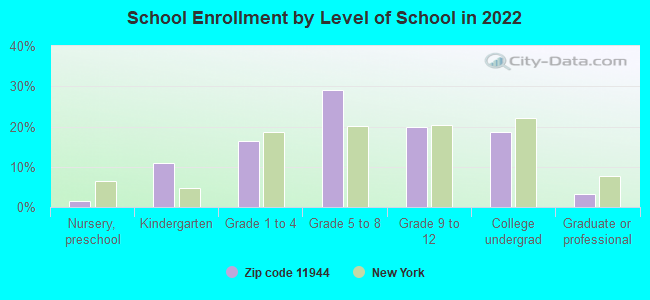
Private vs. public school enrollment:
Students in private schools in grades 1 to 8 (elementary and middle school): 71
Here:
25.1%
New York:
15.6%
Students in private schools in grades 9 to 12 (high school): 30
Here:
23.8%
New York:
15.0%
Students in private undergraduate colleges: 43
Here:
37.5%
New York:
39.2%
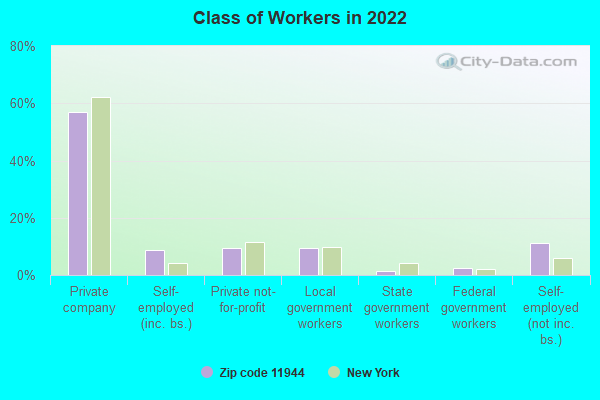
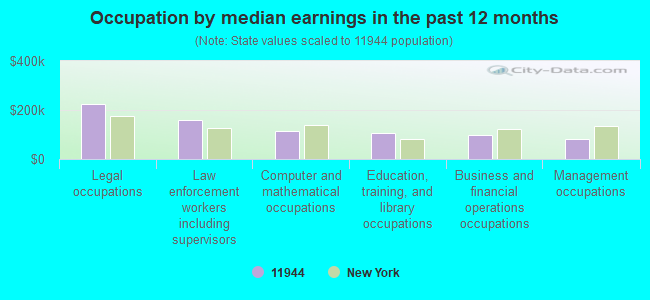
Occupation by median earnings in the past 12 months ($)
225,385Legal occupations
158,948Law enforcement workers including supervisors
112,372Computer and mathematical occupations
104,223Education, training, and library occupations
99,433Business and financial operations occupations
80,145Management occupations
Companies with federal contracts located in this zip code:
REEL FLOATATION SYSTEM INC (423 5TH ST in GREENPORT, NY; small business) : $216,430 in 3 contractsfrom 2003 to 2004
$96,080 with Army for Pontoons And Floating Docks. Taking place in OR. Signed on 2004-09-14. Completion date: 2004-09-30.
$96,080 with U.S. Army Corps of Engineers - civil program financing only for Pontoons And Floating Docks. Taking place in OR. Signed on 2004-09-14. Completion date: 2004-09-30.
$24,270, same as above.Signed on 2003-09-22. Completion date: 2003-09-30.
SILVER SANDS MOTEL INC (70930 SILVERMERE RD in GREENPORT, NY; small business) 3 employees, $600000 revenue.
$46,200 with Animal and Plant Health Inspection Service for Miscellaneous Items. Signed on 2003-03-15. Completion date: 2003-06-15.
Top industries in this zip code by the number of employees in 2005:
Health Care and Social Assistance: General Medical and Surgical Hospitals (250-499 employees: 1 establishment)
Health Care and Social Assistance: Nursing Care Facilities (100-249: 2)


 Nearest zip codes: 11939, 11971, 11964, 11965, 11958, 11963.