Estimated zip code population in 2022: 6,920 Zip code population in 2010: 6,602 Zip code population in 2000: 8,367
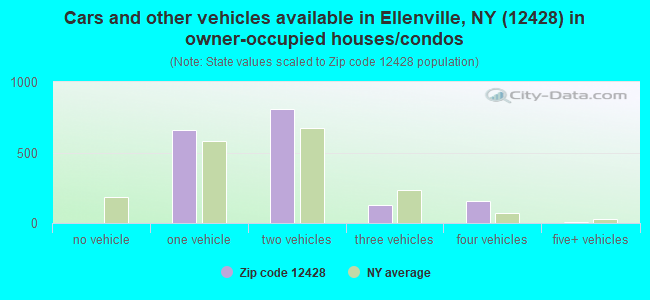
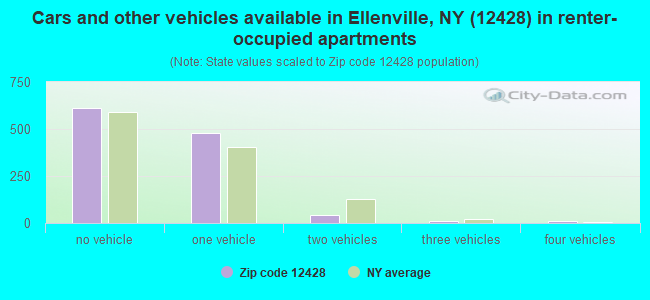
Houses and condos: 3,818 Renter-occupied apartments: 1,147
% of renters here:
39%
State:
46%
March 2022 cost of living index in zip code 12428: 107.7 (more than average, U.S. average is 100)
Land area: 54.0 sq. mi. Water area: 0.6 sq. mi.
Population density: 128 people per square mile
(very low).
OSM Map
General Map
Google Map
MSN Map
OSM Map
General Map
Google Map
MSN Map
OSM Map
General Map
Google Map
MSN Map
OSM Map
General Map
Google Map
MSN Map
Please wait while loading the map...
Real estate property taxes paid for housing units in 2022:
This zip code:
2.5% ($4,823)
New York:
1.5% ($6,180)
Median real estate property taxes paid for housing units with mortgages in 2022: $5,650 (2.9%) Median real estate property taxes paid for housing units with no mortgage in 2022: $4,161 (2.1%)
Business Search- 14 Million verified businesses
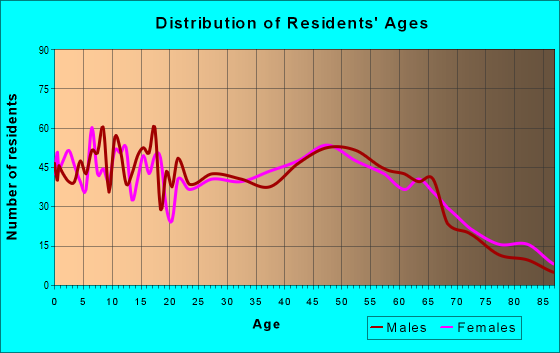
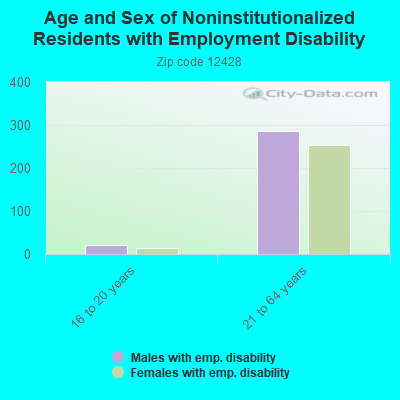
Males: 3,673
(53.1%)
Females: 3,246
(46.9%)
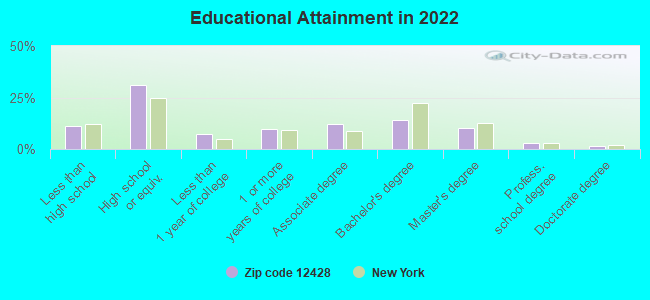
For population 25 years and over in 12428:
High school or higher: 88.4%
Bachelor's degree or higher: 28.4%
Graduate or professional degree: 14.3%
Unemployed: 4.7%
Mean travel time to work (commute): 29.7 minutes
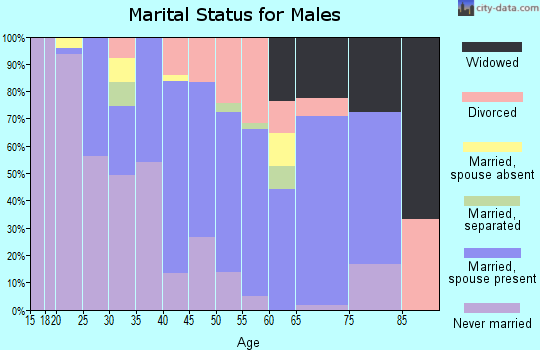
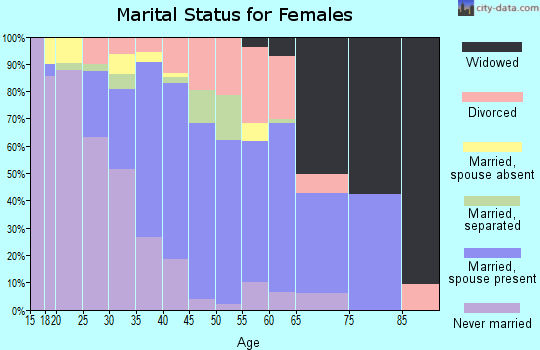
For population 15 years and over in 12428:
Never married: 38.1%
Now married: 42.0%
Separated: 2.1%
Widowed: 6.7%
Divorced: 11.1%
Zip code 12428 compared to state average:
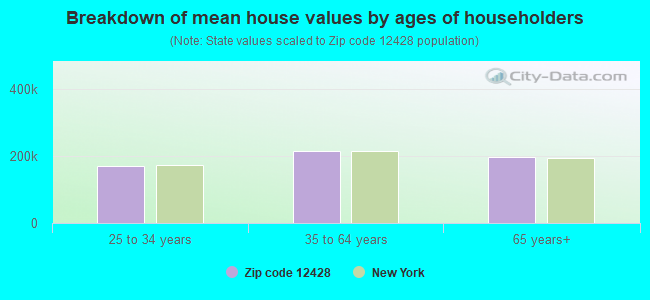
Median house value below state average.
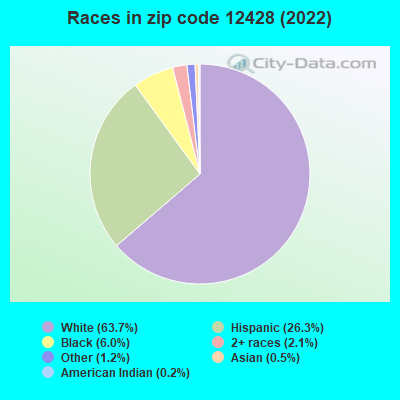
Black race population percentage below state average.
Median age above state average.
Foreign-born population percentage significantly below state average.
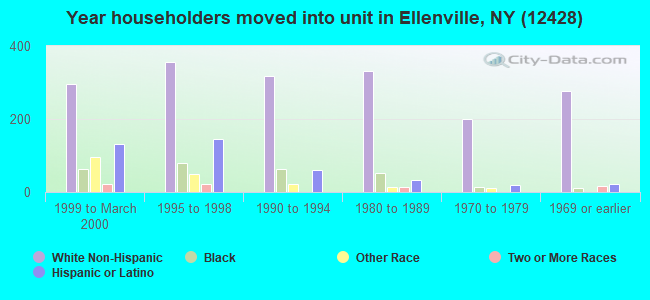
Length of stay since moving in significantly above state average.
Averages for the 2020 tax year for zip code 12428, filed in 2021:
Average Adjusted Gross Income (AGI) in 2020: $48,541 (Individual Income Tax Returns)
Here:
$48,541
State:
$90,930
Salary/wage: $41,778 (reported on 83.4% of returns)
Here:
$41,778
State:
$72,104
(% of AGI for various income ranges: 1074.2% for AGIs below $25k, 3272.8% for AGIs $25k-50k, 6182.7% for AGIs $50k-75k, 9654.4% for AGIs $75k-100k, 14591.7% for AGIs $100k-200k)
Taxable interest for individuals: $1,112 (reported on 23.3% of returns)
This zip code:
$1,112
New York:
$3,075
(% of AGI for various income ranges: 16.7% for AGIs below $25k, 7.4% for AGIs $25k-50k, 44.7% for AGIs $50k-75k, 31.2% for AGIs $75k-100k, 85.6% for AGIs $100k-200k)
Ordinary dividends: $4,619 (reported on 11.3% of returns)
Here:
$4,619
State:
$11,095
(% of AGI for various income ranges: 9.9% for AGIs below $25k, 17.9% for AGIs $25k-50k, 56.3% for AGIs $50k-75k, 53.1% for AGIs $75k-100k, 279.4% for AGIs $100k-200k)
Net capital gain/loss in AGI: +$12,859 (reported on 9.5% of returns)
Here:
+$12,859
State:
+$44,925
(% of AGI for various income ranges: 11.1% for AGIs below $25k, 20.3% for AGIs $25k-50k, 41.0% for AGIs $50k-75k, 78.1% for AGIs $75k-100k, 405.6% for AGIs $100k-200k)
Profit/loss from business: +$9,930 (reported on 11.7% of returns)
Here:
+$9,930
State:
+$14,940
(% of AGI for various income ranges: 109.2% for AGIs below $25k, 90.9% for AGIs $25k-50k, 175.3% for AGIs $50k-75k, 221.2% for AGIs $75k-100k, 508.9% for AGIs $100k-200k)
Taxable individual retirement arrangement distribution: $11,038 (reported on 5.7% of returns)
12428:
$11,038
New York:
$19,609
(% of AGI for various income ranges: 23.9% for AGIs below $25k, 32.6% for AGIs $25k-50k, 133.0% for AGIs $50k-75k, 129.4% for AGIs $75k-100k, 416.1% for AGIs $100k-200k)
Total itemized deductions: $22,167 (reported on 4.2% of returns)
Here:
$22,167
State:
$39,326
(% of AGI for various income ranges: 41.4% for AGIs below $25k, 167.7% for AGIs $50k-75k, 400.6% for AGIs $75k-100k, 660.6% for AGIs $100k-200k)
Charity contributions: $5,250 (reported on 2.8% of returns)
Here:
$5,250
State:
$15,420
(% of AGI for various income ranges: 15.6% for AGIs $25k-50k, 53.8% for AGIs $75k-100k, 126.7% for AGIs $100k-200k)
Taxes paid: $8,150 (reported on 4.2% of returns)
12428:
$8,150
State:
$9,183
(% of AGI for various income ranges: 11.6% for AGIs below $25k, 71.7% for AGIs $50k-75k, 169.4% for AGIs $75k-100k, 222.2% for AGIs $100k-200k)
Earned income credit: $2,468 (reported on 24.0% of returns)
Here:
$2,468
State:
$2,138
(% of AGI for various income ranges: 134.7% for AGIs below $25k, 90.3% for AGIs $25k-50k)
Percentage of individuals using paid preparers for their 2020 taxes: 94.0%
Here:
94%
State:
95%
(% for various income ranges: 92.4% for AGIs below $25k, 93.9% for AGIs $25k-50k, 95.0% for AGIs $50k-75k, 95.7% for AGIs $75k-100k, 96.4% for AGIs $100k-200k, 100.0% for AGIs over 200k)
Averages for the 2012 tax year for zip code 12428, filed in 2013:
Average Adjusted Gross Income (AGI) in 2012: $43,501 (Individual Income Tax Returns)
Here:
$43,501
State:
$77,088
Salary/wage: $37,219 (reported on 83.5% of returns)
Here:
$37,219
State:
$60,593
(% of AGI for various income ranges: 72.7% for AGIs below $25k, 76.5% for AGIs $25k-50k, 79.0% for AGIs $50k-75k, 75.3% for AGIs $75k-100k, 86.6% for AGIs $100k-200k)
Taxable interest for individuals: $1,157 (reported on 30.5% of returns)
This zip code:
$1,157
New York:
$3,125
(% of AGI for various income ranges: 1.1% for AGIs below $25k, 0.7% for AGIs $25k-50k, 0.4% for AGIs $50k-75k, 0.6% for AGIs $75k-100k, 1.5% for AGIs $100k-200k)
Ordinary dividends: $3,691 (reported on 13.7% of returns)
Here:
$3,691
State:
$10,299
(% of AGI for various income ranges: 1.0% for AGIs below $25k, 1.0% for AGIs $25k-50k, 0.6% for AGIs $50k-75k, 0.9% for AGIs $75k-100k, 2.5% for AGIs $100k-200k)
Net capital gain/loss in AGI: +$1,155 (reported on 8.8% of returns)
Here:
+$1,155
State:
+$42,474
(% of AGI for various income ranges: 0.5% for AGIs $25k-50k, 0.5% for AGIs $75k-100k, 0.3% for AGIs $100k-200k)
Profit/loss from business: +$9,789 (reported on 14.1% of returns)
Here:
+$9,789
State:
+$16,168
(% of AGI for various income ranges: 9.2% for AGIs below $25k, 3.2% for AGIs $25k-50k, 2.2% for AGIs $50k-75k, 1.4% for AGIs $75k-100k, 3.0% for AGIs $100k-200k)
Taxable individual retirement arrangement distribution: $10,189 (reported on 7.2% of returns)
12428:
$10,189
New York:
$17,621
(% of AGI for various income ranges: 1.8% for AGIs below $25k, 2.0% for AGIs $25k-50k, 1.1% for AGIs $50k-75k, 2.5% for AGIs $75k-100k, 2.0% for AGIs $100k-200k)
Total itemized deductions: $21,273 (25% of AGI, reported on 29.7% of returns)
Here:
$21,273
State:
$34,985
Here:
24.9% of AGI
State:
21.3% of AGI
(% of AGI for various income ranges: 7.4% for AGIs below $25k, 11.5% for AGIs $25k-50k, 14.9% for AGIs $50k-75k, 17.4% for AGIs $75k-100k, 18.1% for AGIs $100k-200k, 16.1% for AGIs over 200k)
Charity contributions: $2,692 (reported on 24.5% of returns)
Here:
$2,692
State:
$5,572
(% of AGI for various income ranges: 0.5% for AGIs below $25k, 1.1% for AGIs $25k-50k, 1.6% for AGIs $50k-75k, 1.9% for AGIs $75k-100k, 2.2% for AGIs $100k-200k, 1.2% for AGIs over 200k)
Taxes paid: $9,564 (reported on 29.7% of returns)
12428:
$9,564
State:
$18,656
(% of AGI for various income ranges: 2.2% for AGIs below $25k, 3.6% for AGIs $25k-50k, 5.7% for AGIs $50k-75k, 7.7% for AGIs $75k-100k, 9.2% for AGIs $100k-200k, 11.4% for AGIs over 200k)
Earned income credit: $2,320 (reported on 28.5% of returns)
Here:
$2,320
State:
$2,230
(% of AGI for various income ranges: 9.4% for AGIs below $25k, 1.6% for AGIs $25k-50k)
Percentage of individuals using paid preparers for their 2012 taxes: 63.5%
Here:
63%
State:
66%
(% for various income ranges: 60.0% for AGIs below $25k, 60.0% for AGIs $25k-50k, 63.6% for AGIs $50k-75k, 73.7% for AGIs $75k-100k, 80.0% for AGIs $100k-200k, 100.0% for AGIs over 200k)
Averages for the 2004 tax year for zip code 12428, filed in 2005:
Average Adjusted Gross Income (AGI) in 2004: $39,505 (Individual Income Tax Returns)
Here:
$39,505
State:
$59,519
Salary/wage: $30,648 (reported on 85.4% of returns)
Here:
$30,648
State:
$50,673
(% of AGI for various income ranges: 96.7% for AGIs below $10k, 82.2% for AGIs $10k-25k, 82.1% for AGIs $25k-50k, 82.6% for AGIs $50k-75k, 79.0% for AGIs $75k-100k, 35.0% for AGIs over 100k)
Taxable interest for individuals: $1,543 (reported on 38.9% of returns)
This zip code:
$1,543
New York:
$2,377
(% of AGI for various income ranges: 3.2% for AGIs below $10k, 1.6% for AGIs $10k-25k, 1.4% for AGIs $25k-50k, 1.1% for AGIs $50k-75k, 1.0% for AGIs $75k-100k, 1.8% for AGIs over 100k)
Taxable dividends: $4,666 (reported on 18.2% of returns)
Here:
$4,666
State:
$5,394
(% of AGI for various income ranges: 4.1% for AGIs below $10k, 0.7% for AGIs $10k-25k, 1.0% for AGIs $25k-50k, 1.2% for AGIs $50k-75k, 1.1% for AGIs $75k-100k, 4.1% for AGIs over 100k)
Net capital gain/loss: +$23,727 (reported on 13.5% of returns)
Here:
+$23,727
State:
+$23,581
(% of AGI for various income ranges: -0.0% for AGIs below $10k, 0.2% for AGIs $10k-25k, 0.9% for AGIs $25k-50k, 0.6% for AGIs $50k-75k, 3.5% for AGIs $75k-100k, 21.7% for AGIs over 100k)
Profit/loss from business: +$6,446 (reported on 14.8% of returns)
Here:
+$6,446
State:
+$13,809
(% of AGI for various income ranges: 15.3% for AGIs below $10k, 3.7% for AGIs $10k-25k, 1.2% for AGIs $25k-50k, 1.7% for AGIs $50k-75k, 1.2% for AGIs $75k-100k, 2.4% for AGIs over 100k)
IRA payment deduction: $2,967 (reported on 2.3% of returns)
12428:
$2,967
New York:
$3,115
(% of AGI for various income ranges: 0.4% for AGIs $10k-25k, 0.3% for AGIs $25k-50k, 0.2% for AGIs $50k-75k, 0.2% for AGIs $75k-100k)
Total itemized deductions: $18,480 (22% of AGI, reported on 26.0% of returns)
Here:
$18,480
State:
$25,864
Here:
21.8% of AGI
State:
21.9% of AGI
(% of AGI for various income ranges: 6.8% for AGIs below $10k, 7.0% for AGIs $10k-25k, 16.4% for AGIs $25k-50k, 15.4% for AGIs $50k-75k, 17.0% for AGIs $75k-100k, 8.6% for AGIs over 100k)
Charity contributions deductions: $2,959 (3% of AGI, reported on 23.6% of returns)
Here:
$2,959
State:
$4,439
Here:
3.3% of AGI
State:
3.6% of AGI
(% of AGI for various income ranges: 0.6% for AGIs below $10k, 0.9% for AGIs $10k-25k, 1.4% for AGIs $25k-50k, 2.0% for AGIs $50k-75k, 2.1% for AGIs $75k-100k, 2.1% for AGIs over 100k)
Total tax: $5,848 (reported on 68.1% of returns)
12428:
$5,848
State:
$11,730
(% of AGI for various income ranges: 3.2% for AGIs below $10k, 3.4% for AGIs $10k-25k, 6.4% for AGIs $25k-50k, 8.5% for AGIs $50k-75k, 10.5% for AGIs $75k-100k, 16.1% for AGIs over 100k)
Earned income credit: $1,764 (reported on 24.9% of returns)
Here:
$1,764
State:
$1,757
Percentage of individuals using paid preparers for their 2004 taxes: 68.2%
Here:
68%
State:
67%
(% for various income ranges: 60.9% for AGIs below $10k, 66.5% for AGIs $10k-25k, 70.3% for AGIs $25k-50k, 75.6% for AGIs $50k-75k, 71.1% for AGIs $75k-100k, 84.2% for AGIs over 100k)
Likely homosexual households (counted as self-reported same-sex unmarried-partner households)
Lesbian couples: 0.2% of all households
Gay men: 0.5% of all households
Household received Food Stamps/SNAP in the past 12 months: 717 Household did not receive Food Stamps/SNAP in the past 12 months: 2,226
Women who had a birth in the past 12 months: 136 (134 now married, 0 unmarried) Women who did not have a birth in the past 12 months: 1,060 (337 now married, 725 unmarried)
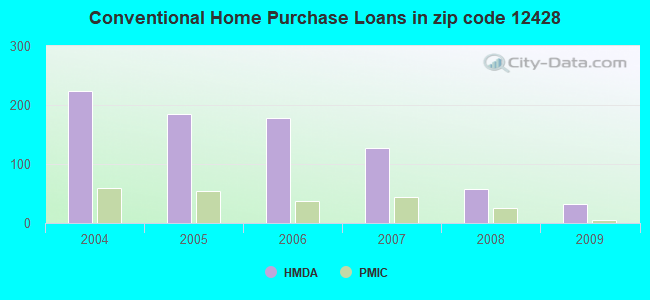
Housing units in zip code 12428 with a mortgage: 970 (40 second mortgage, 41 both second mortgage and home equity loan) Houses without a mortgage: 7
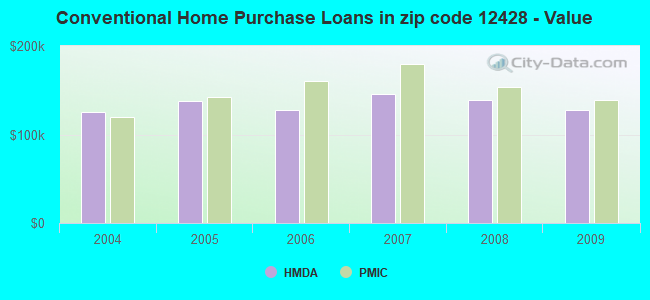
Median monthly owner costs for units with a mortgage: $1,798 Median monthly owner costs for units without a mortgage: $749
Residents with income below the poverty level in 2022:
This zip code:
24.3%
Whole state:
14.3%
Residents with income below 50% of the poverty level in 2022:
This zip code:
7.6%
Whole state:
6.8%
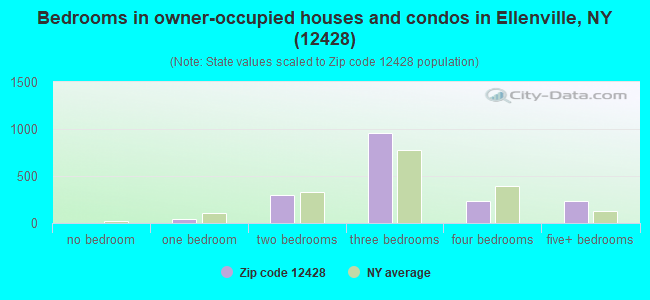
Median number of rooms in houses and condos:
Here:
6.1
State:
6.3
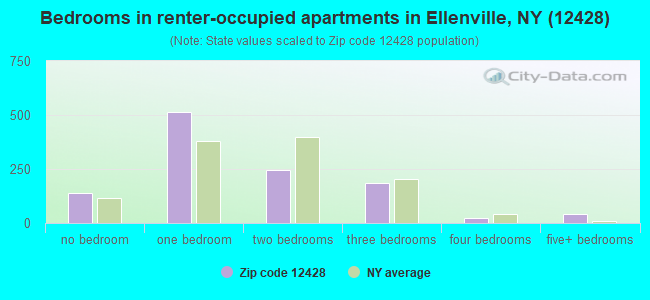
Median number of rooms in apartments:
Here:
3.4
State:
3.8
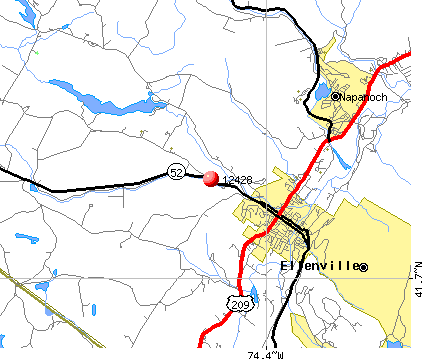
Notable locations in this zip code not listed on our city pages
Notable locations in zip code 12428: August Farm (A), Laughing Duck Farm (B), Rusty Plough Farm (C), Shawangunk Country Club (D), Sunrise Manor (E), Hunt Memorial Building (F), Pioneer Engine Company (G), Norbury Hall (H), Shadowland Theatre (I), Scoresby Hose Hook and Ladder Company (J), Kimble Hose Company Number 2 (K), Ellenville Public Library (L), Ellenville Museum (M). Display/hide their locations on the map
Churches in zip code 12428 include: Don Bosco Church (A), Ellenville Assembly of God (B), Praise Dominion Family Worship Center (C), Seventh Day Adventist Church (D), Saint Paul African Methodist Episcopal Zion Church (E), Ellenville United Methodist Church (F), Ellenville Reformed Church (G), Congregation Ezrath Israel (H), Congregation Anshe Tzaydik (I). Display/hide their locations on the map
Streams, rivers, and creeks: Fantine Kill (A), South Gully (B), Botsford Brook (C), Sandburg Creek (D), Beer Kill (E), Shingle Gully (F), North Gully (G). Display/hide their locations on the map
In group quarters: 409 (-1 institutionalized population)
Size of family households: 769 2-persons, 407 3-persons, 187 4-persons, 94 5-persons, 29 6-persons, 59 7-or-more-persons
Size of nonfamily households: 1,266 1-person, 118 2-persons
821 married couples with children.
412 single-parent households (24 men, 388 women).
79.7% of residents of 12428 zip code speak English at home.
15.9% of residents speak Spanish at home (83% very well, 2% well, 13% not well, 2% not at all).
3.8% of residents speak other Indo-European language at home (46% very well, 54% well).
0.4% of residents speak other language at home (100% very well).
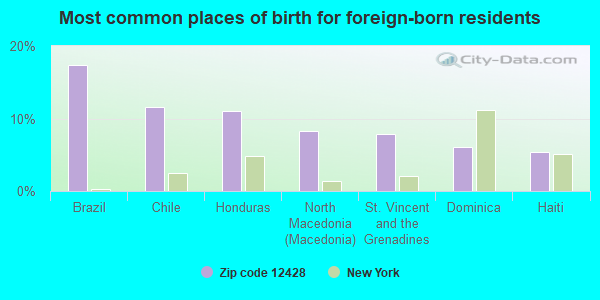
Foreign born population: 511 (7.4%) (77.3% of them are naturalized citizens)
This zip code:
7.4%
Whole state:
22.7%
17%Brazil
12%Chile
11%Honduras
8%North Macedonia (Macedonia)
8%St. Vincent and the Grenadines
6%Dominica
5%Haiti
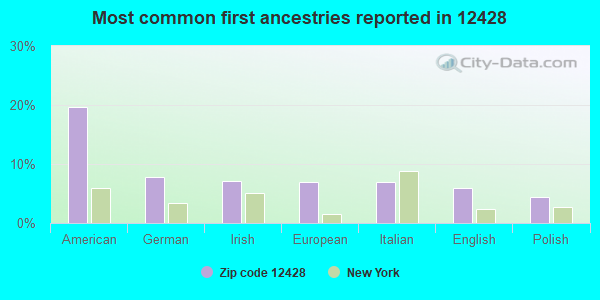
20%American
8%German
7%Irish
7%European
7%Italian
6%English
4%Polish
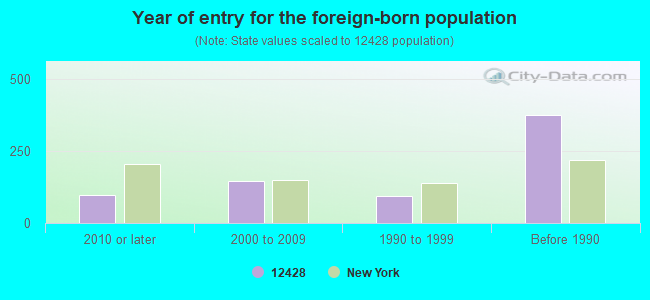
Year of entry for the foreign-born population
982010 or later
1452000 to 2009
941990 to 1999
374Before 1990
Facilities with environmental interests located in this zip code:
HYDRO ALUMINUM NORTH AMERICA INC (9 ALUMINUM DRIVE in ELLENVILLE, NY)
AIR MAJOR (AIRS/AFS) - ICIS-, ENFORCEMENT/COMPLIANCE ACTIVITY COMPLIANCE ACTIVITY (Tracking inspections of insecticide, fungicide, and rodenticide, and toxic substances) CRITERIA AND HAZARDOUS AIR POLLUTANT INVENTORY (Inventory of air pollution sources) National Pollutant Discharge Elimination System NON-MAJOR (Tracking pollutant discharge elimination systems) - permit HAZARDOUS WASTE BIENNIAL REPORTER (Resource Conservation and Recovery Act (tracking hazardous waste)) Large Quantity Generators, more that 1000 kg of hazardous waste/month (Resource Conservation and Recovery Act (tracking hazardous waste)) TRI REPORTER (Tracking of toxic chemicals releasing facilities) Business SIC classification: ALUMINUM EXTRUDED PRODUCTS Business NAICS classification: ALUMINUM EXTRUDED PRODUCT MANUFACTURING.; ALUMINUM EXTRUDED PRODUCT MANUFACTURING.; ALUMINUM FOUNDRIES (EXCEPT DIE-CASTING). Alternative names: HYDRO ALUMINUM N.A., V.A.W. AMERICA, VAW OF AMERICA INC
GETTY (WEST CANAL ST in ELLENVILLE, NY)
(Integrated Compliance Information System) - ICIS-02-1999-7503, FORMAL ENFORCEMENT ACTION Business SIC classification: GASOLINE SERVICE STATIONS
AERO TRANSPORTERS INCORPORATED (ROUTE 209 in ELLENVILLE, NY)
(Resource Conservation and Recovery Act (tracking hazardous waste)) Business NAICS classification: TRUCK TRAILER MANUFACTURING.
IMPERIAL SCHRADE CORPORATION (7 SCHRADE COURT in ELLENVILLE, NY)
AIR SYNTHETIC MINOR (AIRS/AFS) National Pollutant Discharge Elimination System MAJOR (Tracking pollutant discharge elimination systems) - permit Small Quantity Generators, between 100 kg and 1000 kg of hazardous waste/month (Resource Conservation and Recovery Act (tracking hazardous waste)) - notification TRI REPORTER (Tracking of toxic chemicals releasing facilities) Business SIC classification: CUTLERY; AIR AND WATER RESOURCE AND SOLID WASTE MANAGEMENT Organizations: AVNET, INC (CONTACT/OWNER)
Alternative names: AVNET, INC, IMPERIAL SCHRADE CORP., IMPERIAL SCHRADE COURT, IMPERIAL SHRADE
H M QUACKENBUSH ELLENVILLE PLT (7 CLINTON ST in ELLENVILLE, NY)
(Resource Conservation and Recovery Act (tracking hazardous waste)) Organizations: H M QUACKENBUSH INC (CONTACT/OWNER)
A T & T CORP (RTE 52 - 2.5 MI E CRAGSMONT in ELLENVILLE, NY)
(Resource Conservation and Recovery Act (tracking hazardous waste))
GETTY 58712 (W CANAL ST & RTE 52 in ELLENVILLE, NY)
Small Quantity Generators, between 100 kg and 1000 kg of hazardous waste/month (Resource Conservation and Recovery Act (tracking hazardous waste)) Organizations: GETTY PETROLUEM MARKETING INC (CONTACT/OWNER)
CITGO STATION (RTE 209 - 2 MI N OF RTE 52 in ELLENVILLE, NY)
(Resource Conservation and Recovery Act (tracking hazardous waste))
COLLIER MOTOR CAR CO INC THE (RTE 209 in ELLENVILLE, NY)
(Resource Conservation and Recovery Act (tracking hazardous waste))
APOCALYPSE INC (3 EDWARDS PL VACANT PROPERTY in ELLENVILLE, NY)
Conditionally Exempt Small Quantity Generators, less than 100 kg/month of hazardous waste (Resource Conservation and Recovery Act (tracking hazardous waste)) - notification Organizations: PREMIER NATIONAL BANK (CONTACT/OWNER)
Housing units lacking complete plumbing facilities: 8.1% Housing units lacking complete kitchen facilities: 5.4%
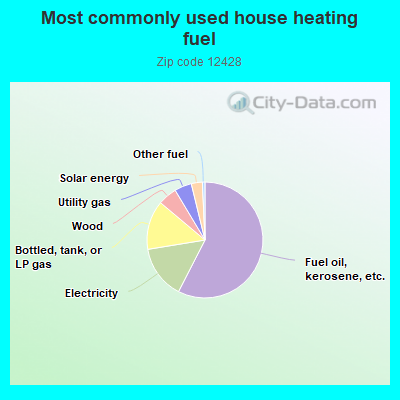
57.6%Fuel oil, kerosene, etc.
14.9%Electricity
13.7%Bottled, tank, or LP gas
5.3%Wood
4.8%Utility gas
3.1%Solar energy
0.7%Other fuel
Population in 1990: 6,902. Population change in the 1990s: +1,465 (+21.2%).
Place of birth for U.S.-born residents:
This state: 5,375
Northeast: 298
Midwest: 121
South: 295
West: 81
53% of the 12428 zip code residents lived in the same house 5 years ago. Out of people who lived in different houses, 39% lived in this county. Out of people who lived in different counties, 50% lived in New York.
87% of the 12428 zip code residents lived in the same house 1 year ago. Out of people who lived in different houses, 39% moved from this county. Out of people who lived in different houses, 50% moved from different county within same state. Out of people who lived in different houses, 11% moved from different state.
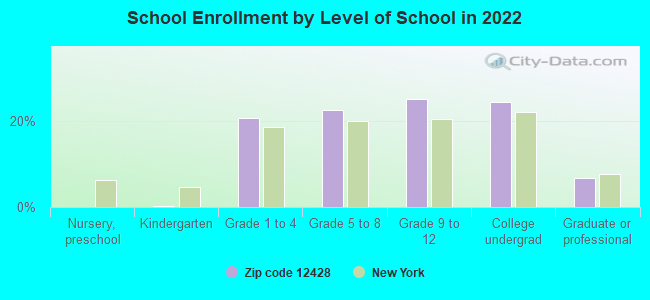
Private vs. public school enrollment:
Students in private schools in grades 1 to 8 (elementary and middle school): 7
Here:
0.9%
New York:
15.6%
Students in private schools in grades 9 to 12 (high school): 19
Here:
4.4%
New York:
15.0%
Students in private undergraduate colleges: 15
Here:
3.7%
New York:
39.2%
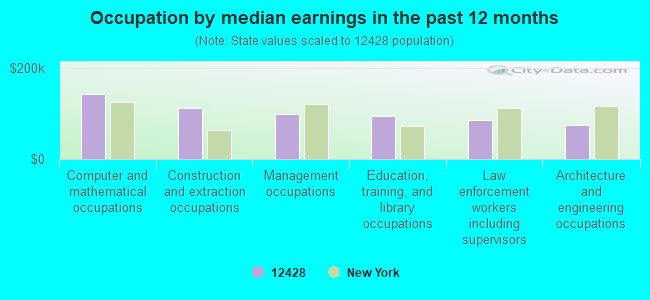
Occupation by median earnings in the past 12 months ($)
143,255Computer and mathematical occupations
112,836Construction and extraction occupations
99,382Management occupations
94,568Education, training, and library occupations
85,286Law enforcement workers including supervisors
75,575Architecture and engineering occupations
Companies with federal contracts located in this zip code:
ELLENVILLE REGIONAL HOSPITAL (RR 209 in ELLENVILLE, NY) 200 employees, $3921888 revenue: $56,317 in 11 contractsfrom 1999 to 2003
Contracts for General Health Care Services by Bureau of Prisoners/Federal Prison System Signed by year:2000: $6,000; 2001: $11,000; 2002: $24,920; 2003: $7,397; 2004: $0; 2005: $0; 2006: $0.
Biggest contracts:
$21,220 with Bureau of Prisoners/Federal Prison System for General Health Care Services. Signed on 2002-12-15. Completion date: 2002-12-15.
$7,397, same as above.Signed on 2003-06-15. Completion date: 2003-12-15.
$7,000, same as above.Signed on 2001-12-15. Completion date: 2001-12-15.
$4,000, same as above.Signed on 2001-12-15. Completion date: 2002-12-15.
Top industries in this zip code by the number of employees in 2005:
Accommodation and Food Services: Hotels (except Casino Hotels) and Motels (500-999 employees: 1 establishment, 1-4 employees: 4 establishments)
Health Care and Social Assistance: All Other Outpatient Care Centers (100-249: 1)
2002 - 2018 National Fire Incident Reporting System (NFIRS) incidents
Based on the data from the years 2002 - 2018 the average number of fire incidents per year is 41. The highest number of fire incidents - 80 took place in 2006, and the least - 0 in 2005. The data has a rising trend.
When looking into fire subcategories, the most incidents belonged to: Structure Fires (64.7%), and Outside Fires (21.1%).
Fire incident types reported to NFIRS in Zip Code 12428
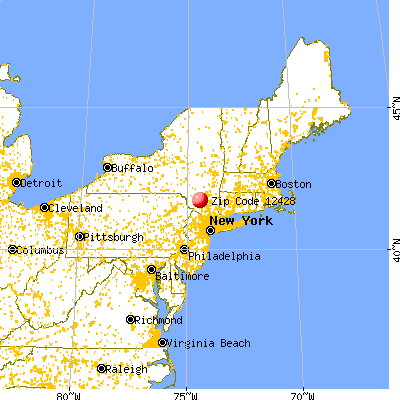


 Nearest zip codes: 12435, 12483, 12458, 12769, 12489, 12763.
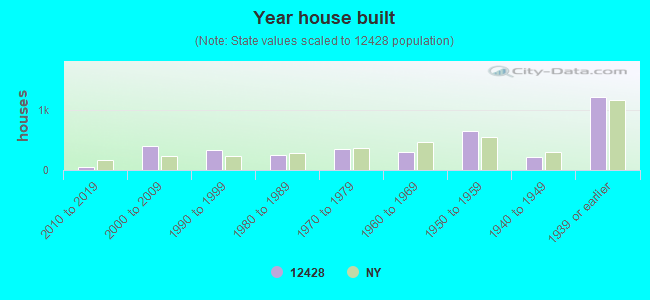


 Based on the data from the years 2002 - 2018 the average number of fire incidents per year is 41. The highest number of fire incidents - 80 took place in 2006, and the least - 0 in 2005. The data has a rising trend.
 When looking into fire subcategories, the most incidents belonged to: Structure Fires (64.7%), and Outside Fires (21.1%).