Estimated zip code population in 2022: 3,445 Zip code population in 2010: 3,232 Zip code population in 2000: 2,243
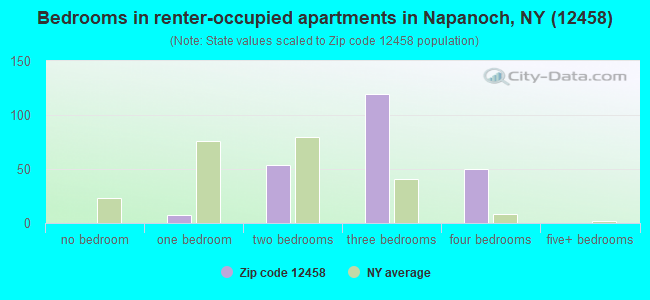
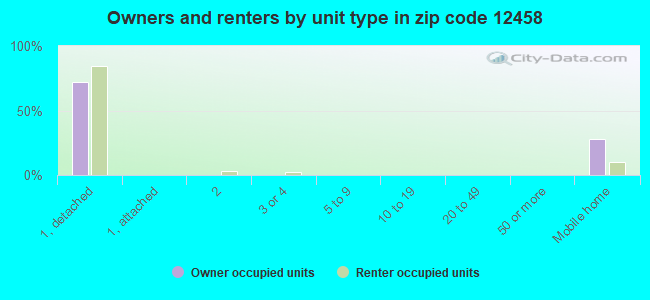
Houses and condos: 1,119 Renter-occupied apartments: 232
% of renters here:
24%
State:
46%
March 2022 cost of living index in zip code 12458: 110.0 (more than average, U.S. average is 100)
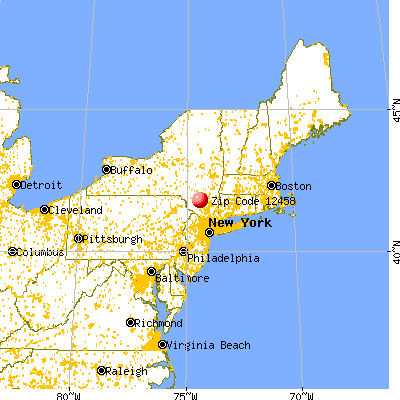
Land area: 32.3 sq. mi. Water area: 0.1 sq. mi.
Population density: 107 people per square mile
(very low).
OSM Map
General Map
Google Map
MSN Map
OSM Map
General Map
Google Map
MSN Map
OSM Map
General Map
Google Map
MSN Map
OSM Map
General Map
Google Map
MSN Map
Please wait while loading the map...
Real estate property taxes paid for housing units in 2022:
This zip code:
1.5% ($2,647)
New York:
1.5% ($6,180)
Median real estate property taxes paid for housing units with mortgages in 2022: $3,775 (1.8%) Median real estate property taxes paid for housing units with no mortgage in 2022: $2,014 (1.2%)
Business Search- 14 Million verified businesses
Males: 2,452
(71.2%)
Females: 993
(28.8%)
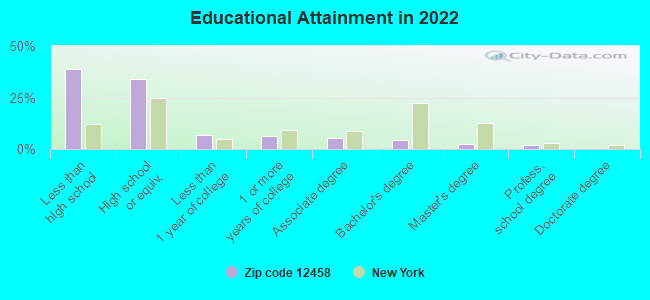
For population 25 years and over in 12458:
High school or higher: 59.1%
Bachelor's degree or higher: 8.5%
Graduate or professional degree: 4.1%
Unemployed: 1.6%
Mean travel time to work (commute): 39.3 minutes
For population 15 years and over in 12458:
Never married: 36.4%
Now married: 48.1%
Separated: 3.1%
Widowed: 4.1%
Divorced: 8.3%
Zip code 12458 compared to state average:
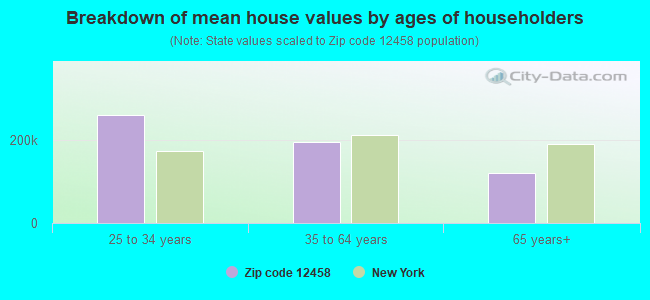
Median house value below state average.
Unemployed percentage significantly below state average.
Median age significantly above state average.
Foreign-born population percentage significantly below state average.
Renting percentage below state average.
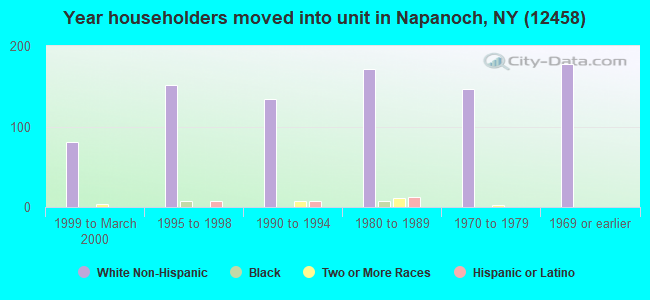
Length of stay since moving in significantly above state average.
Percentage of population with a bachelor's degree or higher significantly below state average.
Averages for the 2020 tax year for zip code 12458, filed in 2021:
Average Adjusted Gross Income (AGI) in 2020: $50,568 (Individual Income Tax Returns)
Here:
$50,568
State:
$90,930
Salary/wage: $48,762 (reported on 74.8% of returns)
Here:
$48,762
State:
$72,104
(% of AGI for various income ranges: 964.0% for AGIs below $25k, 3315.4% for AGIs $25k-50k, 6110.7% for AGIs $50k-75k, 8025.0% for AGIs $75k-100k, 18856.0% for AGIs $100k-200k)
Taxable interest for individuals: $338 (reported on 34.1% of returns)
This zip code:
$338
New York:
$3,075
(% of AGI for various income ranges: 8.8% for AGIs below $25k, 20.4% for AGIs $25k-50k, 12.9% for AGIs $50k-75k, 18.8% for AGIs $75k-100k, 34.0% for AGIs $100k-200k)
Ordinary dividends: $1,627 (reported on 12.2% of returns)
Here:
$1,627
State:
$11,095
(% of AGI for various income ranges: 11.6% for AGIs below $25k, 29.2% for AGIs $25k-50k, 27.9% for AGIs $50k-75k, 32.5% for AGIs $75k-100k, 74.0% for AGIs $100k-200k)
Net capital gain/loss in AGI: +$3,480 (reported on 8.1% of returns)
Here:
+$3,480
State:
+$44,925
(% of AGI for various income ranges: 5.0% for AGIs $25k-50k, 18.6% for AGIs $50k-75k, 315.0% for AGIs $100k-200k)
Profit/loss from business: +$5,780 (reported on 8.1% of returns)
Here:
+$5,780
State:
+$14,940
(% of AGI for various income ranges: 127.2% for AGIs below $25k, 103.8% for AGIs $25k-50k)
Taxable individual retirement arrangement distribution: $9,322 (reported on 7.3% of returns)
12458:
$9,322
New York:
$19,609
(% of AGI for various income ranges: 114.8% for AGIs below $25k, 200.0% for AGIs $50k-75k, 340.0% for AGIs $75k-100k)
Total itemized deductions: $19,840 (reported on 4.1% of returns)
Here:
$19,840
State:
$39,326
(% of AGI for various income ranges: 342.1% for AGIs $50k-75k, 513.0% for AGIs $100k-200k)
Charity contributions: $2,975 (reported on 3.3% of returns)
Here:
$2,975
State:
$15,420
(% of AGI for various income ranges: 119.0% for AGIs $100k-200k)
Taxes paid: $8,640 (reported on 4.1% of returns)
12458:
$8,640
State:
$9,183
(% of AGI for various income ranges: 162.9% for AGIs $50k-75k, 204.0% for AGIs $100k-200k)
Earned income credit: $1,794 (reported on 14.6% of returns)
Here:
$1,794
State:
$2,138
(% of AGI for various income ranges: 70.0% for AGIs below $25k, 56.9% for AGIs $25k-50k)
Percentage of individuals using paid preparers for their 2020 taxes: 82.9%
Here:
83%
State:
95%
(% for various income ranges: 68.9% for AGIs below $25k, 90.6% for AGIs $25k-50k, 89.5% for AGIs $50k-75k, 90.9% for AGIs $75k-100k, 93.8% for AGIs $100k-200k)
Averages for the 2012 tax year for zip code 12458, filed in 2013:
Average Adjusted Gross Income (AGI) in 2012: $44,847 (Individual Income Tax Returns)
Here:
$44,847
State:
$77,088
Salary/wage: $40,888 (reported on 79.2% of returns)
Here:
$40,888
State:
$60,593
(% of AGI for various income ranges: 65.1% for AGIs below $25k, 78.3% for AGIs $25k-50k, 69.6% for AGIs $50k-75k, 77.1% for AGIs $75k-100k, 69.2% for AGIs $100k-200k)
Taxable interest for individuals: $753 (reported on 35.8% of returns)
This zip code:
$753
New York:
$3,125
(% of AGI for various income ranges: 1.2% for AGIs below $25k, 1.3% for AGIs $25k-50k, 0.6% for AGIs $50k-75k, 0.1% for AGIs $75k-100k, 0.1% for AGIs $100k-200k)
Ordinary dividends: $1,565 (reported on 16.0% of returns)
Here:
$1,565
State:
$10,299
(% of AGI for various income ranges: 0.4% for AGIs below $25k, 1.0% for AGIs $25k-50k, 1.0% for AGIs $50k-75k, 0.3% for AGIs $100k-200k)
Net capital gain/loss in AGI: +$11,400 (reported on 8.5% of returns)
Here:
+$11,400
State:
+$42,474
(% of AGI for various income ranges: 0.7% for AGIs $50k-75k, 11.5% for AGIs $75k-100k)
Profit/loss from business: +$4,454 (reported on 12.3% of returns)
Here:
+$4,454
State:
+$16,168
(% of AGI for various income ranges: 8.3% for AGIs below $25k, 1.3% for AGIs $25k-50k, 0.2% for AGIs $75k-100k)
Taxable individual retirement arrangement distribution: $7,520 (reported on 9.4% of returns)
12458:
$7,520
New York:
$17,621
(% of AGI for various income ranges: 3.0% for AGIs below $25k, 2.1% for AGIs $25k-50k, 3.7% for AGIs $50k-75k)
Total itemized deductions: $17,650 (22% of AGI, reported on 26.4% of returns)
Here:
$17,650
State:
$34,985
Here:
22.4% of AGI
State:
21.3% of AGI
(% of AGI for various income ranges: 10.1% for AGIs $25k-50k, 11.1% for AGIs $50k-75k, 12.2% for AGIs $75k-100k, 12.9% for AGIs $100k-200k)
Charity contributions: $1,950 (reported on 20.8% of returns)
Here:
$1,950
State:
$5,572
(% of AGI for various income ranges: 1.1% for AGIs $25k-50k, 1.0% for AGIs $50k-75k, 0.6% for AGIs $75k-100k, 1.2% for AGIs $100k-200k)
Taxes paid: $7,264 (reported on 26.4% of returns)
12458:
$7,264
State:
$18,656
(% of AGI for various income ranges: 3.0% for AGIs $25k-50k, 4.3% for AGIs $50k-75k, 5.4% for AGIs $75k-100k, 6.2% for AGIs $100k-200k)
Earned income credit: $2,221 (reported on 17.9% of returns)
Here:
$2,221
State:
$2,230
(% of AGI for various income ranges: 6.0% for AGIs below $25k, 1.1% for AGIs $25k-50k)
Percentage of individuals using paid preparers for their 2012 taxes: 62.3%
Here:
62%
State:
66%
(% for various income ranges: 50.0% for AGIs below $25k, 62.1% for AGIs $25k-50k, 81.2% for AGIs $50k-75k, 70.0% for AGIs $75k-100k, 77.8% for AGIs $100k-200k)
Averages for the 2004 tax year for zip code 12458, filed in 2005:
Average Adjusted Gross Income (AGI) in 2004: $35,119 (Individual Income Tax Returns)
Here:
$35,119
State:
$59,519
Salary/wage: $32,555 (reported on 83.3% of returns)
Here:
$32,555
State:
$50,673
(% of AGI for various income ranges: 82.1% for AGIs below $10k, 74.3% for AGIs $10k-25k, 79.8% for AGIs $25k-50k, 77.8% for AGIs $50k-75k, 85.0% for AGIs $75k-100k, 61.8% for AGIs over 100k)
Taxable interest for individuals: $1,193 (reported on 43.8% of returns)
This zip code:
$1,193
New York:
$2,377
(% of AGI for various income ranges: 4.1% for AGIs below $10k, 2.0% for AGIs $10k-25k, 1.3% for AGIs $25k-50k, 2.0% for AGIs $50k-75k, 0.7% for AGIs $75k-100k, 0.8% for AGIs over 100k)
Taxable dividends: $1,021 (reported on 16.7% of returns)
Here:
$1,021
State:
$5,394
(% of AGI for various income ranges: 1.2% for AGIs below $10k, 0.4% for AGIs $10k-25k, 0.6% for AGIs $25k-50k, 0.6% for AGIs $50k-75k, 0.1% for AGIs $75k-100k, 0.5% for AGIs over 100k)
Net capital gain/loss: +$7,958 (reported on 10.2% of returns)
Here:
+$7,958
State:
+$23,581
(% of AGI for various income ranges: -1.3% for AGIs below $10k, 0.2% for AGIs $10k-25k, 0.0% for AGIs $25k-50k, -0.1% for AGIs $50k-75k, 18.1% for AGIs over 100k)
Profit/loss from business: +$4,533 (reported on 14.1% of returns)
Here:
+$4,533
State:
+$13,809
(% of AGI for various income ranges: 10.6% for AGIs below $10k, 4.8% for AGIs $10k-25k, 1.5% for AGIs $25k-50k, 0.7% for AGIs $50k-75k, 1.8% for AGIs $75k-100k)
IRA payment deduction: $2,667 (reported on 1.5% of returns)
12458:
$2,667
New York:
$3,115
Total itemized deductions: $16,701 (27% of AGI, reported on 25.1% of returns)
Here:
$16,701
State:
$25,864
Here:
27.3% of AGI
State:
21.9% of AGI
(% of AGI for various income ranges: 11.3% for AGIs $10k-25k, 9.4% for AGIs $25k-50k, 13.8% for AGIs $50k-75k, 15.9% for AGIs $75k-100k, 12.1% for AGIs over 100k)
Charity contributions deductions: $1,915 (3% of AGI, reported on 22.1% of returns)
Here:
$1,915
State:
$4,439
Here:
3.0% of AGI
State:
3.6% of AGI
(% of AGI for various income ranges: 0.7% for AGIs $10k-25k, 0.9% for AGIs $25k-50k, 1.6% for AGIs $50k-75k, 1.6% for AGIs $75k-100k, 1.5% for AGIs over 100k)
Total tax: $4,169 (reported on 72.7% of returns)
12458:
$4,169
State:
$11,730
(% of AGI for various income ranges: 2.8% for AGIs below $10k, 3.8% for AGIs $10k-25k, 7.0% for AGIs $25k-50k, 8.9% for AGIs $50k-75k, 10.4% for AGIs $75k-100k, 15.2% for AGIs over 100k)
Earned income credit: $1,742 (reported on 20.5% of returns)
Here:
$1,742
State:
$1,757
Percentage of individuals using paid preparers for their 2004 taxes: 64.5%
Here:
64%
State:
67%
(% for various income ranges: 55.1% for AGIs below $10k, 61.4% for AGIs $10k-25k, 67.1% for AGIs $25k-50k, 69.0% for AGIs $50k-75k, 79.0% for AGIs $75k-100k, 76.3% for AGIs over 100k)
Household received Food Stamps/SNAP in the past 12 months: 67 Household did not receive Food Stamps/SNAP in the past 12 months: 891
Women who did not have a birth in the past 12 months: 307 (173 now married, 130 unmarried)
Housing units in zip code 12458 with a mortgage: 224 (7 second mortgage, 7 both second mortgage and home equity loan) Median monthly owner costs for units with a mortgage: $1,562 Median monthly owner costs for units without a mortgage: $609
Residents with income below the poverty level in 2022:
This zip code:
15.8%
Whole state:
14.3%
Residents with income below 50% of the poverty level in 2022:
This zip code:
14.8%
Whole state:
6.8%
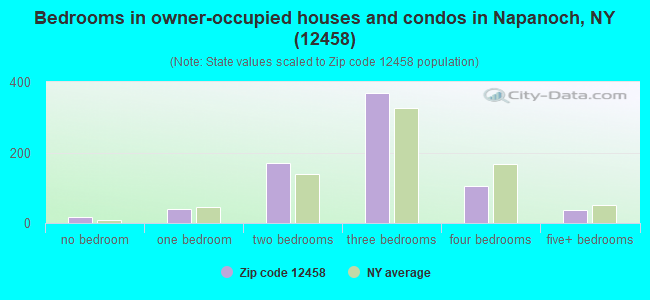
Median number of rooms in houses and condos:
Here:
6.3
State:
6.3
Median number of rooms in apartments:
Here:
5.5
State:
3.8
Notable locations in this zip code not listed on our city pages
In group quarters: 1,338 (-1 institutionalized population)
Size of family households: 245 2-persons, 180 3-persons, 122 4-persons, 12 5-persons
Size of nonfamily households: 349 1-person, 60 2-persons
154 married couples with children.
72 single-parent households (44 men, 28 women).
85.1% of residents of 12458 zip code speak English at home.
11.6% of residents speak Spanish at home (80% very well, 14% well, 6% not well).
2.4% of residents speak other Indo-European language at home (79% very well, 21% well).
0.6% of residents speak other language at home (58% very well, 42% well).
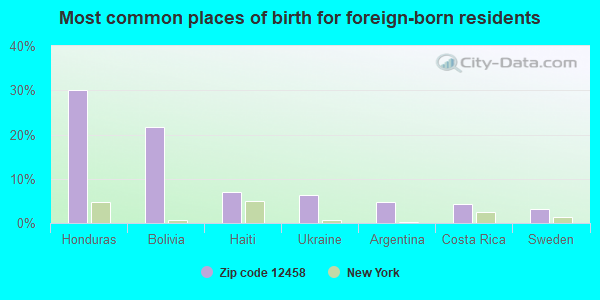
Foreign born population: 251 (7.3%) (48.6% of them are naturalized citizens)
This zip code:
7.3%
Whole state:
22.7%
30%Honduras
22%Bolivia
7%Haiti
6%Ukraine
5%Argentina
4%Costa Rica
3%Sweden
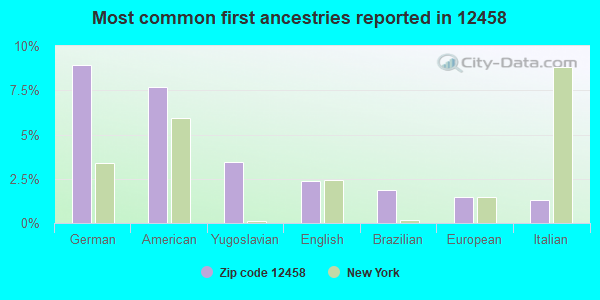
9%German
8%American
3%Yugoslavian
2%English
2%Brazilian
1%European
1%Italian
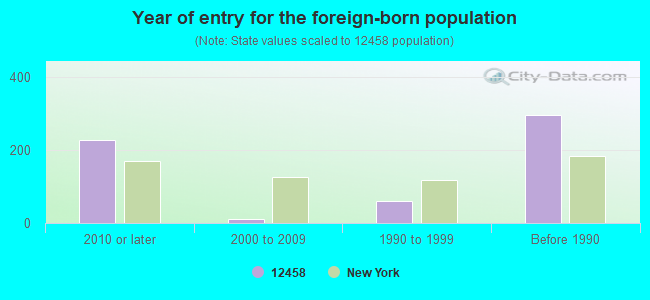
Year of entry for the foreign-born population
2282010 or later
122000 to 2009
601990 to 1999
296Before 1990
Facilities with environmental interests located in this zip code:
EASTERN CORR FACIL ( in NAPANOCH, NY)
(National Center for Education Statistics) - STATE ID-622002968150 Organizations: ELLENVILLE CSD (SCHOOL DISTRICT)
CENTRAL HUDSON GAS & ELECTRIC - NAPANOCH (0.25 MI E OF PLANK RD & in NAPANOCH, NY)
(Resource Conservation and Recovery Act (tracking hazardous waste))
Housing units lacking complete plumbing facilities: 3.0% Housing units lacking complete kitchen facilities: 3.0%
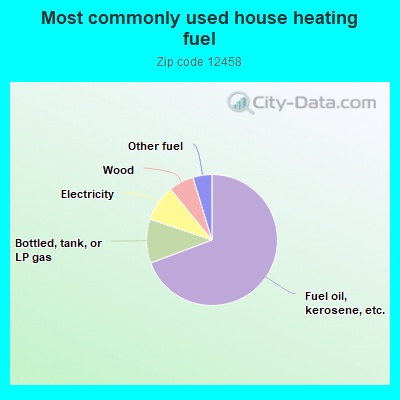
69.5%Fuel oil, kerosene, etc.
10.9%Bottled, tank, or LP gas
9.0%Electricity
6.2%Wood
4.7%Other fuel
Population in 1990: 3,502.
Place of birth for U.S.-born residents:
This state: 2,377
Northeast: 326
Midwest: 30
South: 81
West: 37
75% of the 12458 zip code residents lived in the same house 5 years ago. Out of people who lived in different houses, 70% lived in this county. Out of people who lived in different counties, 50% lived in New York.
84% of the 12458 zip code residents lived in the same house 1 year ago. Out of people who lived in different houses, 21% moved from this county. Out of people who lived in different houses, 80% moved from different county within same state.
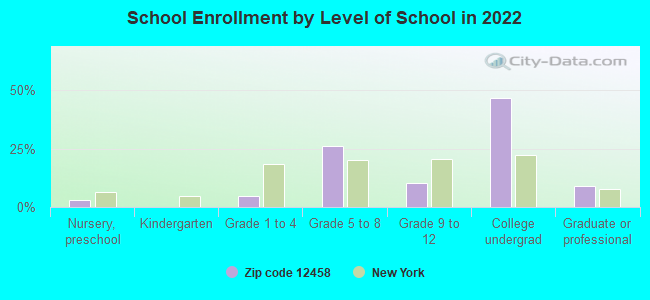
Private vs. public school enrollment:
Students in private schools in grades 1 to 8 (elementary and middle school): 51
Here:
37.1%
New York:
15.6%
Students in private schools in grades 9 to 12 (high school):
Here:
0.0%
New York:
15.0%
Students in private undergraduate colleges: 100
Here:
47.6%
New York:
39.2%
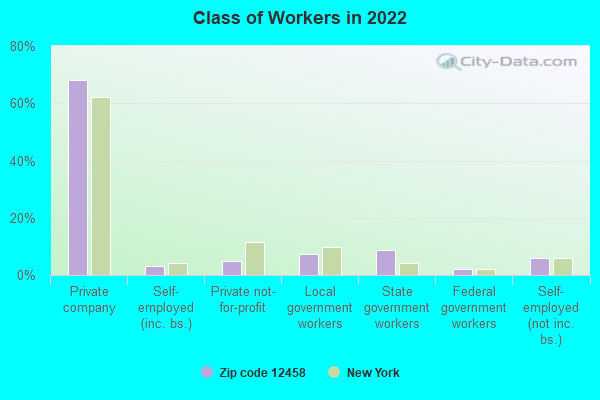
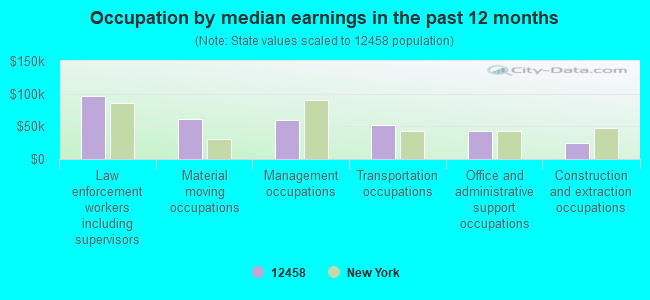
Occupation by median earnings in the past 12 months ($)
97,147Law enforcement workers including supervisors
61,000Material moving occupations
60,136Management occupations
52,181Transportation occupations
43,458Office and administrative support occupations
25,122Construction and extraction occupations
Top industries in this zip code by the number of employees in 2005:
Health Care and Social Assistance: Residential Mental Retardation Facilities (10-19 employees: 1 establishment)
Finance and Insurance: Credit Unions (10-19: 1)
Health Care and Social Assistance: Child Day Care Services (10-19: 1)
Mining: Construction Sand and Gravel Mining (1-4: 2)
Other Services (except Public Administration): Civic and Social Organizations (1-4: 1)
Health Care and Social Assistance: Freestanding Ambulatory Surgical and Emergency Centers (1-4: 1)
Accommodation and Food Services: Full-Service Restaurants (1-4: 1)
Construction: Residential Remodelers (1-4: 1)
People in group quarters in 2010:
1,002 people in state prisons
Fatal accident statistics in 2010:
Fatal accident count: 1
Vehicles involved in fatal accidents: 1
Fatal accidents caused by drunken drivers: 0
Fatalities: 1
Persons involved in fatal accidents: 1
Pedestrians involved in fatal accidents: 0
Home Mortgage Disclosure Act Aggregated Statistics For Year 2009 (Based on 6 partial tracts)
A) FHA, FSA/RHS & VA Home Purchase Loans
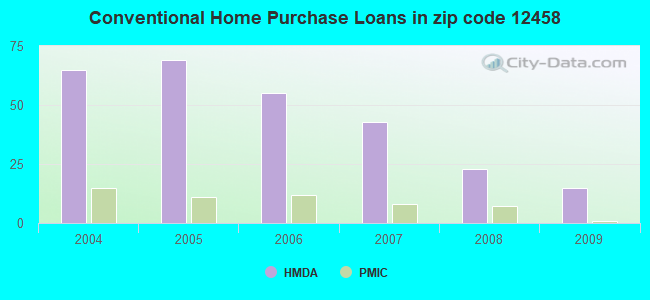
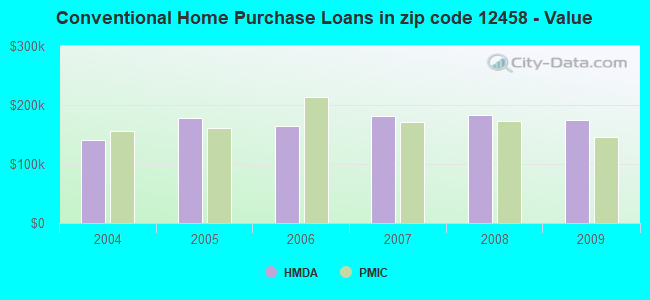
B) Conventional Home Purchase Loans
C) Refinancings
D) Home Improvement Loans
F) Non-occupant Loans on < 5 Family Dwellings (A B C & D)
G) Loans On Manufactured Home Dwelling (A B C & D)
Number
Average Value
Number
Average Value
Number
Average Value
Number
Average Value
Number
Average Value
Number
Average Value
LOANS ORIGINATED
8
$148,924
15
$174,609
34
$165,312
7
$48,649
9
$189,988
1
$112,930
APPLICATIONS APPROVED, NOT ACCEPTED
0
$0
2
$352,880
6
$199,260
1
$12,310
2
$155,455
1
$56,070
APPLICATIONS DENIED
0
$0
5
$180,422
24
$173,976
9
$42,531
5
$204,056
3
$81,083
APPLICATIONS WITHDRAWN
2
$154,150
1
$68,130
17
$141,988
3
$72,580
1
$56,050
1
$66,900
FILES CLOSED FOR INCOMPLETENESS
0
$0
0
$0
3
$225,813
0
$0
0
$0
0
$0
Aggregated Statistics For Year 2008 (Based on 6 partial tracts)
A) FHA, FSA/RHS & VA Home Purchase Loans
B) Conventional Home Purchase Loans
C) Refinancings
D) Home Improvement Loans
F) Non-occupant Loans on < 5 Family Dwellings (A B C & D)
G) Loans On Manufactured Home Dwelling (A B C & D)
Number
Average Value
Number
Average Value
Number
Average Value
Number
Average Value
Number
Average Value
Number
Average Value
LOANS ORIGINATED
6
$173,173
23
$183,281
37
$159,865
11
$88,934
10
$208,965
3
$82,753
APPLICATIONS APPROVED, NOT ACCEPTED
0
$0
2
$84,605
6
$198,053
3
$26,107
0
$0
1
$40,410
APPLICATIONS DENIED
1
$70,650
9
$93,991
43
$165,629
11
$70,310
5
$205,402
9
$69,813
APPLICATIONS WITHDRAWN
1
$56,560
4
$130,712
15
$198,829
1
$137,380
2
$348,890
1
$77,600
FILES CLOSED FOR INCOMPLETENESS
0
$0
0
$0
4
$232,250
0
$0
0
$0
0
$0
Aggregated Statistics For Year 2007 (Based on 6 partial tracts)
A) FHA, FSA/RHS & VA Home Purchase Loans
B) Conventional Home Purchase Loans
C) Refinancings
D) Home Improvement Loans
E) Loans on Dwellings For 5+ Families
F) Non-occupant Loans on < 5 Family Dwellings (A B C & D)
G) Loans On Manufactured Home Dwelling (A B C & D)
Number
Average Value
Number
Average Value
Number
Average Value
Number
Average Value
Number
Average Value
Number
Average Value
Number
Average Value
LOANS ORIGINATED
2
$185,430
43
$181,401
54
$175,519
18
$71,171
1
$338,280
11
$288,374
4
$112,860
APPLICATIONS APPROVED, NOT ACCEPTED
0
$0
5
$129,408
14
$177,762
3
$32,933
0
$0
1
$64,760
2
$68,240
APPLICATIONS DENIED
0
$0
18
$134,251
63
$162,252
25
$83,360
1
$317,240
5
$174,364
10
$63,579
APPLICATIONS WITHDRAWN
1
$169,670
5
$216,802
29
$161,254
3
$69,773
0
$0
1
$331,110
0
$0
FILES CLOSED FOR INCOMPLETENESS
0
$0
1
$86,490
7
$196,493
1
$177,790
0
$0
0
$0
0
$0
Aggregated Statistics For Year 2006 (Based on 6 partial tracts)
A) FHA, FSA/RHS & VA Home Purchase Loans
B) Conventional Home Purchase Loans
C) Refinancings
D) Home Improvement Loans
E) Loans on Dwellings For 5+ Families
F) Non-occupant Loans on < 5 Family Dwellings (A B C & D)
G) Loans On Manufactured Home Dwelling (A B C & D)
Number
Average Value
Number
Average Value
Number
Average Value
Number
Average Value
Number
Average Value
Number
Average Value
Number
Average Value
LOANS ORIGINATED
2
$180,640
55
$165,080
76
$147,257
21
$68,627
1
$166,250
15
$187,321
6
$86,432
APPLICATIONS APPROVED, NOT ACCEPTED
0
$0
12
$154,741
22
$141,463
6
$53,772
1
$18,130
3
$110,287
1
$154,670
APPLICATIONS DENIED
1
$110,070
29
$111,951
74
$164,600
25
$51,743
1
$177,410
6
$91,713
9
$57,889
APPLICATIONS WITHDRAWN
2
$129,955
12
$137,355
41
$147,750
3
$141,923
1
$108,670
3
$141,343
2
$128,075
FILES CLOSED FOR INCOMPLETENESS
0
$0
3
$94,020
11
$166,295
1
$119,430
0
$0
2
$107,860
1
$56,070
Aggregated Statistics For Year 2005 (Based on 6 partial tracts)
A) FHA, FSA/RHS & VA Home Purchase Loans
B) Conventional Home Purchase Loans
C) Refinancings
D) Home Improvement Loans
E) Loans on Dwellings For 5+ Families
F) Non-occupant Loans on < 5 Family Dwellings (A B C & D)
G) Loans On Manufactured Home Dwelling (A B C & D)
Number
Average Value
Number
Average Value
Number
Average Value
Number
Average Value
Number
Average Value
Number
Average Value
Number
Average Value
LOANS ORIGINATED
2
$193,775
69
$178,474
85
$145,191
19
$82,808
2
$145,685
16
$235,394
4
$108,180
APPLICATIONS APPROVED, NOT ACCEPTED
0
$0
8
$117,838
21
$134,339
2
$33,845
0
$0
3
$158,140
3
$50,717
APPLICATIONS DENIED
1
$99,850
25
$130,273
68
$140,207
27
$54,698
0
$0
8
$163,466
15
$51,202
APPLICATIONS WITHDRAWN
0
$0
13
$141,855
55
$142,064
9
$161,086
0
$0
2
$130,465
1
$79,140
FILES CLOSED FOR INCOMPLETENESS
0
$0
2
$218,385
20
$162,999
1
$80,280
0
$0
0
$0
0
$0
Aggregated Statistics For Year 2004 (Based on 6 partial tracts)
A) FHA, FSA/RHS & VA Home Purchase Loans
B) Conventional Home Purchase Loans
C) Refinancings
D) Home Improvement Loans
E) Loans on Dwellings For 5+ Families
F) Non-occupant Loans on < 5 Family Dwellings (A B C & D)
G) Loans On Manufactured Home Dwelling (A B C & D)
2002 - 2018 National Fire Incident Reporting System (NFIRS) incidents
According to the data from the years 2002 - 2018 the average number of fire incidents per year is 15. The highest number of fires - 27 took place in 2008, and the least - 1 in 2010. The data has a dropping trend.
When looking into fire subcategories, the most incidents belonged to: Structure Fires (53.4%), and Outside Fires (29.4%).
Fire incident types reported to NFIRS in Zip Code 12458


 Nearest zip codes: 12428, 12489, 12446, 12740, 12435, 12483.


 According to the data from the years 2002 - 2018 the average number of fire incidents per year is 15. The highest number of fires - 27 took place in 2008, and the least - 1 in 2010. The data has a dropping trend.
 When looking into fire subcategories, the most incidents belonged to: Structure Fires (53.4%), and Outside Fires (29.4%).