Estimated zip code population in 2022: 5,768 Zip code population in 2010: 5,870 Zip code population in 2000: 6,276
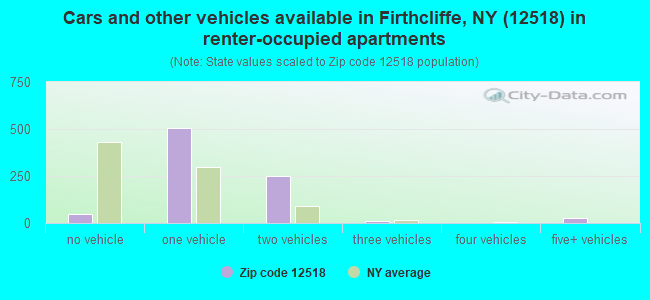
Houses and condos: 2,529 Renter-occupied apartments: 844
% of renters here:
36%
State:
46%
March 2022 cost of living index in zip code 12518: 134.1 (high, U.S. average is 100)
Land area: 9.9 sq. mi. Water area: 0.1 sq. mi.
Population density: 584 people per square mile
(low).
OSM Map
General Map
Google Map
MSN Map
OSM Map
General Map
Google Map
MSN Map
OSM Map
General Map
Google Map
MSN Map
OSM Map
General Map
Google Map
MSN Map
Please wait while loading the map...
Real estate property taxes paid for housing units in 2022:
This zip code:
2.5% ($9,140)
New York:
1.5% ($6,180)
Median real estate property taxes paid for housing units with mortgages in 2022: $9,723 (2.4%) Median real estate property taxes paid for housing units with no mortgage in 2022: $7,682 (2.5%)
Business Search- 14 Million verified businesses
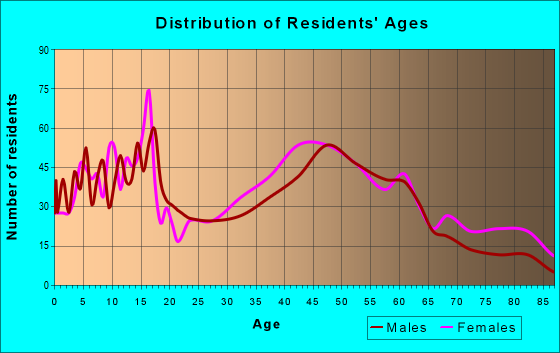
Males: 2,798
(48.5%)
Females: 2,969
(51.5%)
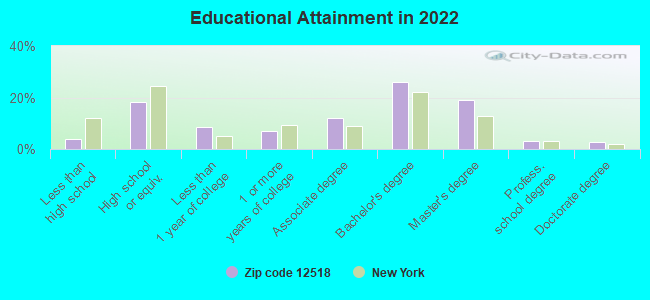
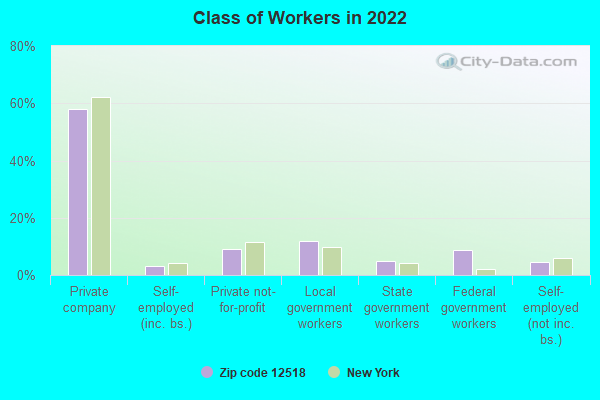
For population 25 years and over in 12518:
High school or higher: 96.9%
Bachelor's degree or higher: 50.9%
Graduate or professional degree: 24.9%
Unemployed: 2.6%
Mean travel time to work (commute): 27.6 minutes
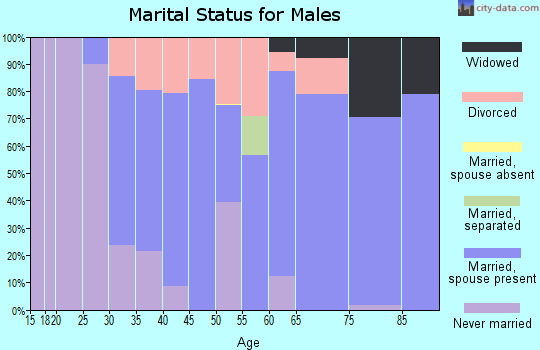
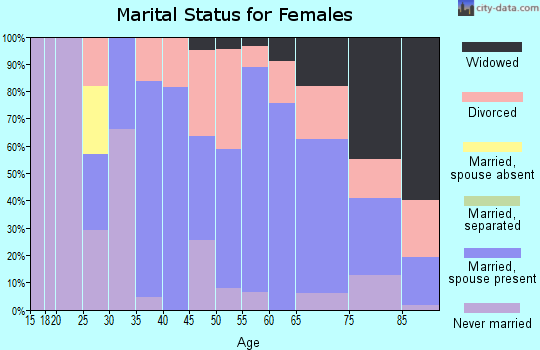
For population 15 years and over in 12518:
Never married: 34.1%
Now married: 50.4%
Separated: 0.7%
Widowed: 7.3%
Divorced: 7.6%
Zip code 12518 compared to state average:
Unemployed percentage below state average.
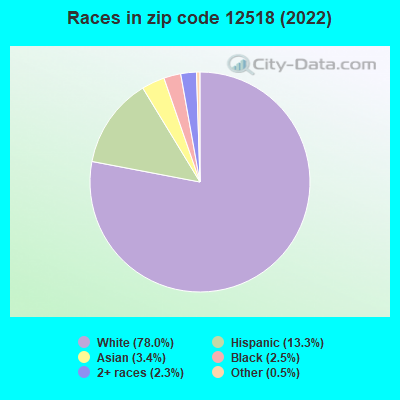
Black race population percentage significantly below state average.
Foreign-born population percentage significantly below state average.
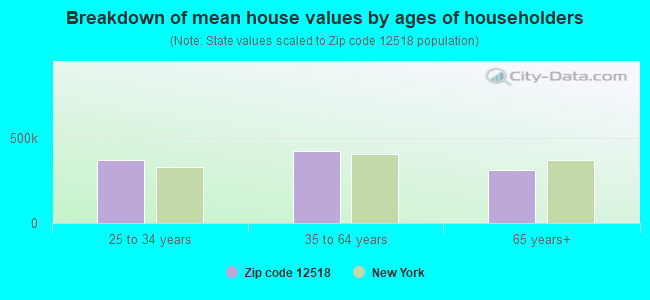
Estimated median house/condo value in 2022: $365,166
12518:
$365,166
New York:
$400,400
According to our research of New York and other state lists, there were 3 registered sex offenders living in 12518 zip code as of April 27, 2024. The ratio of all residents to sex offenders in zip code 12518 is 2,133 to 1. The ratio of registered sex offenders to all residents in this zip code is lower than the state average.
Median resident age:
This zip code:
43.5 years
New York median age:
40.0 years
Average household size:
This zip code:
2.4 people
New York:
2.5 people
Averages for the 2020 tax year for zip code 12518, filed in 2021:
Average Adjusted Gross Income (AGI) in 2020: $97,882 (Individual Income Tax Returns)
Here:
$97,882
State:
$90,930
Salary/wage: $79,171 (reported on 79.7% of returns)
Here:
$79,171
State:
$72,104
(% of AGI for various income ranges: 1077.1% for AGIs below $25k, 3351.2% for AGIs $25k-50k, 5883.9% for AGIs $50k-75k, 8690.9% for AGIs $75k-100k, 16930.5% for AGIs $100k-200k, 73334.4% for AGIs over 200k)
Taxable interest for individuals: $1,384 (reported on 44.9% of returns)
This zip code:
$1,384
New York:
$3,075
(% of AGI for various income ranges: 23.6% for AGIs below $25k, 30.9% for AGIs $25k-50k, 29.7% for AGIs $50k-75k, 66.1% for AGIs $75k-100k, 134.5% for AGIs $100k-200k, 965.6% for AGIs over 200k)
Ordinary dividends: $4,871 (reported on 29.8% of returns)
Here:
$4,871
State:
$11,095
(% of AGI for various income ranges: 43.3% for AGIs below $25k, 59.8% for AGIs $25k-50k, 120.3% for AGIs $50k-75k, 109.6% for AGIs $75k-100k, 293.2% for AGIs $100k-200k, 2398.9% for AGIs over 200k)
Net capital gain/loss in AGI: +$19,484 (reported on 25.2% of returns)
Here:
+$19,484
State:
+$44,925
(% of AGI for various income ranges: 12.2% for AGIs below $25k, 54.4% for AGIs $25k-50k, 73.0% for AGIs $50k-75k, 162.2% for AGIs $75k-100k, 578.0% for AGIs $100k-200k, 13097.8% for AGIs over 200k)
Profit/loss from business: +$19,595 (reported on 14.4% of returns)
Here:
+$19,595
State:
+$14,940
(% of AGI for various income ranges: 74.9% for AGIs below $25k, 170.7% for AGIs $25k-50k, 224.5% for AGIs $50k-75k, 132.6% for AGIs $75k-100k, 513.5% for AGIs $100k-200k, 4945.6% for AGIs over 200k)
Taxable individual retirement arrangement distribution: $16,494 (reported on 11.1% of returns)
12518:
$16,494
New York:
$19,609
(% of AGI for various income ranges: 61.3% for AGIs below $25k, 172.8% for AGIs $25k-50k, 187.6% for AGIs $50k-75k, 247.4% for AGIs $75k-100k, 599.5% for AGIs $100k-200k, 1114.4% for AGIs over 200k)
Self-employed (Keogh) retirement plans: $33,450 (reported on 0.7% of returns)
12518:
$33,450
New York:
$32,497
(% of AGI for various income ranges: 167.2% for AGIs $100k-200k)
Total itemized deductions: $29,305 (reported on 13.8% of returns)
Here:
$29,305
State:
$39,326
(% of AGI for various income ranges: 235.8% for AGIs $25k-50k, 460.9% for AGIs $50k-75k, 636.1% for AGIs $75k-100k, 986.3% for AGIs $100k-200k, 4850.0% for AGIs over 200k)
Charity contributions: $6,529 (reported on 11.5% of returns)
Here:
$6,529
State:
$15,420
(% of AGI for various income ranges: 16.7% for AGIs $25k-50k, 47.0% for AGIs $50k-75k, 67.4% for AGIs $75k-100k, 120.2% for AGIs $100k-200k, 1580.0% for AGIs over 200k)
Taxes paid: $9,367 (reported on 13.8% of returns)
12518:
$9,367
State:
$9,183
(% of AGI for various income ranges: 96.5% for AGIs $25k-50k, 144.2% for AGIs $50k-75k, 248.3% for AGIs $75k-100k, 365.0% for AGIs $100k-200k, 1124.4% for AGIs over 200k)
Earned income credit: $1,853 (reported on 6.2% of returns)
Here:
$1,853
State:
$2,138
(% of AGI for various income ranges: 45.8% for AGIs below $25k, 34.0% for AGIs $25k-50k)
Percentage of individuals using paid preparers for their 2020 taxes: 95.7%
Here:
96%
State:
95%
(% for various income ranges: 94.4% for AGIs below $25k, 96.6% for AGIs $25k-50k, 95.6% for AGIs $50k-75k, 96.9% for AGIs $75k-100k, 95.6% for AGIs $100k-200k, 96.7% for AGIs over 200k)
Averages for the 2012 tax year for zip code 12518, filed in 2013:
Average Adjusted Gross Income (AGI) in 2012: $79,308 (Individual Income Tax Returns)
Here:
$79,308
State:
$77,088
Salary/wage: $70,328 (reported on 82.9% of returns)
Here:
$70,328
State:
$60,593
(% of AGI for various income ranges: 66.6% for AGIs below $25k, 71.6% for AGIs $25k-50k, 77.7% for AGIs $50k-75k, 76.4% for AGIs $75k-100k, 78.8% for AGIs $100k-200k, 66.2% for AGIs over 200k)
Taxable interest for individuals: $1,018 (reported on 48.8% of returns)
This zip code:
$1,018
New York:
$3,125
(% of AGI for various income ranges: 1.9% for AGIs below $25k, 0.6% for AGIs $25k-50k, 0.9% for AGIs $50k-75k, 0.6% for AGIs $75k-100k, 0.6% for AGIs $100k-200k, 0.4% for AGIs over 200k)
Ordinary dividends: $4,588 (reported on 30.0% of returns)
Here:
$4,588
State:
$10,299
(% of AGI for various income ranges: 3.5% for AGIs below $25k, 1.9% for AGIs $25k-50k, 1.1% for AGIs $50k-75k, 1.0% for AGIs $75k-100k, 1.1% for AGIs $100k-200k, 2.7% for AGIs over 200k)
Net capital gain/loss in AGI: +$4,997 (reported on 22.0% of returns)
Here:
+$4,997
State:
+$42,474
(% of AGI for various income ranges: 0.3% for AGIs $25k-50k, 0.3% for AGIs $75k-100k, 0.6% for AGIs $100k-200k, 3.9% for AGIs over 200k)
Profit/loss from business: +$21,032 (reported on 13.9% of returns)
Here:
+$21,032
State:
+$16,168
(% of AGI for various income ranges: 4.8% for AGIs below $25k, 3.7% for AGIs $25k-50k, 2.8% for AGIs $50k-75k, 1.3% for AGIs $75k-100k, 3.0% for AGIs $100k-200k, 5.6% for AGIs over 200k)
Taxable individual retirement arrangement distribution: $13,265 (reported on 10.8% of returns)
12518:
$13,265
New York:
$17,621
(% of AGI for various income ranges: 4.2% for AGIs below $25k, 2.6% for AGIs $25k-50k, 1.7% for AGIs $50k-75k, 2.1% for AGIs $75k-100k, 1.8% for AGIs $100k-200k, 1.2% for AGIs over 200k)
Self-employment retirement plans: $20,400 (reported on 1.0% of returns)
12518:
$20,400
New York:
$27,330
Total itemized deductions: $30,356 (23% of AGI, reported on 46.3% of returns)
Here:
$30,356
State:
$34,985
Here:
22.7% of AGI
State:
21.3% of AGI
(% of AGI for various income ranges: 15.6% for AGIs below $25k, 11.1% for AGIs $25k-50k, 15.3% for AGIs $50k-75k, 17.0% for AGIs $75k-100k, 20.0% for AGIs $100k-200k, 18.5% for AGIs over 200k)
Charity contributions: $2,632 (reported on 41.5% of returns)
Here:
$2,632
State:
$5,572
(% of AGI for various income ranges: 0.9% for AGIs below $25k, 0.7% for AGIs $25k-50k, 1.1% for AGIs $50k-75k, 1.3% for AGIs $75k-100k, 1.6% for AGIs $100k-200k, 1.5% for AGIs over 200k)
Taxes paid: $16,620 (reported on 46.3% of returns)
12518:
$16,620
State:
$18,656
(% of AGI for various income ranges: 6.3% for AGIs below $25k, 5.3% for AGIs $25k-50k, 7.0% for AGIs $50k-75k, 8.6% for AGIs $75k-100k, 11.0% for AGIs $100k-200k, 11.4% for AGIs over 200k)
Earned income credit: $1,795 (reported on 7.7% of returns)
Here:
$1,795
State:
$2,230
(% of AGI for various income ranges: 3.1% for AGIs below $25k, 0.5% for AGIs $25k-50k)
Percentage of individuals using paid preparers for their 2012 taxes: 63.4%
Here:
63%
State:
66%
(% for various income ranges: 53.4% for AGIs below $25k, 55.1% for AGIs $25k-50k, 71.1% for AGIs $50k-75k, 65.5% for AGIs $75k-100k, 73.7% for AGIs $100k-200k, 78.9% for AGIs over 200k)
Averages for the 2004 tax year for zip code 12518, filed in 2005:
Average Adjusted Gross Income (AGI) in 2004: $63,351 (Individual Income Tax Returns)
Here:
$63,351
State:
$59,519
Salary/wage: $57,756 (reported on 83.3% of returns)
Here:
$57,756
State:
$50,673
(% of AGI for various income ranges: 97.3% for AGIs below $10k, 64.0% for AGIs $10k-25k, 76.3% for AGIs $25k-50k, 81.5% for AGIs $50k-75k, 80.4% for AGIs $75k-100k, 73.5% for AGIs over 100k)
Taxable interest for individuals: $1,355 (reported on 63.5% of returns)
This zip code:
$1,355
New York:
$2,377
(% of AGI for various income ranges: 10.2% for AGIs below $10k, 3.5% for AGIs $10k-25k, 2.3% for AGIs $25k-50k, 1.1% for AGIs $50k-75k, 1.1% for AGIs $75k-100k, 1.0% for AGIs over 100k)
Taxable dividends: $2,225 (reported on 37.0% of returns)
Here:
$2,225
State:
$5,394
(% of AGI for various income ranges: 6.6% for AGIs below $10k, 1.5% for AGIs $10k-25k, 1.7% for AGIs $25k-50k, 1.3% for AGIs $50k-75k, 0.8% for AGIs $75k-100k, 1.2% for AGIs over 100k)
Net capital gain/loss: +$6,095 (reported on 27.2% of returns)
Here:
+$6,095
State:
+$23,581
(% of AGI for various income ranges: -5.7% for AGIs below $10k, -0.6% for AGIs $10k-25k, -0.2% for AGIs $25k-50k, -0.0% for AGIs $50k-75k, 0.4% for AGIs $75k-100k, 5.0% for AGIs over 100k)
Profit/loss from business: +$14,747 (reported on 15.1% of returns)
Here:
+$14,747
State:
+$13,809
(% of AGI for various income ranges: 7.5% for AGIs below $10k, 5.7% for AGIs $10k-25k, 2.7% for AGIs $25k-50k, 2.3% for AGIs $50k-75k, 2.8% for AGIs $75k-100k, 4.0% for AGIs over 100k)
IRA payment deduction: $3,469 (reported on 3.4% of returns)
12518:
$3,469
New York:
$3,115
(% of AGI for various income ranges: 0.4% for AGIs $10k-25k, 0.2% for AGIs $25k-50k, 0.3% for AGIs $50k-75k, 0.2% for AGIs $75k-100k, 0.1% for AGIs over 100k)
Self-employed pension: $12,647 (reported on 1.2% of returns)
Here:
$12,647
New York:
$19,016
Total itemized deductions: $24,404 (23% of AGI, reported on 48.5% of returns)
Here:
$24,404
State:
$25,864
Here:
23.3% of AGI
State:
21.9% of AGI
(% of AGI for various income ranges: 14.7% for AGIs below $10k, 12.5% for AGIs $10k-25k, 14.3% for AGIs $25k-50k, 20.2% for AGIs $50k-75k, 21.9% for AGIs $75k-100k, 18.8% for AGIs over 100k)
Charity contributions deductions: $2,633 (2% of AGI, reported on 46.3% of returns)
Here:
$2,633
State:
$4,439
Here:
2.5% of AGI
State:
3.6% of AGI
(% of AGI for various income ranges: 1.1% for AGIs below $10k, 1.2% for AGIs $10k-25k, 1.4% for AGIs $25k-50k, 2.0% for AGIs $50k-75k, 2.5% for AGIs $75k-100k, 2.0% for AGIs over 100k)
Total tax: $9,978 (reported on 82.7% of returns)
12518:
$9,978
State:
$11,730
(% of AGI for various income ranges: 3.9% for AGIs below $10k, 4.5% for AGIs $10k-25k, 7.8% for AGIs $25k-50k, 9.3% for AGIs $50k-75k, 9.4% for AGIs $75k-100k, 17.1% for AGIs over 100k)
Earned income credit: $1,377 (reported on 6.2% of returns)
Here:
$1,377
State:
$1,757
Percentage of individuals using paid preparers for their 2004 taxes: 66.0%
Here:
66%
State:
67%
(% for various income ranges: 59.6% for AGIs below $10k, 64.9% for AGIs $10k-25k, 62.7% for AGIs $25k-50k, 64.2% for AGIs $50k-75k, 75.2% for AGIs $75k-100k, 72.9% for AGIs over 100k)
Household received Food Stamps/SNAP in the past 12 months: 69 Household did not receive Food Stamps/SNAP in the past 12 months: 2,245
Women who had a birth in the past 12 months: 76 (75 now married, 0 unmarried) Women who did not have a birth in the past 12 months: 1,083 (428 now married, 652 unmarried)
Housing units in zip code 12518 with a mortgage: 1,040 (88 second mortgage, 29 home equity loan, 61 both second mortgage and home equity loan) Houses without a mortgage: 42
Median monthly owner costs for units with a mortgage: $2,728 Median monthly owner costs for units without a mortgage: $1,067
Residents with income below the poverty level in 2022:
This zip code:
4.7%
Whole state:
14.3%
Residents with income below 50% of the poverty level in 2022:
This zip code:
3.4%
Whole state:
6.8%
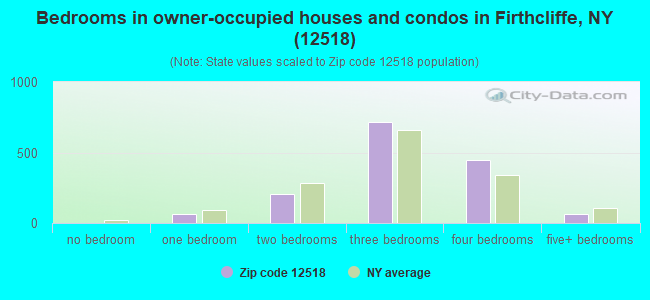
Median number of rooms in houses and condos:
Here:
6.6
State:
6.3
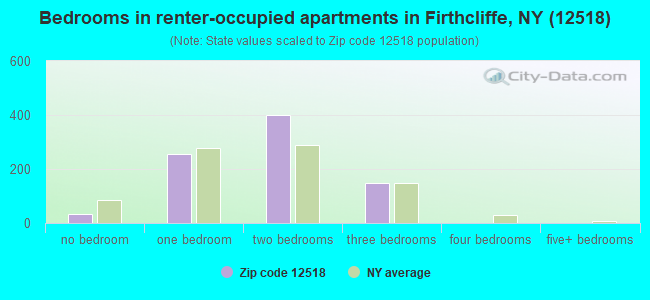
Median number of rooms in apartments:
Here:
4.0
State:
3.8
Notable locations in this zip code not listed on our city pages
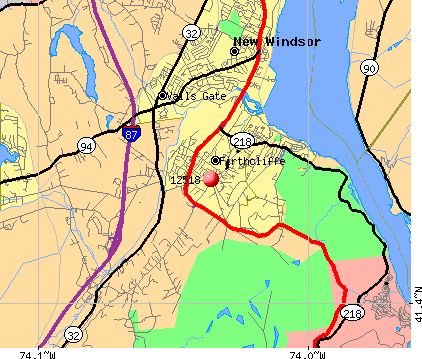
Notable locations in zip code 12518: Storm King Golf Club (A), Cornwall Industrial Park (B), Jones Farm (C), Hudson Highlands Nature Museum (D), Cornwall Fire Department Highland Engine Company 1 (E), Cornwall Town Hall (F), Cornwall Public Library (G). Display/hide their locations on the map
Churches in zip code 12518 include: Saint John's Episcopal Church (A), Friends Meeting At Cornwall (B), Cornwall United Methodist Church (C), Cornwall Baptist Church (D). Display/hide their locations on the map
In group quarters: 28 (-1 institutionalized population)
Size of family households: 666 2-persons, 378 3-persons, 312 4-persons, 74 5-persons, 63 6-persons, 10 7-or-more-persons
Size of nonfamily households: 633 1-person, 211 2-persons
969 married couples with children.
191 single-parent households (64 men, 127 women).
90.4% of residents of 12518 zip code speak English at home.
6.4% of residents speak Spanish at home (36% very well, 33% well, 25% not well, 7% not at all).
1.6% of residents speak other Indo-European language at home (72% very well, 11% well, 17% not well).
1.6% of residents speak Asian or Pacific Island language at home (82% very well, 18% not well).
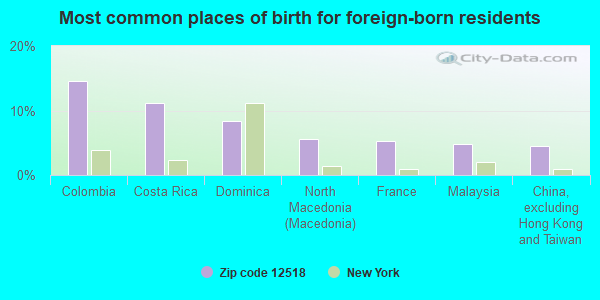
Foreign born population: 289 (5.0%) (73.2% of them are naturalized citizens)
This zip code:
5.0%
Whole state:
22.7%
15%Colombia
11%Costa Rica
8%Dominica
6%North Macedonia (Macedonia)
5%France
5%Malaysia
5%China, excluding Hong Kong and Taiwan
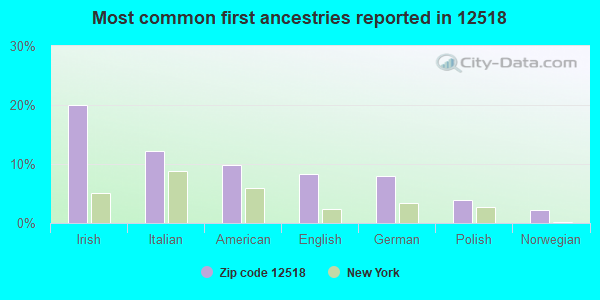
20%Irish
12%Italian
10%American
8%English
8%German
4%Polish
2%Norwegian
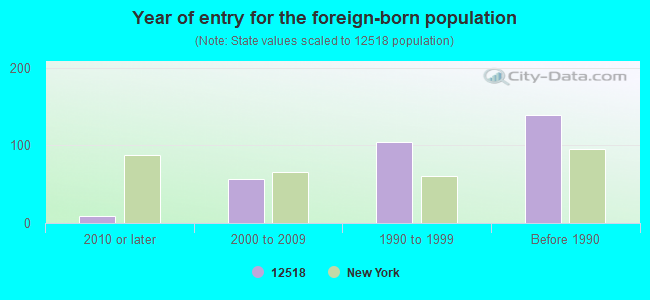
Year of entry for the foreign-born population
92010 or later
572000 to 2009
1041990 to 1999
139Before 1990
Facilities with environmental interests located in this zip code:
CORNWALL HOSPITAL (LAUREL AVE in CORNWALL, NY)
AIR SYNTHETIC MINOR (AIRS/AFS) STATE MASTER (New York facility tracking) - AIR PROGRAM, REFUSE DISPOSAL, HAZARDOUS WASTE PROGRAM, (Resource Conservation and Recovery Act (tracking hazardous waste)) Business SIC and NAICS classification: GENERAL MEDICAL AND SURGICAL HOSPITALS Organizations: RUSSELL CULLINGHAM (FACILITY APPLICATION CONTACT)
CORNWALL WWTP (183 MAIN STREET in CORNWALL, NY)
STATE MASTER (New York facility tracking) - SOLID WASTE PROGRAM, National Pollutant Discharge Elimination System Permit, GRANTS AND PLANNING, National Pollutant Discharge Elimination System MAJOR (Tracking pollutant discharge elimination systems) - permit Business SIC classification: SEWERAGE SYSTEMS Business NAICS classification: SEWAGE TREATMENT FACILITIES. Organizations: CORNWALL (T) (CONTACT/OWNER)
, CORNWALL - T (LEGALLY RESPONSIBLE PARTY)
Alternative names: CORNWALL (T), CORNWALL (T) WWTP
ANGOLA RD GIRLS GROUP HOME ( in CORNWALL, NY)
(National Center for Education Statistics) - STATE ID-440301897532 Organizations: CORNWALL CSD (SCHOOL DISTRICT)
CORNWALL ES ( in CORNWALL, NY)
(National Center for Education Statistics) - STATE ID-440301060004 Organizations: CORNWALL CSD (SCHOOL DISTRICT)
CORNWALL PAPER MILL CO (FORGE HILL ROAD in CORNWALL, NY)
(Integrated Compliance Information System) - ICIS-02-1976-0003, FORMAL ENFORCEMENT ACTION Business SIC classification: PAPER MILLS
CUMBERLAND FARMS #3166 (RTE 94 & SHORE DR in CORNWALL, NY)
(Resource Conservation and Recovery Act (tracking hazardous waste))
CORNWALL CLEANERS (QUAKER AVE in CORNWALL, NY)
(Resource Conservation and Recovery Act (tracking hazardous waste))
CORNWALL CENTRAL SCHOOL DIST (122 MAIN ST in CORNWALL, NY)
Conditionally Exempt Small Quantity Generators, less than 100 kg/month of hazardous waste (Resource Conservation and Recovery Act (tracking hazardous waste)) - notification
CORNWALL CENTRAL SCHOOL DISTRICT (130 MAIN ST in CORNWALL, NY)
COMPLIANCE ACTIVITY (Tracking inspections of insecticide, fungicide, and rodenticide, and toxic substances)
Housing units lacking complete plumbing facilities: 0.4%
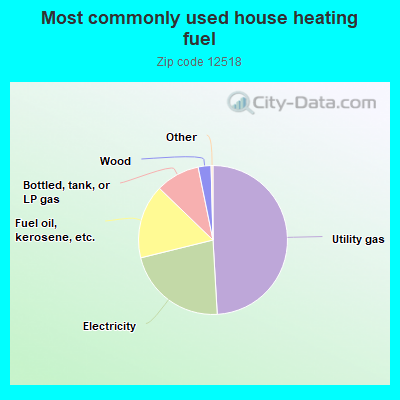
49.2%Utility gas
22.1%Electricity
16.1%Fuel oil, kerosene, etc.
9.6%Bottled, tank, or LP gas
2.8%Wood
Population in 1990: 8,120.
Place of birth for U.S.-born residents:
This state: 4,052
Northeast: 536
Midwest: 262
South: 398
West: 189
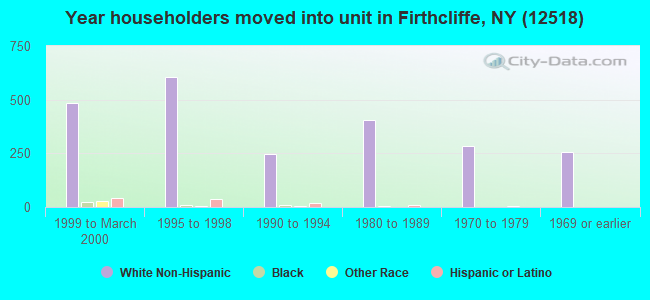
54% of the 12518 zip code residents lived in the same house 5 years ago. Out of people who lived in different houses, 51% lived in this county. Out of people who lived in different counties, 50% lived in New York.
90% of the 12518 zip code residents lived in the same house 1 year ago. Out of people who lived in different houses, 62% moved from this county. Out of people who lived in different houses, 36% moved from different county within same state.
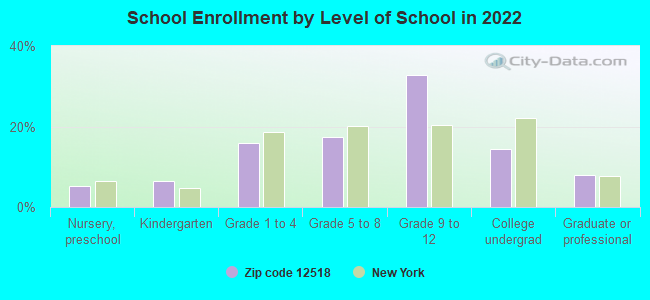
Private vs. public school enrollment:
Students in private schools in grades 1 to 8 (elementary and middle school): 16
Here:
4.1%
New York:
15.6%
Students in private schools in grades 9 to 12 (high school): 1
Here:
0.3%
New York:
15.0%
Students in private undergraduate colleges: 98
Here:
57.8%
New York:
39.2%
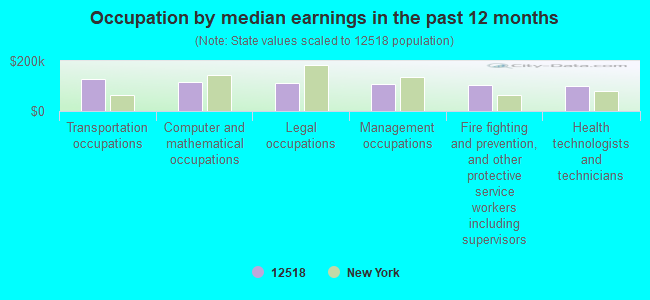
Occupation by median earnings in the past 12 months ($)
128,911Transportation occupations
116,189Computer and mathematical occupations
113,610Legal occupations
109,746Management occupations
103,012Fire fighting and prevention, and other protective service workers including supervisors
99,027Health technologists and technicians
Companies with federal contracts located in this zip code:
NANNINI & CALLAHAN EXCAVATING (262 ANGOLA RD in CORNWALL, NY; small business) : $268,541 in 4 contractsfrom 2000 to 2002
$99,976 with Army for Maintenance, Repair and Rebuilding of Equipment -- Miscellaneous. Signed on 2000-10-22. Completion date: 2001-09-28.
$88,426 with Army for Construction of Structures and Facilities -- Other Administrative Facilities and Service Buildings. Signed on 2002-02-05. Completion date: 2002-05-16.
$51,120, same as above.Signed on 2002-01-08. Completion date: 2002-04-30.
$29,019 with Army for Maintenance, Repair and Rebuilding of Equipment -- Miscellaneous. Signed on 2001-05-11. Completion date: 2001-09-30.
CORNWALL COAL& SUPPLY CO INC (22 STATION RD in CORNWALL, NY; small business)
$29,980 with Army for Carpet Laying and Cleaning. Signed on 2003-09-30. Completion date: 2003-10-30.
WARREN MILLER STUDIOS (15 HAWK NEST ROAD in CORNWALL, NY; small business) : $13,885 in 2 contractsin 2004
$7,385 with Army for Installation of Equipment -- Woodworking Machinery and Equipment. Signed on 2004-04-01. Completion date: 2004-06-01.
$6,500 with Army for Arts/Graphics Services. Signed on 2004-01-14. Completion date: 2004-03-12.
Top industries in this zip code by the number of employees in 2005:
Administrative and Support and Waste Management and Remediation Services: All Other Support Services (250-499 employees: 1 establishment)
Health Care and Social Assistance: General Medical and Surgical Hospitals (250-499: 1)
Health Care and Social Assistance: Nursing Care Facilities (100-249: 1)
2002 - 2018 National Fire Incident Reporting System (NFIRS) incidents
Based on the data from the years 2002 - 2018 the average number of fires per year is 22. The highest number of reported fires - 48 took place in 2004, and the least - 2 in 2017. The data has a declining trend.
When looking into fire subcategories, the most reports belonged to: Structure Fires (48.1%), and Outside Fires (28.5%).
Fire incident types reported to NFIRS in Zip Code 12518
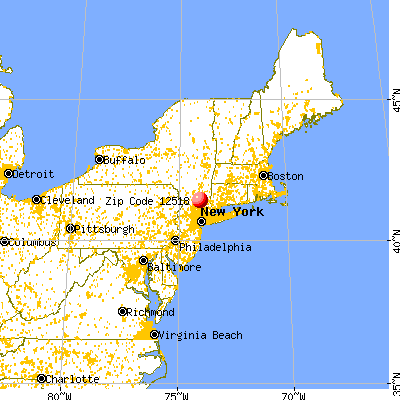


 Nearest zip codes: 10953, 12520, 12553, 10996, 12577, 10928.
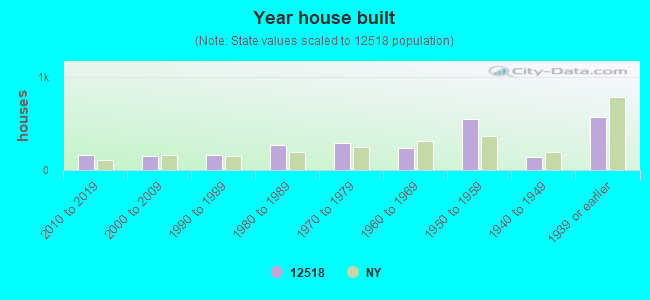


 Based on the data from the years 2002 - 2018 the average number of fires per year is 22. The highest number of reported fires - 48 took place in 2004, and the least - 2 in 2017. The data has a declining trend.
 When looking into fire subcategories, the most reports belonged to: Structure Fires (48.1%), and Outside Fires (28.5%).