Averages for the 2020 tax year for zip code 12729, filed in 2021:
Average Adjusted Gross Income (AGI) in 2020: $56,289 (Individual Income Tax Returns)
Here:
$56,289
State:
$90,930
Salary/wage: $51,038 (reported on 78.6% of returns)
Here:
$51,038
State:
$72,104
(% of AGI for various income ranges: 1048.5% for AGIs below $25k, 3622.0% for AGIs $25k-50k, 6196.7% for AGIs $50k-75k, 10524.0% for AGIs $75k-100k, 15902.0% for AGIs $100k-200k)
Taxable interest for individuals: $1,011 (reported on 32.1% of returns)
This zip code:
$1,011
New York:
$3,075
(% of AGI for various income ranges: 6.5% for AGIs below $25k, 22.0% for AGIs $25k-50k, 31.1% for AGIs $50k-75k, 132.0% for AGIs $75k-100k, 50.0% for AGIs $100k-200k)
Ordinary dividends: $4,133 (reported on 14.3% of returns)
Here:
$4,133
State:
$11,095
(% of AGI for various income ranges: 16.0% for AGIs $25k-50k, 330.0% for AGIs $75k-100k, 598.0% for AGIs $100k-200k)
Net capital gain/loss in AGI: +$8,050 (reported on 11.9% of returns)
Here:
+$8,050
State:
+$44,925
(% of AGI for various income ranges: 322.0% for AGIs $75k-100k, 1330.0% for AGIs $100k-200k)
Profit/loss from business: +$5,027 (reported on 13.1% of returns)
Here:
+$5,027
State:
+$14,940
(% of AGI for various income ranges: 27.5% for AGIs below $25k, 92.5% for AGIs $25k-50k, 7.8% for AGIs $50k-75k, 612.0% for AGIs $100k-200k)
Taxable individual retirement arrangement distribution: $7,575 (reported on 4.8% of returns)
12729:
$7,575
New York:
$19,609
(% of AGI for various income ranges: 606.0% for AGIs $75k-100k)
Total itemized deductions: $22,125 (reported on 4.8% of returns)
Here:
$22,125
State:
$39,326
(% of AGI for various income ranges: 1770.0% for AGIs $75k-100k)
Charity contributions: $3,967 (reported on 3.6% of returns)
Here:
$3,967
State:
$15,420
(% of AGI for various income ranges: 238.0% for AGIs $75k-100k)
Taxes paid: $8,425 (reported on 4.8% of returns)
12729:
$8,425
State:
$9,183
(% of AGI for various income ranges: 674.0% for AGIs $75k-100k)
Earned income credit: $1,993 (reported on 16.7% of returns)
Here:
$1,993
State:
$2,138
(% of AGI for various income ranges: 76.0% for AGIs below $25k, 63.5% for AGIs $25k-50k)
Percentage of individuals using paid preparers for their 2020 taxes: 94.0%
Here:
94%
State:
95%
(% for various income ranges: 96.3% for AGIs below $25k, 96.0% for AGIs $25k-50k, 91.7% for AGIs $50k-75k, 88.9% for AGIs $75k-100k, 100.0% for AGIs $100k-200k, 66.7% for AGIs over 200k)
Averages for the 2012 tax year for zip code 12729, filed in 2013:
Average Adjusted Gross Income (AGI) in 2012: $43,081 (Individual Income Tax Returns)
Here:
$43,081
State:
$77,088
Salary/wage: $41,593 (reported on 81.2% of returns)
Here:
$41,593
State:
$60,593
(% of AGI for various income ranges: 73.0% for AGIs below $25k, 81.2% for AGIs $25k-50k, 82.1% for AGIs $50k-75k, 77.8% for AGIs $75k-100k, 77.1% for AGIs $100k-200k)
Taxable interest for individuals: $581 (reported on 31.8% of returns)
This zip code:
$581
New York:
$3,125
(% of AGI for various income ranges: 1.0% for AGIs below $25k, 0.2% for AGIs $25k-50k, 0.2% for AGIs $50k-75k, 0.5% for AGIs $75k-100k, 0.4% for AGIs $100k-200k)
Ordinary dividends: $2,342 (reported on 14.1% of returns)
Here:
$2,342
State:
$10,299
(% of AGI for various income ranges: 1.1% for AGIs below $25k, 0.4% for AGIs $25k-50k, 0.2% for AGIs $50k-75k, 1.0% for AGIs $75k-100k, 1.0% for AGIs $100k-200k)
Profit/loss from business: +$5,055 (reported on 12.9% of returns)
Here:
+$5,055
State:
+$16,168
(% of AGI for various income ranges: 7.6% for AGIs below $25k, 1.6% for AGIs $25k-50k, 1.4% for AGIs $75k-100k)
Taxable individual retirement arrangement distribution: $7,250 (reported on 4.7% of returns)
12729:
$7,250
New York:
$17,621
Total itemized deductions: $20,975 (25% of AGI, reported on 28.2% of returns)
Here:
$20,975
State:
$34,985
Here:
24.7% of AGI
State:
21.3% of AGI
(% of AGI for various income ranges: 7.9% for AGIs below $25k, 6.8% for AGIs $25k-50k, 13.8% for AGIs $50k-75k, 17.5% for AGIs $75k-100k, 17.8% for AGIs $100k-200k)
Charity contributions: $1,742 (reported on 22.4% of returns)
Here:
$1,742
State:
$5,572
(% of AGI for various income ranges: 0.7% for AGIs $25k-50k, 0.6% for AGIs $50k-75k, 1.4% for AGIs $75k-100k, 1.3% for AGIs $100k-200k)
Taxes paid: $9,979 (reported on 28.2% of returns)
12729:
$9,979
State:
$18,656
(% of AGI for various income ranges: 3.7% for AGIs below $25k, 2.9% for AGIs $25k-50k, 6.3% for AGIs $50k-75k, 8.4% for AGIs $75k-100k, 8.8% for AGIs $100k-200k)
Earned income credit: $2,224 (reported on 20.0% of returns)
Here:
$2,224
State:
$2,230
(% of AGI for various income ranges: 6.5% for AGIs below $25k, 1.2% for AGIs $25k-50k)
Percentage of individuals using paid preparers for their 2012 taxes: 56.5%
Here:
56%
State:
66%
(% for various income ranges: 48.7% for AGIs below $25k, 57.9% for AGIs $25k-50k, 54.5% for AGIs $50k-75k, 75.0% for AGIs $75k-100k, 75.0% for AGIs $100k-200k)
Averages for the 2004 tax year for zip code 12729, filed in 2005:
Average Adjusted Gross Income (AGI) in 2004: $38,093 (Individual Income Tax Returns)
Here:
$38,093
State:
$59,519
Salary/wage: $36,587 (reported on 88.1% of returns)
Here:
$36,587
State:
$50,673
(% of AGI for various income ranges: 94.9% for AGIs below $10k, 81.1% for AGIs $10k-25k, 87.7% for AGIs $25k-50k, 88.3% for AGIs $50k-75k, 86.6% for AGIs $75k-100k, 74.0% for AGIs over 100k)
Taxable interest for individuals: $887 (reported on 39.4% of returns)
This zip code:
$887
New York:
$2,377
(% of AGI for various income ranges: 2.3% for AGIs below $10k, 0.7% for AGIs $10k-25k, 2.0% for AGIs $25k-50k, 0.5% for AGIs $50k-75k, 0.4% for AGIs $75k-100k, 0.7% for AGIs over 100k)
Taxable dividends: $1,021 (reported on 16.9% of returns)
Here:
$1,021
State:
$5,394
(% of AGI for various income ranges: 1.2% for AGIs below $10k, 0.3% for AGIs $10k-25k, 0.5% for AGIs $25k-50k, 0.3% for AGIs $50k-75k, 1.0% for AGIs $75k-100k, 0.3% for AGIs over 100k)
Net capital gain/loss: +$6,694 (reported on 10.2% of returns)
Here:
+$6,694
State:
+$23,581
(% of AGI for various income ranges: -2.1% for AGIs below $10k, 0.3% for AGIs $10k-25k, 0.2% for AGIs $25k-50k, -0.1% for AGIs $50k-75k, -0.0% for AGIs $75k-100k, 9.7% for AGIs over 100k)
Profit/loss from business: +$5,078 (reported on 12.3% of returns)
Here:
+$5,078
State:
+$13,809
(% of AGI for various income ranges: 12.1% for AGIs below $10k, 7.3% for AGIs $10k-25k, -0.3% for AGIs $25k-50k, 1.6% for AGIs $50k-75k, 0.8% for AGIs over 100k)
IRA payment deduction: $2,200 (reported on 1.8% of returns)
12729:
$2,200
New York:
$3,115
Total itemized deductions: $16,965 (24% of AGI, reported on 27.5% of returns)
Here:
$16,965
State:
$25,864
Here:
23.7% of AGI
State:
21.9% of AGI
(% of AGI for various income ranges: 8.1% for AGIs $10k-25k, 8.5% for AGIs $25k-50k, 12.4% for AGIs $50k-75k, 16.6% for AGIs $75k-100k, 16.1% for AGIs over 100k)
Charity contributions deductions: $2,064 (3% of AGI, reported on 24.6% of returns)
Here:
$2,064
State:
$4,439
Here:
2.8% of AGI
State:
3.6% of AGI
(% of AGI for various income ranges: 0.7% for AGIs $10k-25k, 0.9% for AGIs $25k-50k, 1.2% for AGIs $50k-75k, 1.7% for AGIs $75k-100k, 2.3% for AGIs over 100k)
Total tax: $4,493 (reported on 74.6% of returns)
12729:
$4,493
State:
$11,730
(% of AGI for various income ranges: 3.1% for AGIs below $10k, 4.4% for AGIs $10k-25k, 6.4% for AGIs $25k-50k, 8.3% for AGIs $50k-75k, 10.5% for AGIs $75k-100k, 14.0% for AGIs over 100k)
Earned income credit: $1,653 (reported on 17.3% of returns)
Here:
$1,653
State:
$1,757
Percentage of individuals using paid preparers for their 2004 taxes: 63.5%
Here:
63%
State:
67%
(% for various income ranges: 48.7% for AGIs below $10k, 69.8% for AGIs $10k-25k, 66.8% for AGIs $25k-50k, 68.5% for AGIs $50k-75k, 63.6% for AGIs $75k-100k, 67.4% for AGIs over 100k)
Household received Food Stamps/SNAP in the past 12 months: 89 Household did not receive Food Stamps/SNAP in the past 12 months: 502
Women who had a birth in the past 12 months: 61 (32 now married, 29 unmarried) Women who did not have a birth in the past 12 months: 179 (100 now married, 76 unmarried)
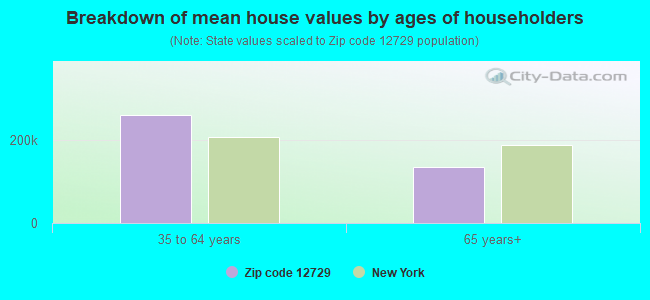
Housing units in zip code 12729 with a mortgage: 226 (4 second mortgage, 4 both second mortgage and home equity loan) Houses without a mortgage: 99
Median monthly owner costs for units with a mortgage: $1,559 Median monthly owner costs for units without a mortgage: $822
Residents with income below the poverty level in 2022:
This zip code:
8.3%
Whole state:
14.3%
Residents with income below 50% of the poverty level in 2022:
This zip code:
5.7%
Whole state:
6.8%
Median number of rooms in houses and condos:
Here:
5.7
State:
6.3
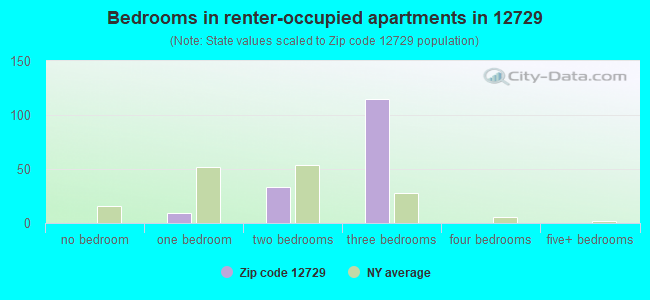
Median number of rooms in apartments:
Here:
5.0
State:
3.8
Notable locations in this zip code not listed on our city pages
Notable locations in zip code 12729: Greenkill Conference Center (A), Oakland Valley Campground (B), Neversink Valley Area Museum (C), Cuddebackville Fire District Station (D). Display/hide their locations on the map
Lakes and reservoirs: Lake Marling (A), Sand Pond (B), Beaverdam Pond (C), Lake Helen (D), Holleys Pond (E), McAlister Lake (F), Prospect Lake (G). Display/hide their locations on the map
Size of family households: 263 2-persons, 72 3-persons, 28 4-persons, 2 5-persons, 34 6-persons
Size of nonfamily households: 152 1-person, 16 2-persons, 25 4-persons
164 married couples with children.
55 single-parent households (35 men, 20 women).
84.6% of residents of 12729 zip code speak English at home.
3.8% of residents speak Spanish at home (51% very well, 49% well).
7.5% of residents speak other Indo-European language at home (97% very well, 3% well).
4.5% of residents speak Asian or Pacific Island language at home (62% very well, 2% well, 36% not well).
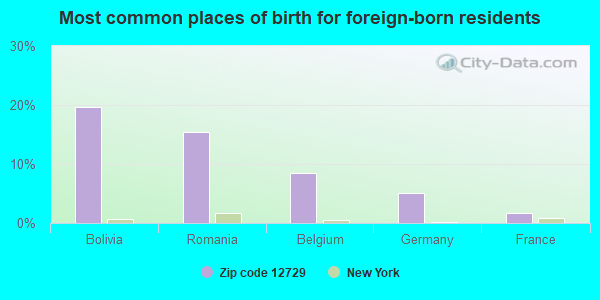
Foreign born population: 118 (8.7%) (75.8% of them are naturalized citizens)
This zip code:
8.7%
Whole state:
22.7%
20%Bolivia
15%Romania
9%Belgium
5%Germany
2%France
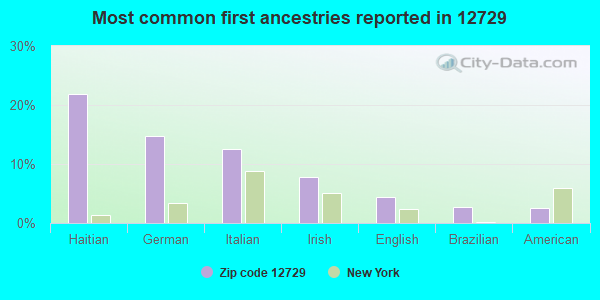
22%Haitian
15%German
13%Italian
8%Irish
4%English
3%Brazilian
3%American
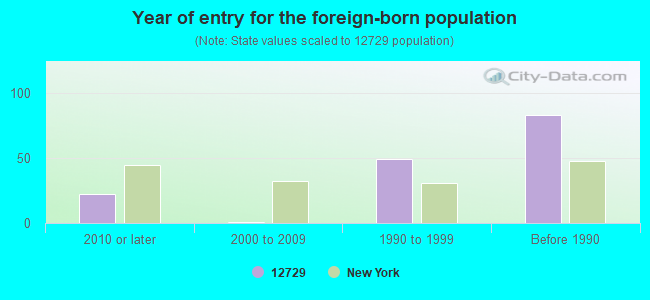
Year of entry for the foreign-born population
222010 or later
12000 to 2009
491990 to 1999
83Before 1990
Public elementary/middle school in in zip code 12729 not listed on the city page:
Facilities with environmental interests located in this zip code:
CUDDEBACKVILLE ASPHALT PLANT #76 (ROUTE 209 in CUDDEBACKVILLE, NY)
AIR SYNTHETIC MINOR (AIRS/AFS) STATE MASTER (New York facility tracking) - AIR PROGRAM, Business SIC classification: READY-MIXED CONCRETE Business NAICS classification: READY-MIX CONCRETE MANUFACTURING. Organizations: CALLANAN INDUSTRIES INC (LEGALLY RESPONSIBLE PARTY)
Alternative names: CALLANAN INDUSTRIES
Housing units lacking complete plumbing facilities: 1.2%
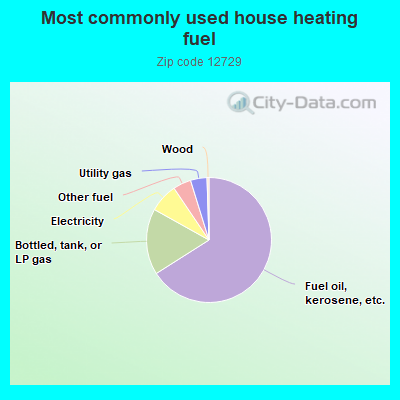
66.4%Fuel oil, kerosene, etc.
17.2%Bottled, tank, or LP gas
7.5%Electricity
4.7%Other fuel
4.3%Utility gas
0.5%Wood
Population in 1990: 1,191. Population change in the 1990s: +111 (+9.3%).
Place of birth for U.S.-born residents:
This state: 1,022
Northeast: 115
Midwest: 12
South: 12
West: 33
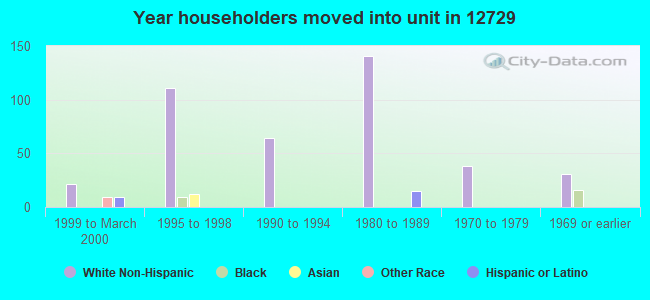
72% of the 12729 zip code residents lived in the same house 5 years ago. Out of people who lived in different houses, 58% lived in this county. Out of people who lived in different counties, 50% lived in New York.
89% of the 12729 zip code residents lived in the same house 1 year ago. Out of people who lived in different houses, 90% moved from this county. Out of people who lived in different houses, 5% moved from different county within same state.
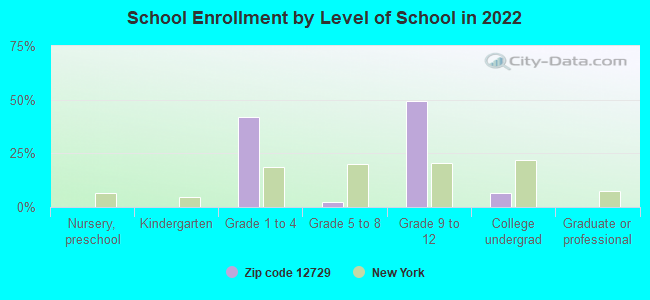
Private vs. public school enrollment:
Students in private schools in grades 1 to 8 (elementary and middle school):
Here:
0.0%
New York:
15.6%
Students in private schools in grades 9 to 12 (high school):
Here:
0.0%
New York:
15.0%
Students in private undergraduate colleges:
Here:
0.0%
New York:
39.2%
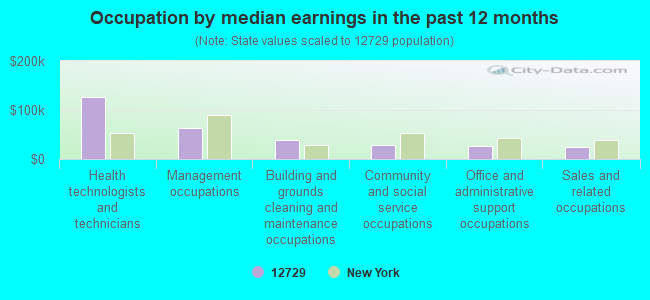
Occupation by median earnings in the past 12 months ($)
126,782Health technologists and technicians
63,156Management occupations
38,477Building and grounds cleaning and maintenance occupations
27,897Community and social service occupations
26,380Office and administrative support occupations
24,789Sales and related occupations
Companies with federal contracts located in this zip code:
PICCOLO, B J PRIVATE SANITATIO (513 B ACORN ST in CUDDEBACKVILLE, NY; small business)
$18,140 with Navy for Trash/Garbage Collection Services - Including Portable Sanitation Services. Signed on 1999-11-23. Completion date: 2000-09-30.
Top industries in this zip code by the number of employees in 2005:
Health Care and Social Assistance: Home Health Care Services (20-49 employees: 1 establishment)
Wholesale Trade: Recyclable Material Merchant Wholesalers (20-49: 1)
Construction: All Other Specialty Trade Contractors (5-9: 1)
Other Services (except Public Administration): Automotive Body, Paint, and Interior Repair and Maintenance (1-4: 2)
Arts, Entertainment, and Recreation: All Other Amusement and Recreation Industries (1-4: 2)
Administrative and Support and Waste Management and Remediation Services: Landscaping Services (1-4: 1)
Other Services (except Public Administration): Environment, Conservation and Wildlife Organizations (1-4: 1)
Accommodation and Food Services: Recreational and Vacation Camps (except Campgrounds) (1-4: 1)
Arts, Entertainment, and Recreation: Museums (1-4: 1)
Fatal accident statistics in 2014:
Fatal accident count: 1
Vehicles involved in fatal accidents: 1
Fatal accidents caused by drunken drivers: 0
Fatalities: 1
Persons involved in fatal accidents: 2
Pedestrians involved in fatal accidents: 0
Fatal accident statistics in 2013:
Fatal accident count: 1
Vehicles involved in fatal accidents: 1
Fatal accidents caused by drunken drivers: 1
Fatalities: 1
Persons involved in fatal accidents: 1
Pedestrians involved in fatal accidents: 0
Home Mortgage Disclosure Act Aggregated Statistics For Year 2009 (Based on 2 partial tracts)
A) FHA, FSA/RHS & VA Home Purchase Loans
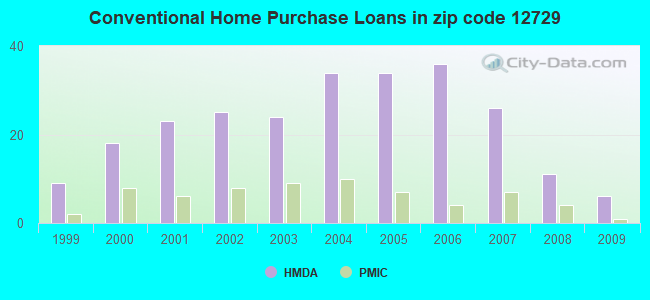
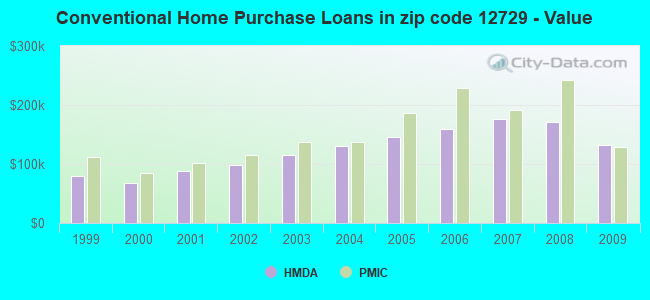
B) Conventional Home Purchase Loans
C) Refinancings
D) Home Improvement Loans
F) Non-occupant Loans on < 5 Family Dwellings (A B C & D)
G) Loans On Manufactured Home Dwelling (A B C & D)
Number
Average Value
Number
Average Value
Number
Average Value
Number
Average Value
Number
Average Value
Number
Average Value
LOANS ORIGINATED
8
$199,171
6
$132,608
19
$141,582
3
$41,637
1
$174,050
2
$45,290
APPLICATIONS APPROVED, NOT ACCEPTED
0
$0
1
$109,820
3
$160,333
1
$138,530
0
$0
0
$0
APPLICATIONS DENIED
3
$151,453
3
$93,930
22
$189,830
6
$40,750
1
$99,460
2
$89,835
APPLICATIONS WITHDRAWN
1
$76,960
2
$124,615
11
$158,629
0
$0
1
$113,070
0
$0
FILES CLOSED FOR INCOMPLETENESS
1
$147,700
0
$0
1
$254,860
0
$0
0
$0
0
$0
Aggregated Statistics For Year 2008 (Based on 2 partial tracts)
A) FHA, FSA/RHS & VA Home Purchase Loans
B) Conventional Home Purchase Loans
C) Refinancings
D) Home Improvement Loans
F) Non-occupant Loans on < 5 Family Dwellings (A B C & D)
G) Loans On Manufactured Home Dwelling (A B C & D)
Number
Average Value
Number
Average Value
Number
Average Value
Number
Average Value
Number
Average Value
Number
Average Value
LOANS ORIGINATED
4
$205,868
11
$170,926
17
$167,989
6
$73,358
2
$125,950
2
$47,950
APPLICATIONS APPROVED, NOT ACCEPTED
1
$116,330
2
$86,285
8
$158,915
2
$27,825
0
$0
1
$67,190
APPLICATIONS DENIED
1
$226,140
5
$139,356
25
$178,322
11
$40,256
3
$160,727
4
$52,465
APPLICATIONS WITHDRAWN
1
$262,850
2
$227,330
8
$164,242
1
$129,940
1
$120,770
0
$0
FILES CLOSED FOR INCOMPLETENESS
0
$0
1
$120,180
2
$233,395
1
$19,240
0
$0
1
$18,350
Aggregated Statistics For Year 2007 (Based on 2 partial tracts)
A) FHA, FSA/RHS & VA Home Purchase Loans
B) Conventional Home Purchase Loans
C) Refinancings
D) Home Improvement Loans
F) Non-occupant Loans on < 5 Family Dwellings (A B C & D)
G) Loans On Manufactured Home Dwelling (A B C & D)
Number
Average Value
Number
Average Value
Number
Average Value
Number
Average Value
Number
Average Value
Number
Average Value
LOANS ORIGINATED
2
$202,610
26
$177,065
33
$148,897
15
$63,009
3
$151,157
3
$62,753
APPLICATIONS APPROVED, NOT ACCEPTED
1
$79,920
4
$160,802
14
$160,559
3
$79,427
1
$126,980
1
$117,220
APPLICATIONS DENIED
0
$0
9
$148,296
40
$166,862
15
$58,904
3
$128,463
5
$63,700
APPLICATIONS WITHDRAWN
0
$0
3
$181,053
20
$188,315
6
$83,077
1
$192,700
1
$33,450
FILES CLOSED FOR INCOMPLETENESS
0
$0
1
$234,430
6
$177,600
1
$56,240
0
$0
0
$0
Aggregated Statistics For Year 2006 (Based on 2 partial tracts)
A) FHA, FSA/RHS & VA Home Purchase Loans
B) Conventional Home Purchase Loans
C) Refinancings
D) Home Improvement Loans
F) Non-occupant Loans on < 5 Family Dwellings (A B C & D)
G) Loans On Manufactured Home Dwelling (A B C & D)
Number
Average Value
Number
Average Value
Number
Average Value
Number
Average Value
Number
Average Value
Number
Average Value
LOANS ORIGINATED
3
$202,367
36
$158,639
49
$146,635
16
$54,353
6
$157,768
4
$66,822
APPLICATIONS APPROVED, NOT ACCEPTED
0
$0
7
$143,603
10
$143,086
2
$107,595
0
$0
1
$96,200
APPLICATIONS DENIED
1
$64,820
20
$133,526
36
$168,169
20
$54,878
5
$127,576
5
$57,720
APPLICATIONS WITHDRAWN
1
$171,980
6
$125,503
28
$150,241
1
$130,830
1
$171,090
1
$33,150
FILES CLOSED FOR INCOMPLETENESS
0
$0
4
$79,475
6
$169,410
0
$0
1
$159,840
1
$43,810
Aggregated Statistics For Year 2005 (Based on 2 partial tracts)
A) FHA, FSA/RHS & VA Home Purchase Loans
B) Conventional Home Purchase Loans
C) Refinancings
D) Home Improvement Loans
F) Non-occupant Loans on < 5 Family Dwellings (A B C & D)
G) Loans On Manufactured Home Dwelling (A B C & D)
Number
Average Value
Number
Average Value
Number
Average Value
Number
Average Value
Number
Average Value
Number
Average Value
LOANS ORIGINATED
1
$105,670
34
$146,189
52
$141,425
12
$63,072
4
$127,575
5
$74,948
APPLICATIONS APPROVED, NOT ACCEPTED
0
$0
5
$114,848
9
$150,072
3
$26,147
0
$0
2
$38,630
APPLICATIONS DENIED
0
$0
14
$122,967
43
$140,139
13
$52,187
2
$126,985
6
$60,730
APPLICATIONS WITHDRAWN
0
$0
8
$170,162
40
$135,679
4
$120,990
1
$412,330
1
$71,930
FILES CLOSED FOR INCOMPLETENESS
0
$0
2
$162,650
10
$167,033
1
$48,840
0
$0
0
$0
Aggregated Statistics For Year 2004 (Based on 2 partial tracts)
A) FHA, FSA/RHS & VA Home Purchase Loans
B) Conventional Home Purchase Loans
C) Refinancings
D) Home Improvement Loans
F) Non-occupant Loans on < 5 Family Dwellings (A B C & D)
G) Loans On Manufactured Home Dwelling (A B C & D)
Number
Average Value
Number
Average Value
Number
Average Value
Number
Average Value
Number
Average Value
Number
Average Value
LOANS ORIGINATED
1
$152,740
34
$130,266
66
$118,418
12
$47,755
8
$108,891
5
$45,940
APPLICATIONS APPROVED, NOT ACCEPTED
0
$0
11
$102,765
26
$85,840
4
$73,778
1
$93,540
3
$46,967
APPLICATIONS DENIED
1
$152,740
18
$105,952
41
$115,418
15
$53,497
3
$142,770
9
$44,466
APPLICATIONS WITHDRAWN
1
$56,540
4
$139,565
38
$114,279
5
$104,606
1
$184,410
2
$61,125
FILES CLOSED FOR INCOMPLETENESS
0
$0
0
$0
4
$143,782
1
$15,390
0
$0
1
$36,700
Aggregated Statistics For Year 2003 (Based on 2 partial tracts)
A) FHA, FSA/RHS & VA Home Purchase Loans
B) Conventional Home Purchase Loans
C) Refinancings
D) Home Improvement Loans
F) Non-occupant Loans on < 5 Family Dwellings (A B C & D)
Number
Average Value
Number
Average Value
Number
Average Value
Number
Average Value
Number
Average Value
LOANS ORIGINATED
2
$138,380
24
$115,896
69
$107,315
7
$33,194
5
$104,488
APPLICATIONS APPROVED, NOT ACCEPTED
1
$83,770
5
$97,444
12
$123,555
1
$76,660
0
$0
APPLICATIONS DENIED
1
$71,630
12
$62,752
49
$107,176
7
$32,814
2
$90,575
APPLICATIONS WITHDRAWN
0
$0
3
$86,927
30
$114,118
0
$0
1
$53,280
FILES CLOSED FOR INCOMPLETENESS
0
$0
3
$90,873
3
$106,263
0
$0
1
$46,470
Aggregated Statistics For Year 2002 (Based on 2 partial tracts)
A) FHA, FSA/RHS & VA Home Purchase Loans
B) Conventional Home Purchase Loans
C) Refinancings
D) Home Improvement Loans
F) Non-occupant Loans on < 5 Family Dwellings (A B C & D)
Number
Average Value
Number
Average Value
Number
Average Value
Number
Average Value
Number
Average Value
LOANS ORIGINATED
3
$122,247
25
$99,124
42
$92,091
7
$29,557
4
$97,828
APPLICATIONS APPROVED, NOT ACCEPTED
0
$0
6
$79,575
7
$92,267
1
$21,020
0
$0
APPLICATIONS DENIED
2
$102,565
16
$57,184
28
$85,406
6
$27,677
0
$0
APPLICATIONS WITHDRAWN
0
$0
4
$110,630
26
$93,616
1
$31,080
0
$0
FILES CLOSED FOR INCOMPLETENESS
0
$0
1
$104,490
8
$95,941
0
$0
0
$0
Aggregated Statistics For Year 2001 (Based on 2 partial tracts)
A) FHA, FSA/RHS & VA Home Purchase Loans
B) Conventional Home Purchase Loans
C) Refinancings
D) Home Improvement Loans
F) Non-occupant Loans on < 5 Family Dwellings (A B C & D)
Number
Average Value
Number
Average Value
Number
Average Value
Number
Average Value
Number
Average Value
LOANS ORIGINATED
4
$108,040
23
$87,732
35
$78,584
5
$21,430
2
$71,780
APPLICATIONS APPROVED, NOT ACCEPTED
1
$97,380
6
$61,863
10
$66,896
1
$18,060
1
$87,910
APPLICATIONS DENIED
0
$0
15
$51,208
30
$67,182
9
$22,463
4
$56,610
APPLICATIONS WITHDRAWN
1
$64,530
4
$80,365
31
$83,539
5
$28,830
0
$0
FILES CLOSED FOR INCOMPLETENESS
0
$0
1
$63,050
7
$92,056
0
$0
0
$0
Aggregated Statistics For Year 2000 (Based on 2 partial tracts)
A) FHA, FSA/RHS & VA Home Purchase Loans
B) Conventional Home Purchase Loans
C) Refinancings
D) Home Improvement Loans
F) Non-occupant Loans on < 5 Family Dwellings (A B C & D)
Number
Average Value
Number
Average Value
Number
Average Value
Number
Average Value
Number
Average Value
LOANS ORIGINATED
5
$77,908
18
$67,636
19
$74,810
6
$22,497
3
$58,707
APPLICATIONS APPROVED, NOT ACCEPTED
1
$64,230
8
$66,748
6
$61,322
3
$31,573
1
$18,350
APPLICATIONS DENIED
0
$0
16
$54,704
25
$56,323
8
$27,232
0
$0
APPLICATIONS WITHDRAWN
1
$68,670
6
$61,322
18
$74,559
2
$46,325
1
$55,350
FILES CLOSED FOR INCOMPLETENESS
0
$0
0
$0
4
$71,262
1
$8,880
0
$0
Aggregated Statistics For Year 1999 (Based on 1 partial tract)
A) FHA, FSA/RHS & VA Home Purchase Loans
B) Conventional Home Purchase Loans
C) Refinancings
D) Home Improvement Loans
F) Non-occupant Loans on < 5 Family Dwellings (A B C & D)
Detailed PMIC statistics for the following Tracts:0116.00
2002 - 2018 National Fire Incident Reporting System (NFIRS) incidents
According to the data from the years 2002 - 2018 the average number of fires per year is 6. The highest number of fire incidents - 16 took place in 2007, and the least - 0 in 2015. The data has a declining trend.
When looking into fire subcategories, the most incidents belonged to: Structure Fires (36.0%), and Outside Fires (35.0%).
Fire incident types reported to NFIRS in Zip Code 12729


 Nearest zip codes: 12746, 10963, 12785, 12771, 12780, 12777.


 (Students: 577, Location: 929 RT 209, Grades: KG-6)

 According to the data from the years 2002 - 2018 the average number of fires per year is 6. The highest number of fire incidents - 16 took place in 2007, and the least - 0 in 2015. The data has a declining trend.
 When looking into fire subcategories, the most incidents belonged to: Structure Fires (36.0%), and Outside Fires (35.0%).