Estimated zip code population in 2022: 14,224 Zip code population in 2010: 14,511 Zip code population in 2000: 13,847
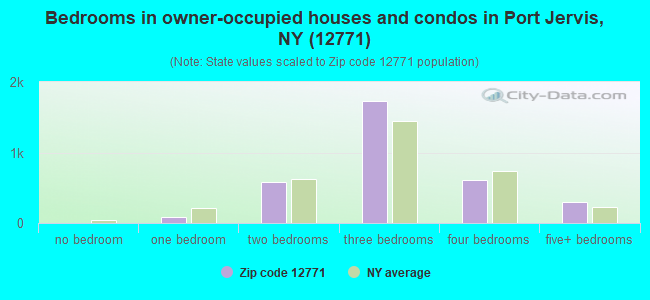
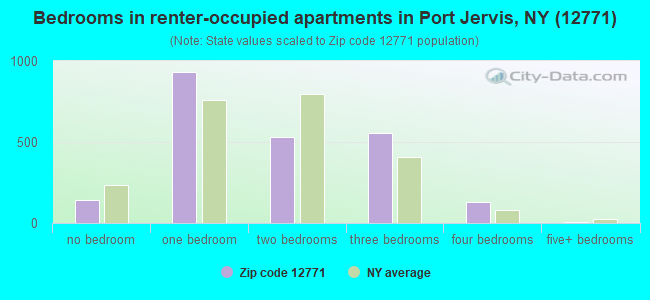
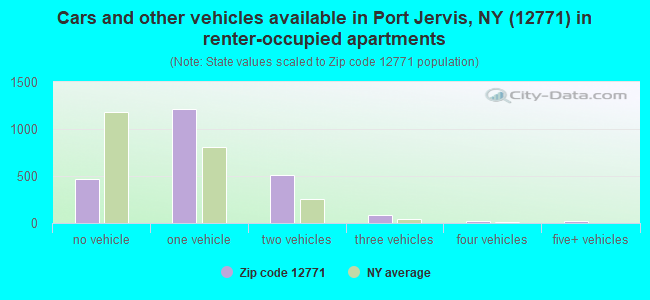
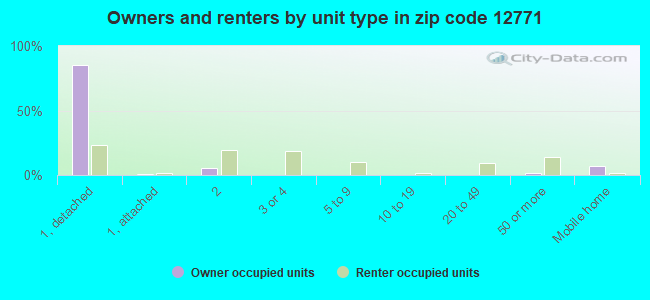
Houses and condos: 6,080 Renter-occupied apartments: 2,300
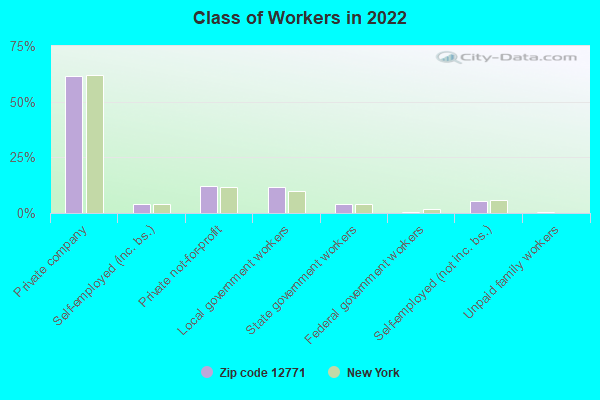
% of renters here:
41%
State:
46%
March 2022 cost of living index in zip code 12771: 132.8 (high, U.S. average is 100)
Land area: 34.6 sq. mi. Water area: 0.8 sq. mi.
Population density: 411 people per square mile
(low).
OSM Map
General Map
Google Map
MSN Map
OSM Map
General Map
Google Map
MSN Map
OSM Map
General Map
Google Map
MSN Map
OSM Map
General Map
Google Map
MSN Map
Please wait while loading the map...
Real estate property taxes paid for housing units in 2022:
This zip code:
2.5% ($5,740)
New York:
1.5% ($6,180)
Median real estate property taxes paid for housing units with mortgages in 2022: $6,842 (2.6%) Median real estate property taxes paid for housing units with no mortgage in 2022: $4,596 (2.3%)
Averages for the 2020 tax year for zip code 12771, filed in 2021:
Average Adjusted Gross Income (AGI) in 2020: $57,256 (Individual Income Tax Returns)
Here:
$57,256
State:
$90,930
Salary/wage: $49,925 (reported on 83.0% of returns)
Here:
$49,925
State:
$72,104
(% of AGI for various income ranges: 1058.9% for AGIs below $25k, 3358.0% for AGIs $25k-50k, 6336.8% for AGIs $50k-75k, 9107.4% for AGIs $75k-100k, 16467.3% for AGIs $100k-200k, 59190.0% for AGIs over 200k)
Taxable interest for individuals: $1,021 (reported on 28.3% of returns)
This zip code:
$1,021
New York:
$3,075
(% of AGI for various income ranges: 9.1% for AGIs below $25k, 11.3% for AGIs $25k-50k, 25.8% for AGIs $50k-75k, 51.0% for AGIs $75k-100k, 126.4% for AGIs $100k-200k, 873.3% for AGIs over 200k)
Ordinary dividends: $2,480 (reported on 14.7% of returns)
Here:
$2,480
State:
$11,095
(% of AGI for various income ranges: 17.7% for AGIs below $25k, 17.2% for AGIs $25k-50k, 43.4% for AGIs $50k-75k, 61.7% for AGIs $75k-100k, 149.8% for AGIs $100k-200k, 813.3% for AGIs over 200k)
Net capital gain/loss in AGI: +$8,916 (reported on 12.6% of returns)
Here:
+$8,916
State:
+$44,925
(% of AGI for various income ranges: 2.1% for AGIs below $25k, 17.1% for AGIs $25k-50k, 45.7% for AGIs $50k-75k, 88.6% for AGIs $75k-100k, 320.7% for AGIs $100k-200k, 8023.3% for AGIs over 200k)
Profit/loss from business: +$7,556 (reported on 10.5% of returns)
Here:
+$7,556
State:
+$14,940
(% of AGI for various income ranges: 75.6% for AGIs below $25k, 69.5% for AGIs $25k-50k, 117.3% for AGIs $50k-75k, 151.0% for AGIs $75k-100k, 178.2% for AGIs $100k-200k, 900.0% for AGIs over 200k)
Taxable individual retirement arrangement distribution: $14,686 (reported on 6.5% of returns)
12771:
$14,686
New York:
$19,609
(% of AGI for various income ranges: 26.9% for AGIs below $25k, 47.9% for AGIs $25k-50k, 147.2% for AGIs $50k-75k, 205.2% for AGIs $75k-100k, 386.2% for AGIs $100k-200k, 2011.7% for AGIs over 200k)
Total itemized deductions: $24,304 (reported on 6.8% of returns)
Here:
$24,304
State:
$39,326
(% of AGI for various income ranges: 29.3% for AGIs below $25k, 63.4% for AGIs $25k-50k, 283.6% for AGIs $50k-75k, 528.6% for AGIs $75k-100k, 667.6% for AGIs $100k-200k, 2895.0% for AGIs over 200k)
Charity contributions: $4,629 (reported on 5.2% of returns)
Here:
$4,629
State:
$15,420
(% of AGI for various income ranges: 6.7% for AGIs $25k-50k, 29.3% for AGIs $50k-75k, 78.8% for AGIs $75k-100k, 110.2% for AGIs $100k-200k, 610.0% for AGIs over 200k)
Taxes paid: $9,453 (reported on 6.7% of returns)
12771:
$9,453
State:
$9,183
(% of AGI for various income ranges: 9.2% for AGIs below $25k, 26.4% for AGIs $25k-50k, 121.9% for AGIs $50k-75k, 214.8% for AGIs $75k-100k, 265.3% for AGIs $100k-200k, 731.7% for AGIs over 200k)
Earned income credit: $2,152 (reported on 17.9% of returns)
Here:
$2,152
State:
$2,138
(% of AGI for various income ranges: 87.1% for AGIs below $25k, 73.7% for AGIs $25k-50k)
Percentage of individuals using paid preparers for their 2020 taxes: 95.3%
Here:
95%
State:
95%
(% for various income ranges: 94.3% for AGIs below $25k, 95.6% for AGIs $25k-50k, 96.0% for AGIs $50k-75k, 96.7% for AGIs $75k-100k, 94.4% for AGIs $100k-200k, 100.0% for AGIs over 200k)
Averages for the 2012 tax year for zip code 12771, filed in 2013:
Average Adjusted Gross Income (AGI) in 2012: $47,630 (Individual Income Tax Returns)
Here:
$47,630
State:
$77,088
Salary/wage: $43,831 (reported on 85.1% of returns)
Here:
$43,831
State:
$60,593
(% of AGI for various income ranges: 73.1% for AGIs below $25k, 81.7% for AGIs $25k-50k, 77.4% for AGIs $50k-75k, 79.0% for AGIs $75k-100k, 82.2% for AGIs $100k-200k, 62.9% for AGIs over 200k)
Taxable interest for individuals: $901 (reported on 32.9% of returns)
This zip code:
$901
New York:
$3,125
(% of AGI for various income ranges: 1.0% for AGIs below $25k, 0.4% for AGIs $25k-50k, 0.5% for AGIs $50k-75k, 0.4% for AGIs $75k-100k, 0.5% for AGIs $100k-200k, 1.8% for AGIs over 200k)
Ordinary dividends: $2,167 (reported on 16.9% of returns)
Here:
$2,167
State:
$10,299
(% of AGI for various income ranges: 1.2% for AGIs below $25k, 0.8% for AGIs $25k-50k, 0.7% for AGIs $50k-75k, 0.5% for AGIs $75k-100k, 0.6% for AGIs $100k-200k, 1.2% for AGIs over 200k)
Net capital gain/loss in AGI: +$3,765 (reported on 10.6% of returns)
Here:
+$3,765
State:
+$42,474
(% of AGI for various income ranges: 0.1% for AGIs $25k-50k, 0.2% for AGIs $50k-75k, 0.8% for AGIs $100k-200k, 6.9% for AGIs over 200k)
Profit/loss from business: +$9,500 (reported on 11.6% of returns)
Here:
+$9,500
State:
+$16,168
(% of AGI for various income ranges: 7.6% for AGIs below $25k, 2.5% for AGIs $25k-50k, 1.9% for AGIs $50k-75k, 1.9% for AGIs $75k-100k, 1.4% for AGIs $100k-200k)
Taxable individual retirement arrangement distribution: $11,764 (reported on 7.2% of returns)
12771:
$11,764
New York:
$17,621
(% of AGI for various income ranges: 2.4% for AGIs below $25k, 1.3% for AGIs $25k-50k, 1.7% for AGIs $50k-75k, 1.6% for AGIs $75k-100k, 2.4% for AGIs $100k-200k)
Self-employment retirement plans: $15,250 (reported on 0.3% of returns)
12771:
$15,250
New York:
$27,330
Total itemized deductions: $21,758 (24% of AGI, reported on 32.4% of returns)
Here:
$21,758
State:
$34,985
Here:
24.1% of AGI
State:
21.3% of AGI
(% of AGI for various income ranges: 7.6% for AGIs below $25k, 9.6% for AGIs $25k-50k, 15.5% for AGIs $50k-75k, 16.2% for AGIs $75k-100k, 18.6% for AGIs $100k-200k, 16.6% for AGIs over 200k)
Charity contributions: $2,130 (reported on 26.0% of returns)
Here:
$2,130
State:
$5,572
(% of AGI for various income ranges: 0.3% for AGIs below $25k, 0.8% for AGIs $25k-50k, 1.3% for AGIs $50k-75k, 1.3% for AGIs $75k-100k, 1.4% for AGIs $100k-200k, 1.6% for AGIs over 200k)
Taxes paid: $10,242 (reported on 32.4% of returns)
12771:
$10,242
State:
$18,656
(% of AGI for various income ranges: 2.7% for AGIs below $25k, 3.6% for AGIs $25k-50k, 6.3% for AGIs $50k-75k, 7.7% for AGIs $75k-100k, 9.6% for AGIs $100k-200k, 9.5% for AGIs over 200k)
Earned income credit: $2,301 (reported on 21.6% of returns)
Here:
$2,301
State:
$2,230
(% of AGI for various income ranges: 7.8% for AGIs below $25k, 1.2% for AGIs $25k-50k)
Percentage of individuals using paid preparers for their 2012 taxes: 64.2%
Here:
64%
State:
66%
(% for various income ranges: 59.4% for AGIs below $25k, 61.7% for AGIs $25k-50k, 67.5% for AGIs $50k-75k, 68.5% for AGIs $75k-100k, 78.6% for AGIs $100k-200k, 75.0% for AGIs over 200k)
Averages for the 2004 tax year for zip code 12771, filed in 2005:
Average Adjusted Gross Income (AGI) in 2004: $38,202 (Individual Income Tax Returns)
Here:
$38,202
State:
$59,519
Salary/wage: $36,145 (reported on 86.9% of returns)
Here:
$36,145
State:
$50,673
(% of AGI for various income ranges: 96.0% for AGIs below $10k, 77.3% for AGIs $10k-25k, 83.5% for AGIs $25k-50k, 86.2% for AGIs $50k-75k, 84.8% for AGIs $75k-100k, 76.4% for AGIs over 100k)
Taxable interest for individuals: $1,101 (reported on 42.4% of returns)
This zip code:
$1,101
New York:
$2,377
(% of AGI for various income ranges: 5.2% for AGIs below $10k, 2.1% for AGIs $10k-25k, 1.1% for AGIs $25k-50k, 0.6% for AGIs $50k-75k, 0.9% for AGIs $75k-100k, 1.3% for AGIs over 100k)
Taxable dividends: $1,677 (reported on 20.2% of returns)
Here:
$1,677
State:
$5,394
(% of AGI for various income ranges: 3.2% for AGIs below $10k, 1.2% for AGIs $10k-25k, 0.6% for AGIs $25k-50k, 0.5% for AGIs $50k-75k, 0.7% for AGIs $75k-100k, 1.2% for AGIs over 100k)
Net capital gain/loss: +$4,681 (reported on 13.8% of returns)
Here:
+$4,681
State:
+$23,581
(% of AGI for various income ranges: -1.4% for AGIs below $10k, 0.5% for AGIs $10k-25k, 0.1% for AGIs $25k-50k, 0.3% for AGIs $50k-75k, 2.0% for AGIs $75k-100k, 5.0% for AGIs over 100k)
Profit/loss from business: +$9,879 (reported on 11.7% of returns)
Here:
+$9,879
State:
+$13,809
(% of AGI for various income ranges: 4.9% for AGIs below $10k, 4.4% for AGIs $10k-25k, 3.7% for AGIs $25k-50k, 1.5% for AGIs $50k-75k, 1.0% for AGIs $75k-100k, 4.3% for AGIs over 100k)
IRA payment deduction: $2,605 (reported on 2.5% of returns)
12771:
$2,605
New York:
$3,115
(% of AGI for various income ranges: 0.2% for AGIs $10k-25k, 0.2% for AGIs $25k-50k, 0.2% for AGIs $50k-75k, 0.1% for AGIs $75k-100k, 0.2% for AGIs over 100k)
Self-employed pension: $11,737 (reported on 0.3% of returns)
Here:
$11,737
New York:
$19,016
Total itemized deductions: $17,951 (24% of AGI, reported on 30.0% of returns)
Here:
$17,951
State:
$25,864
Here:
24.3% of AGI
State:
21.9% of AGI
(% of AGI for various income ranges: 6.1% for AGIs below $10k, 7.3% for AGIs $10k-25k, 10.6% for AGIs $25k-50k, 16.1% for AGIs $50k-75k, 17.8% for AGIs $75k-100k, 17.1% for AGIs over 100k)
Charity contributions deductions: $2,077 (3% of AGI, reported on 27.3% of returns)
Here:
$2,077
State:
$4,439
Here:
2.7% of AGI
State:
3.6% of AGI
(% of AGI for various income ranges: 0.3% for AGIs below $10k, 0.8% for AGIs $10k-25k, 1.0% for AGIs $25k-50k, 1.6% for AGIs $50k-75k, 1.9% for AGIs $75k-100k, 1.9% for AGIs over 100k)
Total tax: $4,899 (reported on 72.1% of returns)
12771:
$4,899
State:
$11,730
(% of AGI for various income ranges: 2.4% for AGIs below $10k, 4.0% for AGIs $10k-25k, 6.9% for AGIs $25k-50k, 8.2% for AGIs $50k-75k, 9.6% for AGIs $75k-100k, 15.4% for AGIs over 100k)
Earned income credit: $1,616 (reported on 18.2% of returns)
Here:
$1,616
State:
$1,757
Percentage of individuals using paid preparers for their 2004 taxes: 69.2%
Here:
69%
State:
67%
(% for various income ranges: 61.6% for AGIs below $10k, 69.0% for AGIs $10k-25k, 70.2% for AGIs $25k-50k, 72.3% for AGIs $50k-75k, 73.4% for AGIs $75k-100k, 80.2% for AGIs over 100k)
Likely homosexual households (counted as self-reported same-sex unmarried-partner households)
Lesbian couples: 0.2% of all households
Gay men: 0.1% of all households
Household received Food Stamps/SNAP in the past 12 months: 941 Household did not receive Food Stamps/SNAP in the past 12 months: 4,668
Women who had a birth in the past 12 months: 196 (74 now married, 125 unmarried) Women who did not have a birth in the past 12 months: 3,056 (1,095 now married, 1,961 unmarried)
Housing units in zip code 12771 with a mortgage: 1,648 (130 second mortgage, 131 both second mortgage and home equity loan) Houses without a mortgage: 104
Median monthly owner costs for units with a mortgage: $1,929 Median monthly owner costs for units without a mortgage: $889
Residents with income below the poverty level in 2022:
This zip code:
18.1%
Whole state:
14.3%
Residents with income below 50% of the poverty level in 2022:
This zip code:
11.6%
Whole state:
6.8%
Median number of rooms in houses and condos:
Here:
6.3
State:
6.3
Median number of rooms in apartments:
Here:
4.0
State:
3.8
Notable locations in this zip code not listed on our city pages
Notable locations in zip code 12771: Smith Corners (A), Port Jervis Golf Club (B), Cejwin Camp (C), Port Jervis Wastewater Treatment Plant (D), Tri-State Christian Camp (E), New Hope Farms (F), Keiths Farm (G), Laurel Grove Greenhouse (H), Camp Hayes (I), Port Jervis Fire Department Excelsior Engine 5 (J), Port Jervis Fire Department Tri - State Hose Company 6 (K), Erie Depot Museum (L), Port Jervis Fireman Museum (M), Port Jervis Free Library (N), Orange County Youth Community Center (O), Port Jervis Fire Department Municipal Training Facility (P), Port Jervis Fire Engine Company 1 (Q), Port Jervis Fire Department Delaware Engine 2 (R), Port Jervis Fire Department Howard Wheat Engine 4 (S). Display/hide their locations on the map
Churches in zip code 12771 include: Temple Beth-El (A), Port Jervis Bible Baptist Church (B), Light of the World Christian Church (C), Greenville United Methodist Church (D), Grace Fellowship Church (E), Calvary Bible Church (F), First Assembly of God Church (G), Church of Most Sacred Heart (H), West End Reformed Church (I). Display/hide their locations on the map
Lakes and reservoirs: Snyder Pond (A), Walls Pond (B), Hawthorne Lake (C), Heintein Pond (D), Lake Arkin (E), Martin Lake (F), Willow Lake (G). Display/hide their locations on the map
Parks in zip code 12771 include: Childrens Memorial Park (1), Bell Memorial Field (2), West End Memorial Park (3), Church Street Park (4), Riverside Park (5), Orange Square (6), Elks Memorial Park (7). Display/hide their locations on the map
1,753 married couples with children.
865 single-parent households (312 men, 553 women).
85.1% of residents of 12771 zip code speak English at home.
7.8% of residents speak Spanish at home (71% very well, 17% well, 12% not well, 1% not at all).
3.9% of residents speak other Indo-European language at home (47% very well, 22% well, 20% not well, 11% not at all).
2.5% of residents speak Asian or Pacific Island language at home (33% very well, 50% well, 13% not well, 4% not at all).
0.5% of residents speak other language at home (62% very well, 38% well).
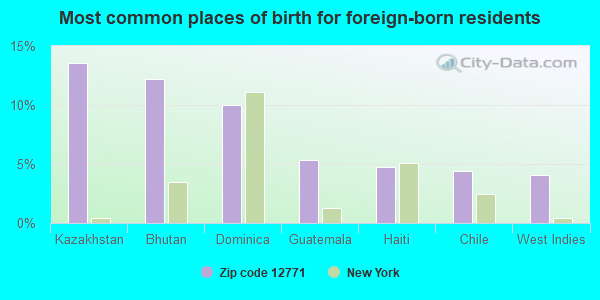
Foreign born population: 1,256 (8.8%) (59.0% of them are naturalized citizens)
This zip code:
8.8%
Whole state:
22.7%
14%Kazakhstan
12%Bhutan
10%Dominica
5%Guatemala
5%Haiti
4%Chile
4%West Indies
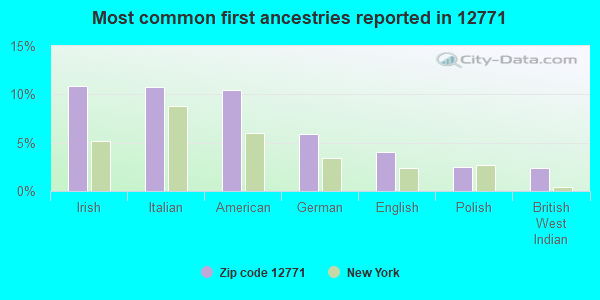
11%Irish
11%Italian
10%American
6%German
4%English
2%Polish
2%British West Indian
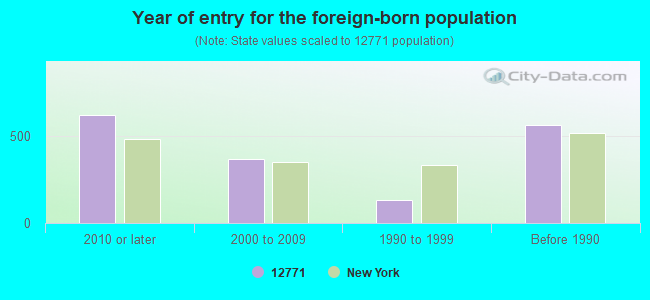
Year of entry for the foreign-born population
6202010 or later
3652000 to 2009
1331990 to 1999
563Before 1990
Major facilities with environmental interests located in this zip code:
H G I SKYDYNE (21 RIVER ROAD in PORT JERVIS, NY)
AIR MINOR (AIRS/AFS) STATE MASTER (New York facility tracking) - AIR PROGRAM, HAZARDOUS WASTE PROGRAM, National Pollutant Discharge Elimination System Permit ENFORCEMENT/COMPLIANCE ACTIVITY (Integrated Compliance Information System) - ICIS-02-1993-0069, FORMAL ENFORCEMENT ACTION (Integrated Compliance Information System) - ICIS-02-1993-0069, FORMAL ENFORCEMENT ACTION CRITERIA AND HAZARDOUS AIR POLLUTANT INVENTORY (Inventory of air pollution sources) TRI REPORTER (Tracking of toxic chemicals releasing facilities) Business SIC classification: WOOD PRODUCTS; FABRICATED RUBBER PRODUCTS; FABRICATED METAL PRODUCTS Organizations: HORNET GROUP INC (AIR PERMITTING FACILITY OWNER CONTACT)
Alternative names: AAR CORPORATION, AAR CORPORATION SKYDYNE DIVISION, SKYDYNE DIV. OF AAR BROOKS & PERKINS
A & W PRODUCTS CO INC (GARDNER ST in PORT JERVIS, NY)
(Integrated Compliance Information System) - ICIS-02-2001-9204, FORMAL ENFORCEMENT ACTION COMPLIANCE ACTIVITY (Tracking inspections of insecticide, fungicide, and rodenticide, and toxic substances) (Resource Conservation and Recovery Act (tracking hazardous waste)) Business SIC classification: PLASTICS PIPE; PLASTICS PRODUCTS Business NAICS classification: OFFICE MACHINERY MANUFACTURING.; PEN AND MECHANICAL PENCIL MANUFACTURING. Organizations: A&W PRODUCTS CO INC (CONTACT/OWNER)
A & L MAJESTIC CLEANERS (92 FRONT ST in PORT JERVIS, NY)
STATE MASTER (New York facility tracking) - AIR PROGRAM Small Quantity Generators, between 100 kg and 1000 kg of hazardous waste/month (Resource Conservation and Recovery Act (tracking hazardous waste)) - notification Business SIC classification: DRYCLEANING PLANTS, EXCEPT RUG CLEANING Business NAICS classification: DRYCLEANING AND LAUNDRY SERVICES (EXCEPT COIN-OPERATED). Organizations: A&L MAJESTIC CLEANERS LLC, TERRENCE A FITZSIMMONS (CONTACT/OWNER)
, A&L MAJESTIC CLEANERS LLC (LEGALLY RESPONSIBLE PARTY)
Alternative names: MAJESTIC DRY CLEANERS & TUXEDOS
GILLINDER BROTHERS (ERIE AND LIBERTY STREETS in PORT JERVIS, NY)
STATE MASTER (New York facility tracking) - AIR PROGRAM, COMPLIANCE ACTIVITY (Tracking inspections of insecticide, fungicide, and rodenticide, and toxic substances) CRITERIA AND HAZARDOUS AIR POLLUTANT INVENTORY (Inventory of air pollution sources) TRI REPORTER (Tracking of toxic chemicals releasing facilities) Business SIC and NAICS classification: PRESSED AND BLOWN GLASS AND GLASSWARE Organizations: GILLINDER BROTHERS INC (LEGALLY RESPONSIBLE PARTY)
COACHMAN CARTING INC OFFICES (HAMILTON ST in PORT JERVIS, NY)
STATE MASTER (New York facility tracking) - SOLID WASTE PROGRAM TRANSPORTER (Resource Conservation and Recovery Act (tracking hazardous waste)) - notification Organizations: BARBARA LITRENTA (CONTACT/OWNER)
ANNA S. KUHL ES (10 RT 209 in PORT JERVIS, NY)
(National Center for Education Statistics) - STATE ID-441800050001 Organizations: PORT JERVIS CITY SD (SCHOOL DISTRICT)
ADVANCED SYSTEM MANUFACTURING (3642 CENTER ST in PORT JERVIS, NY)
(Resource Conservation and Recovery Act (tracking hazardous waste))
ARTWORK REPRODUCTIONS INC (43-45 BALL ST in PORT JERVIS, NY)
(Resource Conservation and Recovery Act (tracking hazardous waste))
H G I SKYDYNE HORNET GROUP INC (100 RIVER RD in PORT JERVIS, NY)
Small Quantity Generators, between 100 kg and 1000 kg of hazardous waste/month (Resource Conservation and Recovery Act (tracking hazardous waste)) TRANSPORTER (Resource Conservation and Recovery Act (tracking hazardous waste)) - notification Alternative names: SKYDYNE DIV OF BROOKS & PERKINS INC, SKYDYNE DIV OF BROOKS & PERKINS INC
HAN CORP (500 NEVERSINK DR in PORT JERVIS, NY)
(Resource Conservation and Recovery Act (tracking hazardous waste))
CONRAIL C&S PORT JERVIS (75 PIKE ST in PORT JERVIS, NY)
(Resource Conservation and Recovery Act (tracking hazardous waste))
CONRAIL PORT JERVIS LOCOMOTIVE (PIKE ST KMART PLAZA in PORT JERVIS, NY)
(Resource Conservation and Recovery Act (tracking hazardous waste))
CONTEL OF NEW YORK PLANT CTR (RTE 6 in PORT JERVIS, NY)
(Resource Conservation and Recovery Act (tracking hazardous waste))
Housing units lacking complete plumbing facilities: 2.7% Housing units lacking complete kitchen facilities: 2.4%
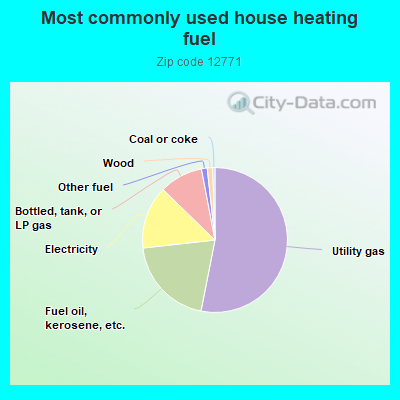
53.0%Utility gas
20.1%Fuel oil, kerosene, etc.
14.0%Electricity
9.7%Bottled, tank, or LP gas
1.3%Other fuel
1.2%Wood
0.5%Coal or coke
Population in 1990: 14,959.
Place of birth for U.S.-born residents:
This state: 9,945
Northeast: 1,787
Midwest: 141
South: 566
West: 97
61% of the 12771 zip code residents lived in the same house 5 years ago. Out of people who lived in different houses, 74% lived in this county. Out of people who lived in different counties, 50% lived in New York.
89% of the 12771 zip code residents lived in the same house 1 year ago. Out of people who lived in different houses, 44% moved from this county. Out of people who lived in different houses, 34% moved from different county within same state. Out of people who lived in different houses, 13% moved from different state. Out of people who lived in different houses, 9% moved from abroad.
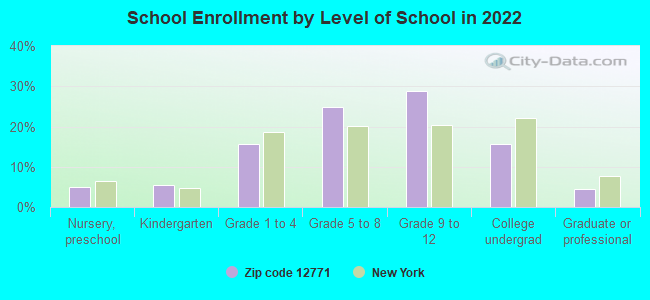
Private vs. public school enrollment:
Students in private schools in grades 1 to 8 (elementary and middle school): 147
Here:
11.4%
New York:
15.6%
Students in private schools in grades 9 to 12 (high school): 110
Here:
11.9%
New York:
15.0%
Students in private undergraduate colleges: 120
Here:
24.2%
New York:
39.2%
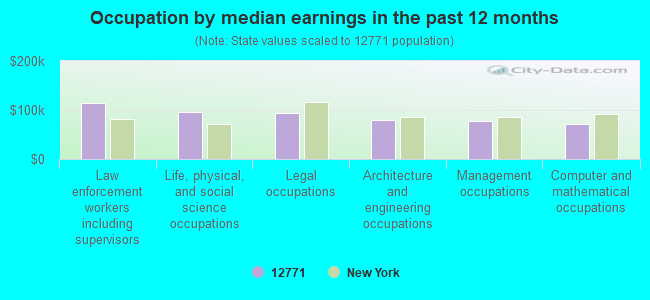
Occupation by median earnings in the past 12 months ($)
113,514Law enforcement workers including supervisors
95,407Life, physical, and social science occupations
93,578Legal occupations
79,337Architecture and engineering occupations
78,409Management occupations
70,677Computer and mathematical occupations
Companies with federal contracts located in this zip code (PORT JERVIS, NY):
HORNET GROUP INC (100 RIVER ROAD; small business) 50 employees, $0 revenue. : $5,678,405 in 95 contractsfrom 2002 to 2006
Contracts for Memorials: Cemeterial and Mortuary Equipment and Supplies, Medicated Cosmetics and Toiletries, Specialized Shipping and Storage Containers, Optical Sighting and Ranging Equipment, and moreby Defense Logistics Agency, Bureau of Land Management, Federal Supply Service Signed by year:2000: $0; 2001: $0; 2002: $92,772; 2003: $851,640; 2004: $2,250,441; 2005: $2,306,018; 2006: $177,534.
Biggest contracts:
$1,089,000 with Defense Logistics Agency for Memorials: Cemeterial and Mortuary Equipment and Supplies. Signed on 2004-04-27. Completion date: 2004-08-25.
$801,792, same as above.Signed on 2005-01-14. Completion date: 2005-04-01.
$482,927 with Defense Logistics Agency for Medicated Cosmetics and Toiletries. Taking place in PA. Signed on 2005-10-28. Completion date: 2006-02-04.
$335,648 with Defense Logistics Agency for Memorials: Cemeterial and Mortuary Equipment and Supplies. Signed on 2004-10-13. Completion date: 2004-11-22.
HGI SKYDYNE (100 RIVER ROAD; small business) : $678,741 in 37 contractsfrom 2002 to 2006
Contracts for Vehicular Furniture and Accessories, Boxes, Cartons, and Crates, Specialized Shipping and Storage Containers, Optical Sighting and Ranging Equipment, and moreby Army, Bureau of Land Management, Navy, Air Force, and others Signed by year:2000: $0; 2001: $0; 2002: $0; 2003: $128,713; 2004: $125,531; 2005: $366,624; 2006: $57,873.
Biggest contracts:
$68,354 with Army for Vehicular Furniture and Accessories. Signed on 2005-09-27. Completion date: 2006-05-31.
$54,800 with Army for Boxes, Cartons, and Crates. Signed on 2006-03-24. Completion date: 2007-03-25.
$51,800 with Bureau of Land Management for Specialized Shipping and Storage Containers. Signed on 2003-10-22. Effective on 2003-10-21. Completion date: 2003-12-31.
$48,768 with Navy for Specialized Shipping and Storage Containers. Taking place in MD. Signed on 2005-06-08. Completion date: 2005-08-05.
HGI SKYDYNE (HGI SKYDYNE; small business) : $370,090 in 8 contractsfrom 1999 to 2002
Contracts for Specialized Shipping and Storage Containers, Tents and Tarpaulins, Miscellaneous Machine Tools, Miscellaneous Electrical and Electronic Components, and moreby Navy, Air Force, Defense Logistics Agency Signed by year:2000: $108,966; 2001: $55,030; 2002: $134,236; 2003: $0; 2004: $0; 2005: $0; 2006: $0.
Biggest contracts:
$96,929 with Navy for Specialized Shipping and Storage Containers. Taking place in MD. Signed on 2002-09-18. Completion date: 2002-11-13.
$71,858 with Air Force for Tents and Tarpaulins. Taking place in IL. Signed on 1999-12-03. Completion date: 2000-02-14.
$41,125 with Navy for Miscellaneous Machine Tools. Taking place in MD. Signed on 2000-11-22. Completion date: 2001-01-18.
$37,307 with Navy for Specialized Shipping and Storage Containers. Taking place in MD. Signed on 2002-06-18. Completion date: 2002-08-05.
HGI DISTRIBUTION, INC (86 FOWLER ST; small business) : $311,092 in 11 contractsfrom 2004 to 2006
Contracts for Other Housekeeping Services, Engineering and Technical Services by Army, Bureau of Prisoners/Federal Prison System Signed by year:2000: $0; 2001: $0; 2002: $0; 2003: $0; 2004: $130,561; 2005: $154,745; 2006: $25,786.
Biggest contracts:
$102,790 with Army for Other Housekeeping Services. Signed on 2004-01-20. Completion date: 2004-09-30.
$60,000, same as above.Signed on 2005-01-20. Completion date: 2004-09-30.
$60,000, same as above.Signed on 2005-03-21. Completion date: 2004-09-30.
$26,200, same as above.Signed on 2004-09-27. Completion date: 2004-09-30.
GILLINDER BROS INC (ERIE & LIBERTY STS; small business) : $238,340 in 22 contractsfrom 2003 to 2006
Contracts for Indoor and Outdoor Electric Lighting Fixtures, Electric Vehicular Lights and Fixtures, Night Vision Equipment, Emitted and Reflected Radiation, Hardware, Commercial, and moreby Defense Logistics Agency, Navy Signed by year:2000: $0; 2001: $0; 2002: $0; 2003: $37,500; 2004: $31,108; 2005: $124,145; 2006: $45,587.
Biggest contracts:
$37,500 with Defense Logistics Agency for Indoor and Outdoor Electric Lighting Fixtures. Signed on 2003-11-13. Completion date: 2004-01-14.
$26,749, same as above.Signed on 2005-01-13. Completion date: 2005-03-14.
$23,589 with Navy for Indoor and Outdoor Electric Lighting Fixtures. Signed on 2005-04-12. Completion date: 2005-05-05.
$20,119 with Defense Logistics Agency for Electric Vehicular Lights and Fixtures. Signed on 2006-04-06. Completion date: 2006-06-06.
TOTAL COMPUTER SOLUTIONS INC (5 PROSPECT STREET; small business) : $196,747 in 3 contractsfrom 2003 to 2005
$114,330 with Army for Maintenance, Repair and Rebuilding of Equipment -- Instruments and Laboratory Equipment. Taking place in NJ. Signed on 2004-11-15. Completion date: 2005-11-15.
$111,000 with Army for Maintenance, Repair and Rebuilding of Equipment -- Instruments and Laboratory Equipment. Signed on 2003-11-07. Completion date: 2004-11-08.
-$28,583 with Army for Maintenance, Repair and Rebuilding of Equipment -- Instruments and Laboratory Equipment. Taking place in NJ. Signed on 2005-09-13. Completion date: 2005-11-15.
HGI SKYDYNE INC (100 RIVER RD; small business) : $119,060 in 5 contractsin 2006
Contracts for Memorials: Cemeterial and Mortuary Equipment and Supplies, Specialized Shipping and Storage Containers, Electrical Hardware and Supplies by Defense Logistics Agency, U.S. Special Operations Command, Bureau of Land Management Signed by year:2000: $0; 2001: $0; 2002: $0; 2003: $0; 2004: $0; 2005: $0; 2006: $119,060.
Biggest contracts:
$89,295 with Defense Logistics Agency for Memorials: Cemeterial and Mortuary Equipment and Supplies. Signed on 2006-04-06. Completion date: 2006-10-10.
$12,859 with U.S. Special Operations Command for Specialized Shipping and Storage Containers. Taking place in NC. Signed on 2006-06-27. Completion date: 2006-08-11.
$10,455 with Defense Logistics Agency for Specialized Shipping and Storage Containers. Signed on 2006-04-11. Completion date: 2006-05-27.
$3,353 with Bureau of Land Management for Specialized Shipping and Storage Containers. Taking place in AK. Signed on 2006-02-21. Completion date: 2006-04-15.
Top industries in this zip code by the number of employees in 2005:
Health Care and Social Assistance: General Medical and Surgical Hospitals (500-999 employees: 1 establishment)
2002 - 2018 National Fire Incident Reporting System (NFIRS) incidents
Based on the data from the years 2002 - 2018 the average number of fires per year is 23. The highest number of fires - 66 took place in 2002, and the least - 2 in 2006. The data has a declining trend.
When looking into fire subcategories, the most incidents belonged to: Structure Fires (41.5%), and Outside Fires (27.8%).
Fire incident types reported to NFIRS in Zip Code 12771


 Nearest zip codes: 12746, 10998, 12729, 10988, 10933, 18336.
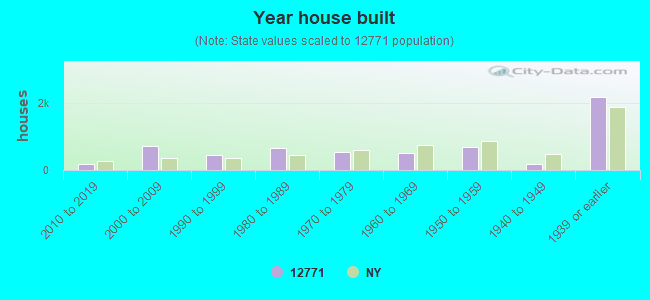


 Based on the data from the years 2002 - 2018 the average number of fires per year is 23. The highest number of fires - 66 took place in 2002, and the least - 2 in 2006. The data has a declining trend.
 When looking into fire subcategories, the most incidents belonged to: Structure Fires (41.5%), and Outside Fires (27.8%).