Estimated zip code population in 2022: 590 Zip code population in 2010: 937 Zip code population in 2000: 1,144
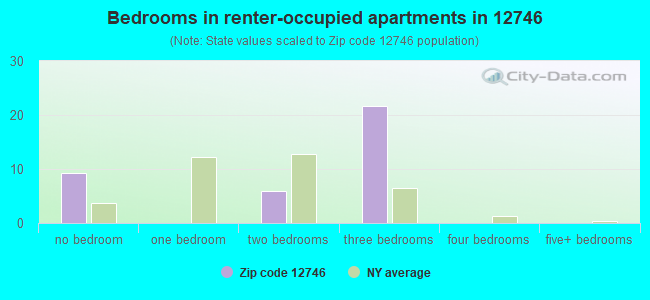
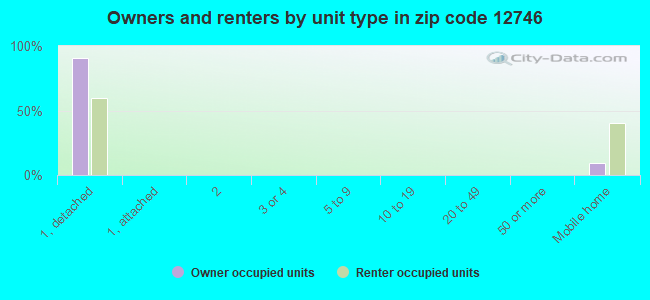
Houses and condos: 281 Renter-occupied apartments: 35
% of renters here:
14%
State:
46%
March 2022 cost of living index in zip code 12746: 116.7 (more than average, U.S. average is 100)
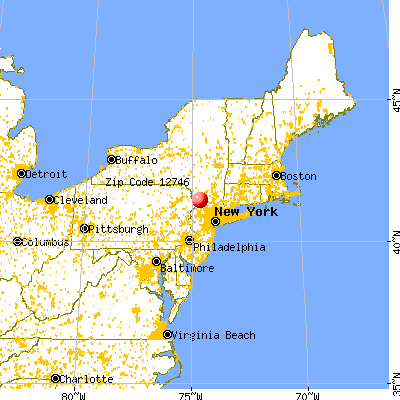
Land area: 14.2 sq. mi. Water area: 0.3 sq. mi.
Population density: 42 people per square mile
(very low).
OSM Map
General Map
Google Map
MSN Map
OSM Map
General Map
Google Map
MSN Map
OSM Map
General Map
Google Map
MSN Map
OSM Map
General Map
Google Map
MSN Map
Please wait while loading the map...
Real estate property taxes paid for housing units in 2022:
This zip code:
1.5% ($3,411)
New York:
1.5% ($6,180)
Median real estate property taxes paid for housing units with mortgages in 2022: $5,853 (2.3%) Median real estate property taxes paid for housing units with no mortgage in 2022: $2,332 (1.6%)
Business Search- 14 Million verified businesses
Males: 337
(57.2%)
Females: 252
(42.8%)
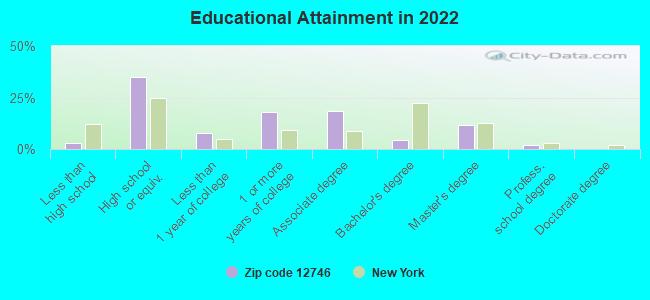
For population 25 years and over in 12746:
High school or higher: 95.7%
Bachelor's degree or higher: 17.8%
Graduate or professional degree: 13.4%
Unemployed: 5.6%
Mean travel time to work (commute): 27.6 minutes
For population 15 years and over in 12746:
Never married: 34.9%
Now married: 45.3%
Separated: 2.1%
Widowed: 11.3%
Divorced: 6.5%
Zip code 12746 compared to state average:
Median house value below state average.
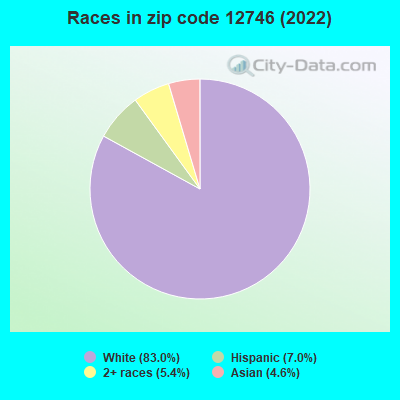
Black race population percentage significantly below state average.
Hispanic race population percentage below state average.
Foreign-born population percentage significantly below state average.
Renting percentage significantly below state average.
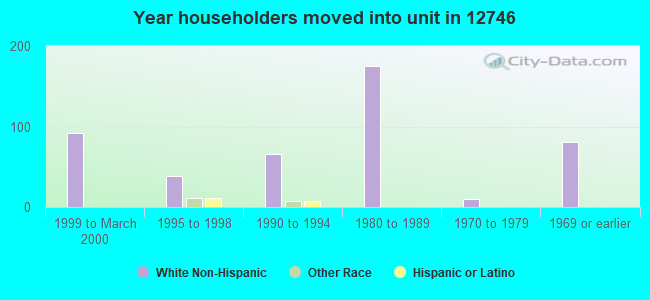
Length of stay since moving in significantly above state average.
House age below state average.
Number of college students significantly below state average.
Percentage of population with a bachelor's degree or higher below state average.
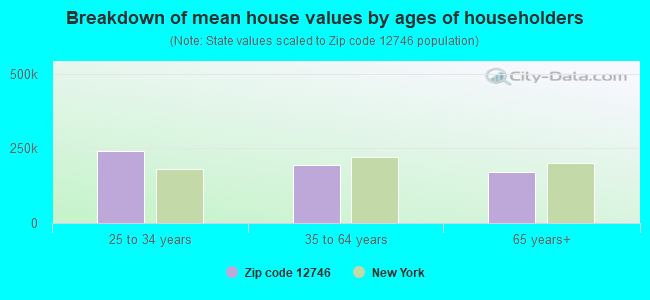
Estimated median house/condo value in 2022: $227,147
12746:
$227,147
New York:
$400,400
Median resident age:
This zip code:
39.6 years
New York median age:
40.0 years
Average household size:
This zip code:
2.2 people
New York:
2.5 people
Averages for the 2020 tax year for zip code 12746, filed in 2021:
Average Adjusted Gross Income (AGI) in 2020: $54,287 (Individual Income Tax Returns)
Here:
$54,287
State:
$90,930
Salary/wage: $48,464 (reported on 77.8% of returns)
Here:
$48,464
State:
$72,104
(% of AGI for various income ranges: 780.8% for AGIs below $25k, 3488.0% for AGIs $25k-50k, 7111.7% for AGIs $50k-75k, 8205.0% for AGIs $75k-100k, 13968.3% for AGIs $100k-200k)
Taxable interest for individuals: $415 (reported on 37.0% of returns)
This zip code:
$415
New York:
$3,075
(% of AGI for various income ranges: 12.5% for AGIs below $25k, 6.0% for AGIs $25k-50k, 38.3% for AGIs $50k-75k, 35.0% for AGIs $75k-100k, 41.7% for AGIs $100k-200k)
Ordinary dividends: $844 (reported on 16.7% of returns)
Here:
$844
State:
$11,095
(% of AGI for various income ranges: 20.0% for AGIs below $25k, 46.7% for AGIs $50k-75k, 40.0% for AGIs $100k-200k)
Net capital gain/loss in AGI: +$740 (reported on 9.3% of returns)
Here:
+$740
State:
+$44,925
(% of AGI for various income ranges: 3.0% for AGIs $25k-50k, 85.0% for AGIs $75k-100k)
Profit/loss from business: +$6,543 (reported on 13.0% of returns)
Here:
+$6,543
State:
+$14,940
(% of AGI for various income ranges: 164.2% for AGIs below $25k, 261.0% for AGIs $25k-50k)
Taxable individual retirement arrangement distribution: $14,250 (reported on 7.4% of returns)
12746:
$14,250
New York:
$19,609
(% of AGI for various income ranges: 950.0% for AGIs $50k-75k)
Total itemized deductions: $23,967 (reported on 5.6% of returns)
Here:
$23,967
State:
$39,326
(% of AGI for various income ranges: 1198.3% for AGIs $50k-75k)
Charity contributions: $3,950 (reported on 3.7% of returns)
Here:
$3,950
State:
$15,420
(% of AGI for various income ranges: 131.7% for AGIs $50k-75k)
Taxes paid: $9,600 (reported on 5.6% of returns)
12746:
$9,600
State:
$9,183
(% of AGI for various income ranges: 480.0% for AGIs $50k-75k)
Earned income credit: $1,725 (reported on 14.8% of returns)
Here:
$1,725
State:
$2,138
(% of AGI for various income ranges: 70.0% for AGIs below $25k, 54.0% for AGIs $25k-50k)
Percentage of individuals using paid preparers for their 2020 taxes: 98.1%
Here:
98%
State:
95%
(% for various income ranges: 100.0% for AGIs below $25k, 100.0% for AGIs $25k-50k, 100.0% for AGIs $50k-75k, 100.0% for AGIs $75k-100k, 88.9% for AGIs $100k-200k)
Averages for the 2012 tax year for zip code 12746, filed in 2013:
Average Adjusted Gross Income (AGI) in 2012: $44,600 (Individual Income Tax Returns)
Here:
$44,600
State:
$77,088
Salary/wage: $42,172 (reported on 82.1% of returns)
Here:
$42,172
State:
$60,593
(% of AGI for various income ranges: 68.2% for AGIs below $25k, 76.5% for AGIs $25k-50k, 78.6% for AGIs $50k-75k, 78.3% for AGIs $75k-100k, 81.0% for AGIs $100k-200k)
Taxable interest for individuals: $452 (reported on 37.5% of returns)
This zip code:
$452
New York:
$3,125
(% of AGI for various income ranges: 0.4% for AGIs below $25k, 1.3% for AGIs $25k-50k, 0.3% for AGIs $50k-75k)
Ordinary dividends: $1,070 (reported on 17.9% of returns)
Here:
$1,070
State:
$10,299
(% of AGI for various income ranges: 1.1% for AGIs below $25k, 1.0% for AGIs $25k-50k, 0.2% for AGIs $75k-100k, 0.3% for AGIs $100k-200k)
Profit/loss from business: +$5,680 (reported on 8.9% of returns)
Here:
+$5,680
State:
+$16,168
Taxable individual retirement arrangement distribution: $9,275 (reported on 7.1% of returns)
12746:
$9,275
New York:
$17,621
Total itemized deductions: $18,585 (25% of AGI, reported on 35.7% of returns)
Here:
$18,585
State:
$34,985
Here:
24.8% of AGI
State:
21.3% of AGI
(% of AGI for various income ranges: 17.1% for AGIs $25k-50k, 19.6% for AGIs $50k-75k, 14.3% for AGIs $75k-100k, 16.5% for AGIs $100k-200k)
Charity contributions: $1,644 (reported on 28.6% of returns)
Here:
$1,644
State:
$5,572
(% of AGI for various income ranges: 0.8% for AGIs $25k-50k, 1.7% for AGIs $50k-75k, 0.7% for AGIs $75k-100k, 1.4% for AGIs $100k-200k)
Taxes paid: $8,995 (reported on 33.9% of returns)
12746:
$8,995
State:
$18,656
(% of AGI for various income ranges: 6.3% for AGIs $25k-50k, 8.1% for AGIs $50k-75k, 7.4% for AGIs $75k-100k, 8.6% for AGIs $100k-200k)
Earned income credit: $1,844 (reported on 16.1% of returns)
Here:
$1,844
State:
$2,230
(% of AGI for various income ranges: 4.6% for AGIs below $25k, 0.7% for AGIs $25k-50k)
Percentage of individuals using paid preparers for their 2012 taxes: 62.5%
Here:
62%
State:
66%
(% for various income ranges: 56.5% for AGIs below $25k, 61.5% for AGIs $25k-50k, 62.5% for AGIs $50k-75k, 83.3% for AGIs $75k-100k, 66.7% for AGIs $100k-200k)
Averages for the 2004 tax year for zip code 12746, filed in 2005:
Average Adjusted Gross Income (AGI) in 2004: $39,802 (Individual Income Tax Returns)
Here:
$39,802
State:
$59,519
Salary/wage: $38,171 (reported on 87.8% of returns)
Here:
$38,171
State:
$50,673
(% of AGI for various income ranges: 85.7% for AGIs below $10k, 76.0% for AGIs $10k-25k, 83.9% for AGIs $25k-50k, 86.4% for AGIs $50k-75k, 84.6% for AGIs $75k-100k, 83.9% for AGIs over 100k)
Taxable interest for individuals: $617 (reported on 45.4% of returns)
This zip code:
$617
New York:
$2,377
(% of AGI for various income ranges: 2.6% for AGIs below $10k, 3.0% for AGIs $10k-25k, 0.3% for AGIs $25k-50k, 0.7% for AGIs $50k-75k, 0.4% for AGIs $75k-100k, 0.2% for AGIs over 100k)
Taxable dividends: $521 (reported on 16.2% of returns)
Here:
$521
State:
$5,394
(% of AGI for various income ranges: 1.0% for AGIs $10k-25k, 0.2% for AGIs $25k-50k, 0.1% for AGIs $50k-75k, 0.2% for AGIs $75k-100k)
Net capital gain/loss: +$346 (reported on 9.0% of returns)
Here:
+$346
State:
+$23,581
(% of AGI for various income ranges: -0.9% for AGIs $10k-25k, -0.3% for AGIs $50k-75k, 1.1% for AGIs $75k-100k)
Profit/loss from business: +$3,679 (reported on 9.6% of returns)
Here:
+$3,679
State:
+$13,809
Total itemized deductions: $16,424 (25% of AGI, reported on 35.3% of returns)
Here:
$16,424
State:
$25,864
Here:
24.5% of AGI
State:
21.9% of AGI
(% of AGI for various income ranges: 7.7% for AGIs $10k-25k, 14.0% for AGIs $25k-50k, 13.8% for AGIs $50k-75k, 18.9% for AGIs $75k-100k, 17.1% for AGIs over 100k)
Charity contributions deductions: $1,719 (2% of AGI, reported on 30.6% of returns)
Here:
$1,719
State:
$4,439
Here:
2.4% of AGI
State:
3.6% of AGI
(% of AGI for various income ranges: 0.4% for AGIs $10k-25k, 1.3% for AGIs $25k-50k, 1.5% for AGIs $50k-75k, 1.7% for AGIs $75k-100k, 1.1% for AGIs over 100k)
Total tax: $4,489 (reported on 75.4% of returns)
12746:
$4,489
State:
$11,730
(% of AGI for various income ranges: 2.1% for AGIs below $10k, 3.6% for AGIs $10k-25k, 6.4% for AGIs $25k-50k, 8.6% for AGIs $50k-75k, 9.6% for AGIs $75k-100k, 13.8% for AGIs over 100k)
Earned income credit: $1,600 (reported on 14.6% of returns)
Here:
$1,600
State:
$1,757
Percentage of individuals using paid preparers for their 2004 taxes: 62.8%
Here:
63%
State:
67%
(% for various income ranges: 55.4% for AGIs below $10k, 62.2% for AGIs $10k-25k, 64.6% for AGIs $25k-50k, 64.5% for AGIs $50k-75k, 68.5% for AGIs $75k-100k, 70.4% for AGIs over 100k)
Household received Food Stamps/SNAP in the past 12 months: 12 Household did not receive Food Stamps/SNAP in the past 12 months: 233
Women who had a birth in the past 12 months: 10 (10 now married, 0 unmarried) Women who did not have a birth in the past 12 months: 102 (45 now married, 57 unmarried)
Housing units in zip code 12746 with a mortgage: 120 (8 second mortgage, 8 both second mortgage and home equity loan) Residents with income below the poverty level in 2022:
This zip code:
7.2%
Whole state:
14.3%
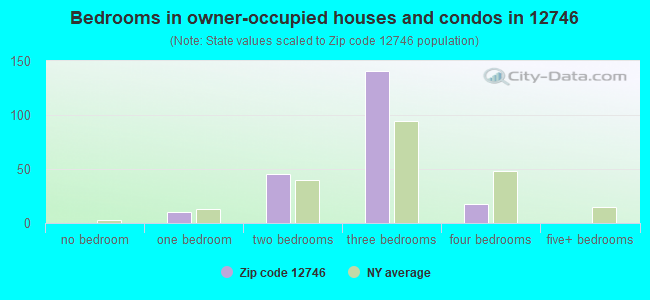
Median number of rooms in houses and condos:
Here:
5.3
State:
6.3
Median number of rooms in apartments:
Here:
4.7
State:
3.8
Notable locations in this zip code not listed on our city pages
Lakes, reservoirs, and swamps: Big Pond (A), Reservoir Number Two (B), Reservoir Number One (C), Round Swamp (D), Steeny Kill Swamp (E). Display/hide their locations on the map
In group quarters: 40 (-1 institutionalized population)
Size of family households: 54 2-persons, 41 3-persons, 20 5-persons, 11 7-or-more-persons
Size of nonfamily households: 111 1-person, 12 2-persons
77 married couples with children.
16 single-parent households (16 men).
89.6% of residents of 12746 zip code speak English at home.
3.5% of residents speak Spanish at home (100% very well).
7.1% of residents speak Asian or Pacific Island language at home (100% very well).
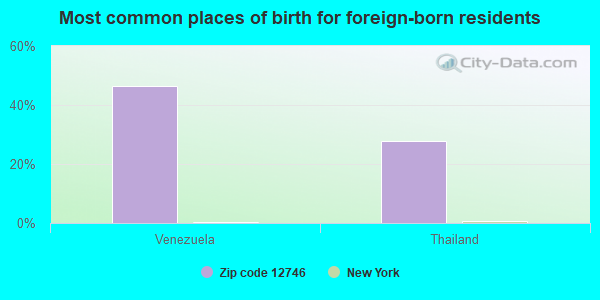
Foreign born population: 43 (7.4%) (73.7% of them are naturalized citizens)
This zip code:
7.4%
Whole state:
22.7%
47%Venezuela
28%Thailand
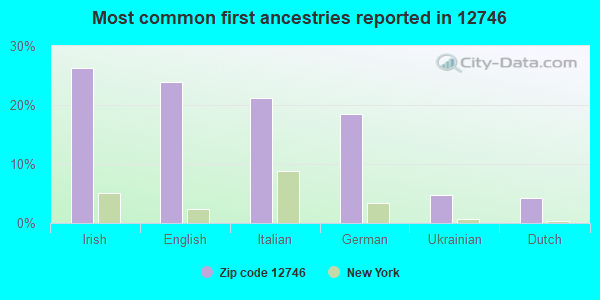
26%Irish
24%English
21%Italian
18%German
5%Ukrainian
4%Dutch
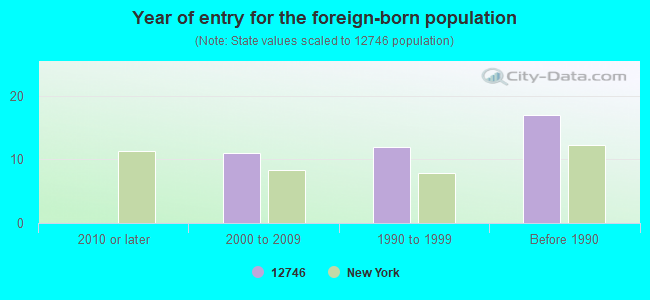
Year of entry for the foreign-born population
02010 or later
112000 to 2009
121990 to 1999
17Before 1990
Facilities with environmental interests located in this zip code:
C & D TECHNOLOGIES - MOTIVE POWER (RT 209 BLDG 430 in HUGUENOT, NY)
AIR SYNTHETIC MINOR (AIRS/AFS) STATE MASTER (New York facility tracking) - National Pollutant Discharge Elimination System Permit, AIR PROGRAM, National Pollutant Discharge Elimination System Permit, HAZARDOUS WASTE PROGRAM (Integrated Compliance Information System) - ICIS-02-1986-0323, FORMAL ENFORCEMENT ACTION CRITERIA AND HAZARDOUS AIR POLLUTANT INVENTORY (Inventory of air pollution sources) National Pollutant Discharge Elimination System NON-MAJOR (Tracking pollutant discharge elimination systems) - permit HAZARDOUS WASTE BIENNIAL REPORTER (Resource Conservation and Recovery Act (tracking hazardous waste)) Large Quantity Generators, more that 1000 kg of hazardous waste/month (Resource Conservation and Recovery Act (tracking hazardous waste)) - notification TSD (Resource Conservation and Recovery Act (tracking hazardous waste)) - notification TRI REPORTER (Tracking of toxic chemicals releasing facilities) Business SIC classification: STORAGE BATTERIES; BUSINESS SERVICES Business NAICS classification: STORAGE BATTERY MANUFACTURING.; STORAGE BATTERY MANUFACTURING. Organizations: C & D TECHNOLOGIES INC (CONTACT/OPERATOR)
, C & D TECHNOLOGIES, INC (CONTACT/OWNER)
Alternative names: C & D BATTERIES, C & D POWER SYSTEMS, C & D TECHNOLOGIES INCORPORATED, C&D TECHS. INC.
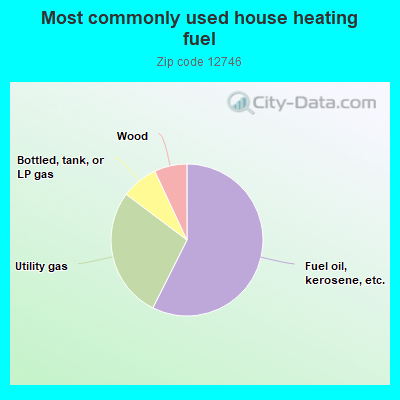
57.7%Fuel oil, kerosene, etc.
28.0%Utility gas
7.8%Bottled, tank, or LP gas
7.0%Wood
Population in 1990: 885. Population change in the 1990s: +259 (+29.3%).
Place of birth for U.S.-born residents:
This state: 450
Northeast: 43
South: 27
West: 25
74% of the 12746 zip code residents lived in the same house 5 years ago. Out of people who lived in different houses, 41% lived in this county. Out of people who lived in different counties, 50% lived in New York.
97% of the 12746 zip code residents lived in the same house 1 year ago. Out of people who lived in different houses, 92% moved from this county.
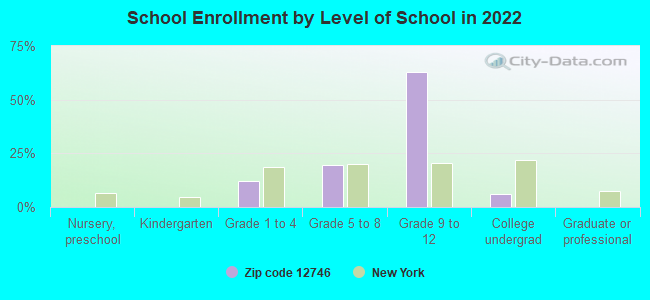
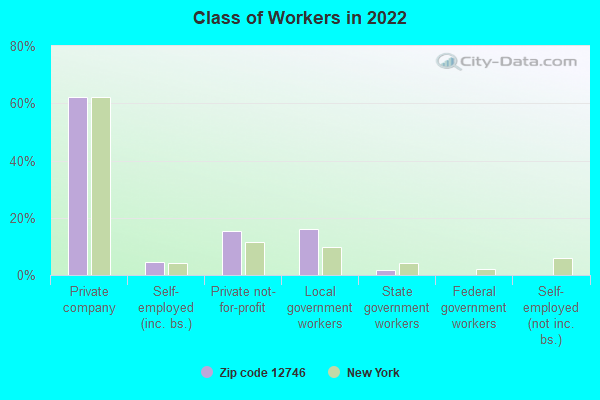
Private vs. public school enrollment:
Students in private schools in grades 1 to 8 (elementary and middle school): 13
Here:
61.0%
New York:
15.6%
Students in private schools in grades 9 to 12 (high school): 31
Here:
69.4%
New York:
15.0%
Students in private undergraduate colleges:
Here:
0.0%
New York:
39.2%
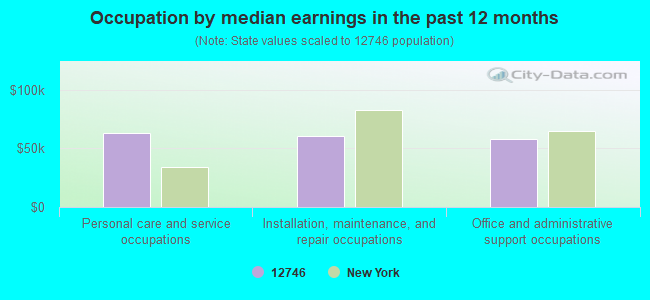
Occupation by median earnings in the past 12 months ($)
63,366Personal care and service occupations
60,796Installation, maintenance, and repair occupations
57,826Office and administrative support occupations
Top industries in this zip code by the number of employees in 2005:
Accommodation and Food Services: Recreational and Vacation Camps (except Campgrounds) (20-49 employees: 1 establishment)
Accommodation and Food Services: Limited-Service Restaurants (5-9: 1, 1-4: 1)
Wholesale Trade: Petroleum Bulk Stations and Terminals (1-4: 1)
Other Services (except Public Administration): Religious Organizations (1-4: 1)
Construction: Framing Contractors (1-4: 1)
Construction: Siding Contractors (1-4: 1)
People in group quarters in 2010:
25 people in workers' group living quarters and job corps centers
Home Mortgage Disclosure Act Aggregated Statistics For Year 2009 (Based on 4 partial tracts)
A) FHA, FSA/RHS & VA Home Purchase Loans
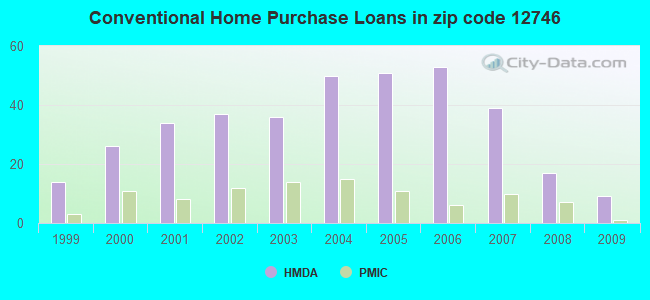
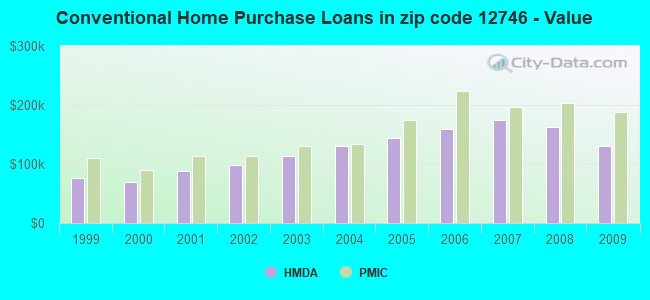
B) Conventional Home Purchase Loans
C) Refinancings
D) Home Improvement Loans
F) Non-occupant Loans on < 5 Family Dwellings (A B C & D)
G) Loans On Manufactured Home Dwelling (A B C & D)
Number
Average Value
Number
Average Value
Number
Average Value
Number
Average Value
Number
Average Value
Number
Average Value
LOANS ORIGINATED
12
$195,492
9
$130,159
28
$141,448
4
$45,978
2
$128,125
3
$44,450
APPLICATIONS APPROVED, NOT ACCEPTED
0
$0
1
$161,680
4
$177,045
1
$203,950
0
$0
0
$0
APPLICATIONS DENIED
4
$167,238
4
$103,720
33
$186,324
9
$39,997
1
$146,430
3
$88,177
APPLICATIONS WITHDRAWN
1
$113,310
3
$122,313
16
$160,565
0
$0
1
$166,480
0
$0
FILES CLOSED FOR INCOMPLETENESS
1
$217,460
0
$0
2
$187,610
0
$0
0
$0
0
$0
Aggregated Statistics For Year 2008 (Based on 4 partial tracts)
A) FHA, FSA/RHS & VA Home Purchase Loans
B) Conventional Home Purchase Loans
C) Refinancings
D) Home Improvement Loans
F) Non-occupant Loans on < 5 Family Dwellings (A B C & D)
G) Loans On Manufactured Home Dwelling (A B C & D)
Number
Average Value
Number
Average Value
Number
Average Value
Number
Average Value
Number
Average Value
Number
Average Value
LOANS ORIGINATED
6
$202,067
17
$162,835
24
$175,192
8
$81,004
3
$123,623
3
$47,067
APPLICATIONS APPROVED, NOT ACCEPTED
1
$171,270
3
$84,690
12
$155,980
3
$27,310
0
$0
1
$98,930
APPLICATIONS DENIED
2
$166,475
8
$128,234
37
$177,394
17
$38,351
4
$177,480
5
$61,796
APPLICATIONS WITHDRAWN
2
$193,495
3
$223,130
11
$175,865
1
$191,320
1
$177,810
0
$0
FILES CLOSED FOR INCOMPLETENESS
0
$0
2
$88,465
3
$229,087
1
$28,330
0
$0
1
$27,020
Aggregated Statistics For Year 2007 (Based on 4 partial tracts)
A) FHA, FSA/RHS & VA Home Purchase Loans
B) Conventional Home Purchase Loans
C) Refinancings
D) Home Improvement Loans
F) Non-occupant Loans on < 5 Family Dwellings (A B C & D)
G) Loans On Manufactured Home Dwelling (A B C & D)
Number
Average Value
Number
Average Value
Number
Average Value
Number
Average Value
Number
Average Value
Number
Average Value
LOANS ORIGINATED
3
$198,870
39
$173,795
48
$150,714
21
$66,262
4
$166,912
4
$69,292
APPLICATIONS APPROVED, NOT ACCEPTED
1
$117,670
6
$157,832
20
$165,474
5
$70,164
1
$186,960
2
$86,290
APPLICATIONS DENIED
0
$0
13
$151,155
59
$166,557
22
$59,130
4
$141,852
7
$66,989
APPLICATIONS WITHDRAWN
0
$0
4
$199,922
30
$184,837
8
$91,736
2
$141,855
1
$49,250
FILES CLOSED FOR INCOMPLETENESS
0
$0
2
$172,575
9
$174,320
1
$82,800
0
$0
0
$0
Aggregated Statistics For Year 2006 (Based on 4 partial tracts)
A) FHA, FSA/RHS & VA Home Purchase Loans
B) Conventional Home Purchase Loans
C) Refinancings
D) Home Improvement Loans
F) Non-occupant Loans on < 5 Family Dwellings (A B C & D)
G) Loans On Manufactured Home Dwelling (A B C & D)
Number
Average Value
Number
Average Value
Number
Average Value
Number
Average Value
Number
Average Value
Number
Average Value
LOANS ORIGINATED
4
$223,458
53
$158,648
71
$148,995
24
$53,349
8
$174,211
6
$65,588
APPLICATIONS APPROVED, NOT ACCEPTED
0
$0
10
$147,998
14
$150,476
3
$105,610
0
$0
2
$70,820
APPLICATIONS DENIED
1
$95,440
30
$131,060
53
$168,178
29
$55,722
8
$117,394
8
$53,114
APPLICATIONS WITHDRAWN
1
$253,200
9
$123,187
42
$147,466
2
$96,310
2
$125,945
1
$48,810
FILES CLOSED FOR INCOMPLETENESS
0
$0
6
$78,008
9
$166,282
0
$0
2
$117,665
1
$64,500
Aggregated Statistics For Year 2005 (Based on 4 partial tracts)
A) FHA, FSA/RHS & VA Home Purchase Loans
B) Conventional Home Purchase Loans
C) Refinancings
D) Home Improvement Loans
F) Non-occupant Loans on < 5 Family Dwellings (A B C & D)
G) Loans On Manufactured Home Dwelling (A B C & D)
Number
Average Value
Number
Average Value
Number
Average Value
Number
Average Value
Number
Average Value
Number
Average Value
LOANS ORIGINATED
1
$155,580
51
$143,489
76
$142,466
18
$61,908
5
$150,264
7
$78,817
APPLICATIONS APPROVED, NOT ACCEPTED
0
$0
7
$120,779
14
$142,040
4
$28,872
0
$0
3
$37,913
APPLICATIONS DENIED
0
$0
20
$126,730
64
$138,625
20
$49,942
3
$124,640
9
$59,608
APPLICATIONS WITHDRAWN
0
$0
12
$167,020
59
$135,430
6
$118,755
2
$303,535
1
$105,900
FILES CLOSED FOR INCOMPLETENESS
0
$0
3
$159,647
15
$163,948
1
$71,910
0
$0
0
$0
Aggregated Statistics For Year 2004 (Based on 4 partial tracts)
A) FHA, FSA/RHS & VA Home Purchase Loans
B) Conventional Home Purchase Loans
C) Refinancings
D) Home Improvement Loans
F) Non-occupant Loans on < 5 Family Dwellings (A B C & D)
G) Loans On Manufactured Home Dwelling (A B C & D)
Number
Average Value
Number
Average Value
Number
Average Value
Number
Average Value
Number
Average Value
Number
Average Value
LOANS ORIGINATED
1
$224,870
50
$130,418
98
$117,417
18
$46,873
12
$106,880
7
$48,311
APPLICATIONS APPROVED, NOT ACCEPTED
0
$0
16
$104,020
38
$86,472
6
$72,415
1
$137,710
4
$51,860
APPLICATIONS DENIED
2
$112,435
27
$103,995
61
$114,215
22
$53,702
4
$157,650
13
$45,323
APPLICATIONS WITHDRAWN
1
$83,240
5
$164,384
56
$114,172
8
$96,258
2
$135,750
3
$59,997
FILES CLOSED FOR INCOMPLETENESS
0
$0
0
$0
6
$141,127
1
$22,660
0
$0
1
$54,040
Aggregated Statistics For Year 2003 (Based on 4 partial tracts)
A) FHA, FSA/RHS & VA Home Purchase Loans
B) Conventional Home Purchase Loans
C) Refinancings
D) Home Improvement Loans
F) Non-occupant Loans on < 5 Family Dwellings (A B C & D)
Number
Average Value
Number
Average Value
Number
Average Value
Number
Average Value
Number
Average Value
LOANS ORIGINATED
3
$135,823
36
$113,756
102
$106,882
10
$34,210
7
$109,884
APPLICATIONS APPROVED, NOT ACCEPTED
1
$123,330
8
$89,666
18
$121,273
1
$112,870
0
$0
APPLICATIONS DENIED
1
$105,460
18
$61,593
72
$107,388
11
$30,744
3
$88,903
APPLICATIONS WITHDRAWN
0
$0
4
$95,985
44
$114,556
0
$0
1
$78,440
FILES CLOSED FOR INCOMPLETENESS
0
$0
4
$100,342
5
$93,872
0
$0
1
$68,420
Aggregated Statistics For Year 2002 (Based on 4 partial tracts)
A) FHA, FSA/RHS & VA Home Purchase Loans
B) Conventional Home Purchase Loans
C) Refinancings
D) Home Improvement Loans
F) Non-occupant Loans on < 5 Family Dwellings (A B C & D)
Number
Average Value
Number
Average Value
Number
Average Value
Number
Average Value
Number
Average Value
LOANS ORIGINATED
4
$134,990
37
$98,609
62
$91,848
10
$30,462
6
$96,022
APPLICATIONS APPROVED, NOT ACCEPTED
0
$0
9
$78,106
10
$95,092
2
$15,470
0
$0
APPLICATIONS DENIED
3
$100,670
24
$56,127
41
$85,874
8
$30,560
0
$0
APPLICATIONS WITHDRAWN
0
$0
6
$108,587
38
$94,305
1
$45,760
0
$0
FILES CLOSED FOR INCOMPLETENESS
0
$0
1
$153,840
11
$102,730
0
$0
0
$0
Aggregated Statistics For Year 2001 (Based on 4 partial tracts)
A) FHA, FSA/RHS & VA Home Purchase Loans
B) Conventional Home Purchase Loans
C) Refinancings
D) Home Improvement Loans
F) Non-occupant Loans on < 5 Family Dwellings (A B C & D)
Number
Average Value
Number
Average Value
Number
Average Value
Number
Average Value
Number
Average Value
LOANS ORIGINATED
7
$90,896
34
$87,378
51
$79,401
7
$22,537
3
$70,453
APPLICATIONS APPROVED, NOT ACCEPTED
1
$143,380
9
$60,721
15
$65,661
2
$13,290
2
$64,715
APPLICATIONS DENIED
0
$0
21
$53,852
44
$67,440
13
$22,896
6
$55,565
APPLICATIONS WITHDRAWN
1
$95,000
5
$94,656
46
$82,887
7
$30,319
0
$0
FILES CLOSED FOR INCOMPLETENESS
0
$0
1
$92,830
10
$94,874
0
$0
0
$0
Aggregated Statistics For Year 2000 (Based on 4 partial tracts)
A) FHA, FSA/RHS & VA Home Purchase Loans
B) Conventional Home Purchase Loans
C) Refinancings
D) Home Improvement Loans
F) Non-occupant Loans on < 5 Family Dwellings (A B C & D)
Number
Average Value
Number
Average Value
Number
Average Value
Number
Average Value
Number
Average Value
LOANS ORIGINATED
7
$81,930
26
$68,940
27
$77,508
8
$24,840
5
$51,860
APPLICATIONS APPROVED, NOT ACCEPTED
1
$94,570
12
$65,515
9
$60,189
4
$34,865
1
$27,020
APPLICATIONS DENIED
0
$0
24
$53,694
37
$56,030
12
$26,729
0
$0
APPLICATIONS WITHDRAWN
1
$101,110
9
$60,189
27
$73,182
3
$45,470
2
$40,745
FILES CLOSED FOR INCOMPLETENESS
0
$0
0
$0
6
$69,947
1
$13,070
0
$0
Aggregated Statistics For Year 1999 (Based on 2 partial tracts)
A) FHA, FSA/RHS & VA Home Purchase Loans
B) Conventional Home Purchase Loans
C) Refinancings
D) Home Improvement Loans
F) Non-occupant Loans on < 5 Family Dwellings (A B C & D)
Detailed PMIC statistics for the following Tracts:0116.00
2002 - 2018 National Fire Incident Reporting System (NFIRS) incidents
Based on the data from the years 2002 - 2018 the average number of fires per year is 18. The highest number of fires - 32 took place in 2003, and the least - 6 in 2002. The data has a rising trend.
When looking into fire subcategories, the most incidents belonged to: Structure Fires (46.0%), and Outside Fires (34.2%).
Fire incident types reported to NFIRS in Zip Code 12746


 Nearest zip codes: 12729, 12780, 12771, 18336, 18340, 10963.
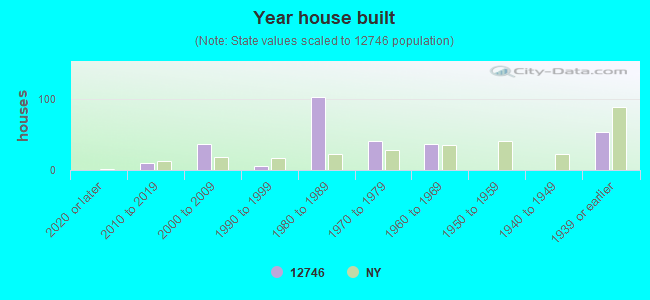


 Based on the data from the years 2002 - 2018 the average number of fires per year is 18. The highest number of fires - 32 took place in 2003, and the least - 6 in 2002. The data has a rising trend.
 When looking into fire subcategories, the most incidents belonged to: Structure Fires (46.0%), and Outside Fires (34.2%).