Estimated zip code population in 2022: 453 Zip code population in 2010: 574 Zip code population in 2000: 678
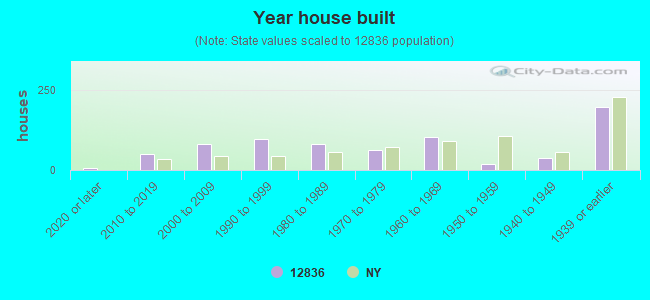
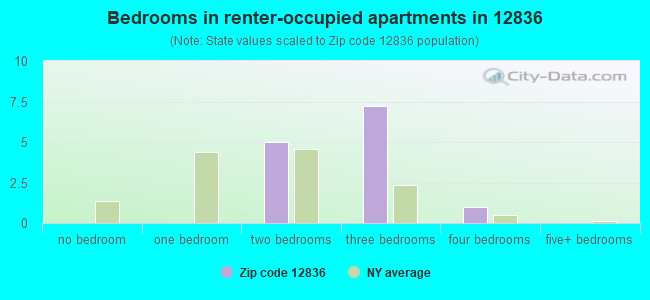
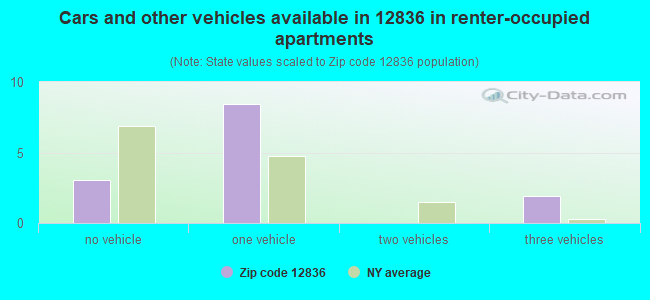
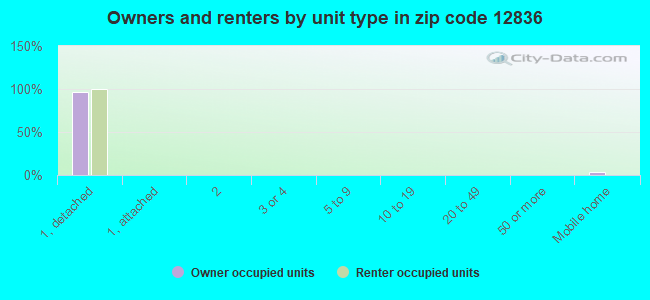
Houses and condos: 740 Renter-occupied apartments: 13
% of renters here:
5%
State:
46%
March 2022 cost of living index in zip code 12836: 96.3 (near average, U.S. average is 100)
Land area: 43.9 sq. mi. Water area: 0.5 sq. mi.
Population density: 10 people per square mile
(very low).
OSM Map
General Map
Google Map
MSN Map
OSM Map
General Map
Google Map
MSN Map
OSM Map
General Map
Google Map
MSN Map
OSM Map
General Map
Google Map
MSN Map
Please wait while loading the map...
Real estate property taxes paid for housing units in 2022:
This zip code:
1.0% ($3,161)
New York:
1.5% ($6,180)
Median real estate property taxes paid for housing units with mortgages in 2022: $2,865 (0.9%) Median real estate property taxes paid for housing units with no mortgage in 2022: $3,436 (0.8%)
Business Search- 14 Million verified businesses
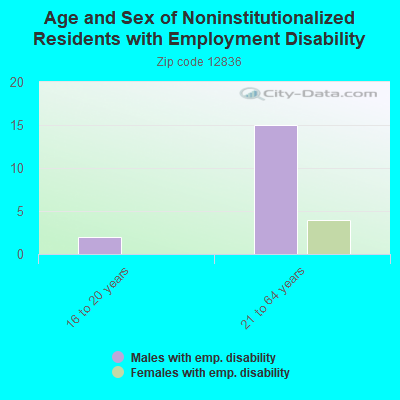
Males: 230
(50.8%)
Females: 223
(49.2%)
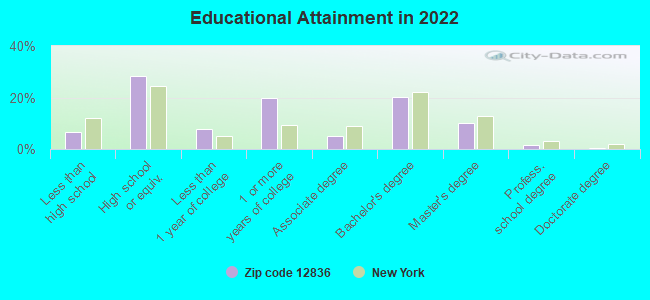
For population 25 years and over in 12836:
High school or higher: 90.8%
Bachelor's degree or higher: 31.7%
Graduate or professional degree: 12.3%
Unemployed: 2.1%
Mean travel time to work (commute): 15.0 minutes
For population 15 years and over in 12836:
Never married: 20.4%
Now married: 53.6%
Separated: 0.5%
Widowed: 6.6%
Divorced: 18.9%
Zip code 12836 compared to state average:
Unemployed percentage below state average.
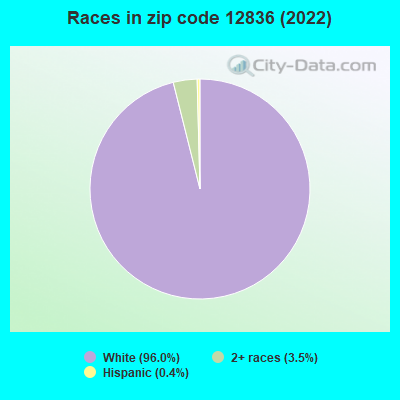
Black race population percentage significantly below state average.
Hispanic race population percentage significantly below state average.
Median age significantly above state average.
Foreign-born population percentage significantly below state average.
Renting percentage significantly below state average.
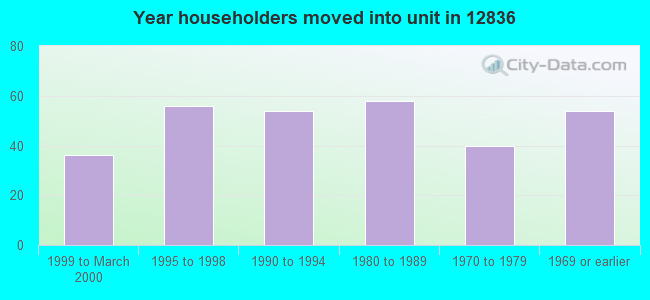
Length of stay since moving in significantly below state average.
Estimated median house/condo value in 2022: $324,719
12836:
$324,719
New York:
$400,400
According to our research of New York and other state lists, there was 1 registered sex offender living in 12836 zip code as of April 26, 2024. The ratio of all residents to sex offenders in zip code 12836 is 613 to 1.
Median resident age:
This zip code:
64.9 years
New York median age:
40.0 years
Average household size:
This zip code:
1.7 people
New York:
2.5 people
Averages for the 2020 tax year for zip code 12836, filed in 2021:
Average Adjusted Gross Income (AGI) in 2020: $63,793 (Individual Income Tax Returns)
Here:
$63,793
State:
$90,930
Salary/wage: $46,463 (reported on 65.5% of returns)
Here:
$46,463
State:
$72,104
(% of AGI for various income ranges: 861.7% for AGIs below $25k, 3163.3% for AGIs $25k-50k, 7816.7% for AGIs $50k-75k, 20340.0% for AGIs $100k-200k)
Taxable interest for individuals: $571 (reported on 48.3% of returns)
This zip code:
$571
New York:
$3,075
(% of AGI for various income ranges: 23.3% for AGIs below $25k, 33.3% for AGIs $25k-50k, 73.3% for AGIs $50k-75k, 120.0% for AGIs $100k-200k)
Ordinary dividends: $6,010 (reported on 34.5% of returns)
Here:
$6,010
State:
$11,095
(% of AGI for various income ranges: 233.3% for AGIs below $25k, 410.0% for AGIs $50k-75k, 1690.0% for AGIs $100k-200k)
Net capital gain/loss in AGI: +$12,512 (reported on 27.6% of returns)
Here:
+$12,512
State:
+$44,925
(% of AGI for various income ranges: 96.7% for AGIs below $25k, 303.3% for AGIs $50k-75k, 4260.0% for AGIs $100k-200k)
Profit/loss from business: +$7,300 (reported on 17.2% of returns)
Here:
+$7,300
State:
+$14,940
(% of AGI for various income ranges: 608.3% for AGIs $25k-50k)
Taxable individual retirement arrangement distribution: $23,600 (reported on 13.8% of returns)
12836:
$23,600
New York:
$19,609
(% of AGI for various income ranges: 265.0% for AGIs below $25k)
Total itemized deductions: $22,900 (reported on 10.3% of returns)
Here:
$22,900
State:
$39,326
(% of AGI for various income ranges: )
Charity contributions: $6,350 (reported on 6.9% of returns)
Here:
$6,350
State:
$15,420
(% of AGI for various income ranges: 423.3% for AGIs $50k-75k)
Taxes paid: $8,700 (reported on 6.9% of returns)
12836:
$8,700
State:
$9,183
(% of AGI for various income ranges: )
Earned income credit: $1,900 (reported on 6.9% of returns)
Here:
$1,900
State:
$2,138
(% of AGI for various income ranges: 63.3% for AGIs below $25k)
Percentage of individuals using paid preparers for their 2020 taxes: 93.1%
Here:
93%
State:
95%
(% for various income ranges: 100.0% for AGIs below $25k, 87.5% for AGIs $25k-50k, 100.0% for AGIs $50k-75k, 66.7% for AGIs $75k-100k, 100.0% for AGIs $100k-200k)
Averages for the 2012 tax year for zip code 12836, filed in 2013:
Average Adjusted Gross Income (AGI) in 2012: $57,086 (Individual Income Tax Returns)
Here:
$57,086
State:
$77,088
Salary/wage: $37,415 (reported on 71.4% of returns)
Here:
$37,415
State:
$60,593
(% of AGI for various income ranges: 64.8% for AGIs below $25k, 53.9% for AGIs $25k-50k, 86.0% for AGIs $50k-75k, 43.7% for AGIs $100k-200k)
Taxable interest for individuals: $1,207 (reported on 50.0% of returns)
This zip code:
$1,207
New York:
$3,125
(% of AGI for various income ranges: 0.6% for AGIs below $25k, 1.4% for AGIs $25k-50k, 0.6% for AGIs $50k-75k, 1.4% for AGIs $100k-200k)
Ordinary dividends: $5,882 (reported on 39.3% of returns)
Here:
$5,882
State:
$10,299
(% of AGI for various income ranges: 1.6% for AGIs below $25k, 2.4% for AGIs $25k-50k, 4.8% for AGIs $50k-75k, 6.0% for AGIs $100k-200k)
Net capital gain/loss in AGI: +$4,771 (reported on 25.0% of returns)
Here:
+$4,771
State:
+$42,474
Profit/loss from business: +$5,360 (reported on 17.9% of returns)
Here:
+$5,360
State:
+$16,168
Taxable individual retirement arrangement distribution: $12,671 (reported on 25.0% of returns)
12836:
$12,671
New York:
$17,621
Total itemized deductions: $22,845 (27% of AGI, reported on 39.3% of returns)
Here:
$22,845
State:
$34,985
Here:
26.6% of AGI
State:
21.3% of AGI
(% of AGI for various income ranges: 20.2% for AGIs $25k-50k, 36.1% for AGIs $50k-75k, 15.6% for AGIs $100k-200k)
Charity contributions: $2,814 (reported on 25.0% of returns)
Here:
$2,814
State:
$5,572
Taxes paid: $10,336 (reported on 39.3% of returns)
12836:
$10,336
State:
$18,656
(% of AGI for various income ranges: 5.1% for AGIs $25k-50k, 14.4% for AGIs $50k-75k, 9.2% for AGIs $100k-200k)
Earned income credit: $1,860 (reported on 17.9% of returns)
Here:
$1,860
State:
$2,230
(% of AGI for various income ranges: 7.3% for AGIs below $25k)
Percentage of individuals using paid preparers for their 2012 taxes: 64.3%
Here:
64%
State:
66%
(% for various income ranges: 54.5% for AGIs below $25k, 62.5% for AGIs $25k-50k, 133.3% for AGIs $50k-75k, 75.0% for AGIs $100k-200k)
Averages for the 2004 tax year for zip code 12836, filed in 2005:
Average Adjusted Gross Income (AGI) in 2004: $42,161 (Individual Income Tax Returns)
Here:
$42,161
State:
$59,519
Salary/wage: $28,868 (reported on 74.4% of returns)
Here:
$28,868
State:
$50,673
(% of AGI for various income ranges: 72.3% for AGIs below $10k, 68.3% for AGIs $10k-25k, 69.2% for AGIs $25k-50k, 47.3% for AGIs $50k-75k, 48.1% for AGIs $75k-100k, 37.8% for AGIs over 100k)
Taxable interest for individuals: $1,756 (reported on 55.1% of returns)
This zip code:
$1,756
New York:
$2,377
(% of AGI for various income ranges: 8.3% for AGIs below $10k, 1.1% for AGIs $10k-25k, 4.7% for AGIs $25k-50k, 2.8% for AGIs $50k-75k, 0.2% for AGIs $75k-100k, 1.5% for AGIs over 100k)
Taxable dividends: $3,495 (reported on 33.1% of returns)
Here:
$3,495
State:
$5,394
(% of AGI for various income ranges: 5.0% for AGIs below $10k, 2.3% for AGIs $10k-25k, 1.2% for AGIs $25k-50k, 1.4% for AGIs $50k-75k, 0.8% for AGIs $75k-100k, 5.5% for AGIs over 100k)
Net capital gain/loss: +$5,051 (reported on 25.9% of returns)
Here:
+$5,051
State:
+$23,581
(% of AGI for various income ranges: -5.8% for AGIs below $10k, 1.5% for AGIs $10k-25k, 3.2% for AGIs $25k-50k, 2.3% for AGIs $50k-75k, 0.9% for AGIs $75k-100k, 5.7% for AGIs over 100k)
Profit/loss from business: +$9,574 (reported on 15.4% of returns)
Here:
+$9,574
State:
+$13,809
(% of AGI for various income ranges: -0.4% for AGIs below $10k, 5.0% for AGIs $10k-25k, 12.7% for AGIs $50k-75k)
Total itemized deductions: $18,515 (24% of AGI, reported on 31.8% of returns)
Here:
$18,515
State:
$25,864
Here:
24.0% of AGI
State:
21.9% of AGI
(% of AGI for various income ranges: 11.1% for AGIs $10k-25k, 13.6% for AGIs $25k-50k, 16.4% for AGIs $50k-75k, 15.4% for AGIs $75k-100k, 13.5% for AGIs over 100k)
Charity contributions deductions: $2,817 (3% of AGI, reported on 26.9% of returns)
Here:
$2,817
State:
$4,439
Here:
3.4% of AGI
State:
3.6% of AGI
(% of AGI for various income ranges: 1.7% for AGIs $25k-50k, 2.4% for AGIs $50k-75k, 1.7% for AGIs $75k-100k, 2.1% for AGIs over 100k)
Total tax: $6,313 (reported on 74.4% of returns)
12836:
$6,313
State:
$11,730
(% of AGI for various income ranges: 2.5% for AGIs below $10k, 4.3% for AGIs $10k-25k, 6.4% for AGIs $25k-50k, 9.2% for AGIs $50k-75k, 10.8% for AGIs $75k-100k, 18.3% for AGIs over 100k)
Earned income credit: $1,450 (reported on 13.1% of returns)
Here:
$1,450
State:
$1,757
Percentage of individuals using paid preparers for their 2004 taxes: 63.9%
Here:
64%
State:
67%
(% for various income ranges: 58.6% for AGIs below $10k, 61.3% for AGIs $10k-25k, 67.7% for AGIs $25k-50k, 70.0% for AGIs $50k-75k, 54.5% for AGIs $75k-100k, 73.9% for AGIs over 100k)
Size of family households: 118 2-persons, 2 3-persons, 6 4-persons
Size of nonfamily households: 85 1-person, 59 2-persons, 5 3-persons
12 married couples with children.
0 single-parent households ().
101.3% of residents of 12836 zip code speak English at home.
0.7% of residents speak other Indo-European language at home (100% very well).
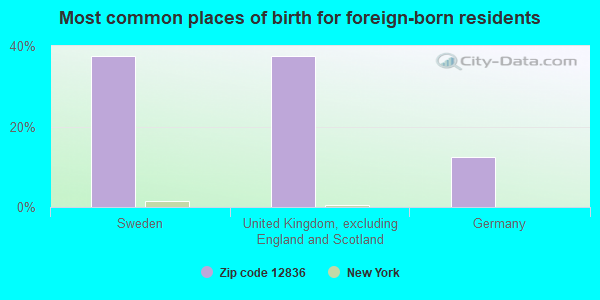
Foreign born population: 8 (2.0%) (56.8% of them are naturalized citizens)
This zip code:
2.0%
Whole state:
22.7%
38%Sweden
38%United Kingdom, excluding England and Scotland
12%Germany
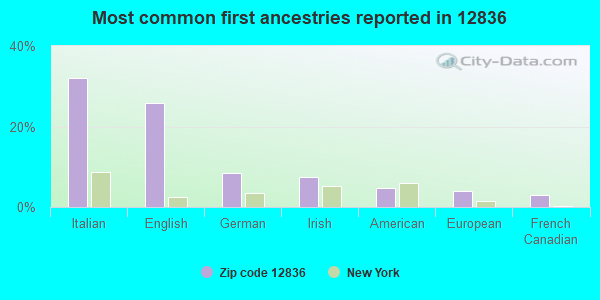
32%Italian
26%English
8%German
7%Irish
5%American
4%European
3%French Canadian
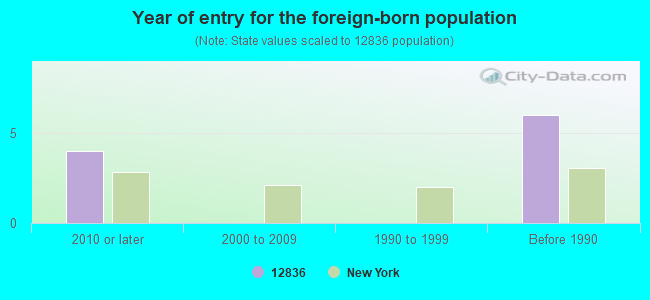
Year of entry for the foreign-born population
42010 or later
02000 to 2009
01990 to 1999
6Before 1990
Facilities with environmental interests located in this zip code:
HAGUE (T) SD#1 WWTP (DECKER HILL ROAD in HAGUE, NY)
National Pollutant Discharge Elimination System NON-MAJOR (Tracking pollutant discharge elimination systems) - permit Business SIC classification: SEWERAGE SYSTEMS
Housing units lacking complete plumbing facilities: 6.7% Housing units lacking complete kitchen facilities: 5.9%
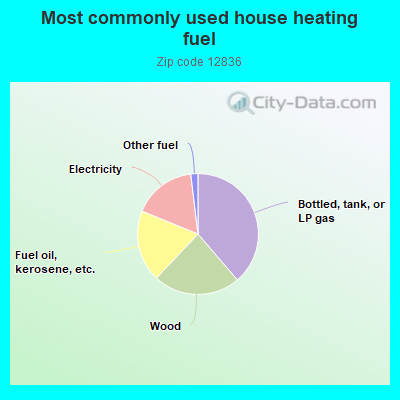
38.9%Bottled, tank, or LP gas
23.4%Wood
19.2%Fuel oil, kerosene, etc.
17.0%Electricity
1.9%Other fuel
Population in 1990: 692.
Place of birth for U.S.-born residents:
This state: 203
Northeast: 198
Midwest: 2
South: 26
West: 12
71% of the 12836 zip code residents lived in the same house 5 years ago. Out of people who lived in different houses, 26% lived in this county. Out of people who lived in different counties, 50% lived in New York.
93% of the 12836 zip code residents lived in the same house 1 year ago. Out of people who lived in different houses, 47% moved from different county within same state. Out of people who lived in different houses, 56% moved from different state.
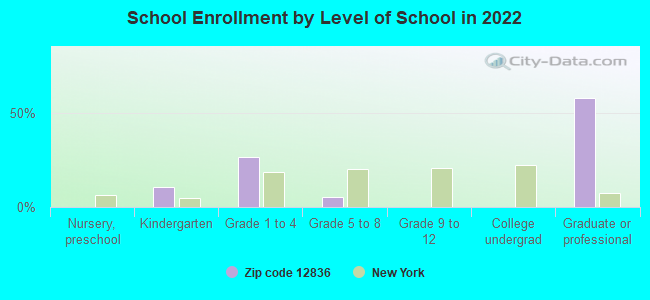
Private vs. public school enrollment:
Students in private schools in grades 1 to 8 (elementary and middle school): 8
Here:
100.0%
New York:
15.6%
Students in private undergraduate colleges:
Here:
0.0%
New York:
39.2%
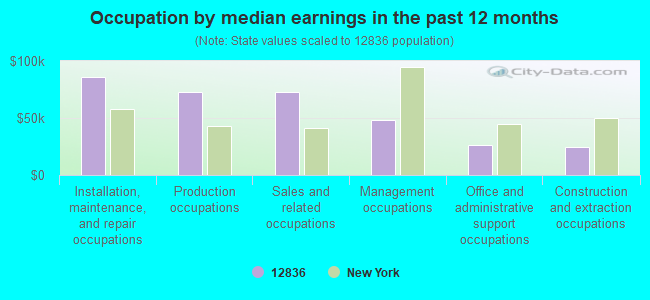
Occupation by median earnings in the past 12 months ($)
86,177Installation, maintenance, and repair occupations
73,136Production occupations
72,878Sales and related occupations
48,442Management occupations
26,188Office and administrative support occupations
24,956Construction and extraction occupations
Top industries in this zip code by the number of employees in 2005:
Real Estate and Rental and Leasing: Truck, Utility Trailer, and RV (Recreational Vehicle) Rental and Leasing (20-49 employees: 1 establishment)
Administrative and Support and Waste Management and Remediation Services: Landscaping Services (5-9: 1, 1-4: 2)
Accommodation and Food Services: Hotels (except Casino Hotels) and Motels (5-9: 1)
Other Services (except Public Administration): Other Similar Organizations (except Business, Professional, Labor, and Political Organizations) (5-9: 1)
Construction: Residential Remodelers (1-4: 2)
Other Services (except Public Administration): General Automotive Repair (1-4: 1)
Accommodation and Food Services: Full-Service Restaurants (1-4: 1)
Construction: Site Preparation Contractors (1-4: 1)
Other Services (except Public Administration): Religious Organizations (1-4: 1)
Home Mortgage Disclosure Act Aggregated Statistics For Year 2009 (Based on 2 partial tracts)
A) FHA, FSA/RHS & VA Home Purchase Loans
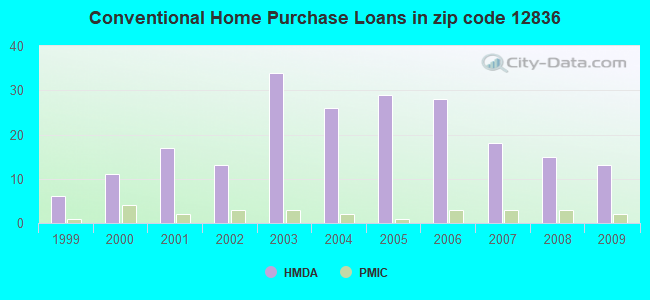
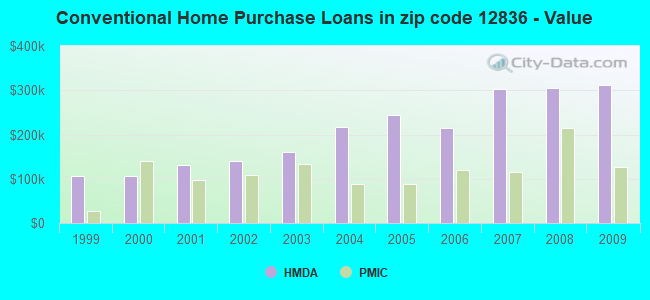
B) Conventional Home Purchase Loans
C) Refinancings
D) Home Improvement Loans
F) Non-occupant Loans on < 5 Family Dwellings (A B C & D)
G) Loans On Manufactured Home Dwelling (A B C & D)
Number
Average Value
Number
Average Value
Number
Average Value
Number
Average Value
Number
Average Value
Number
Average Value
LOANS ORIGINATED
1
$188,210
13
$312,151
34
$217,823
9
$58,208
25
$301,709
1
$68,630
APPLICATIONS APPROVED, NOT ACCEPTED
0
$0
1
$100,810
4
$161,665
0
$0
2
$223,060
0
$0
APPLICATIONS DENIED
1
$181,770
2
$350,405
16
$181,302
4
$104,158
6
$262,560
0
$0
APPLICATIONS WITHDRAWN
0
$0
1
$203,760
9
$197,262
1
$78,290
5
$244,614
1
$51,480
FILES CLOSED FOR INCOMPLETENESS
0
$0
1
$93,840
3
$200,003
1
$8,040
1
$177,480
0
$0
Aggregated Statistics For Year 2008 (Based on 2 partial tracts)
A) FHA, FSA/RHS & VA Home Purchase Loans
B) Conventional Home Purchase Loans
C) Refinancings
D) Home Improvement Loans
F) Non-occupant Loans on < 5 Family Dwellings (A B C & D)
G) Loans On Manufactured Home Dwelling (A B C & D)
Number
Average Value
Number
Average Value
Number
Average Value
Number
Average Value
Number
Average Value
Number
Average Value
LOANS ORIGINATED
1
$113,670
15
$304,847
18
$230,417
8
$61,395
16
$317,263
1
$29,490
APPLICATIONS APPROVED, NOT ACCEPTED
0
$0
3
$262,023
8
$192,094
1
$5,360
4
$314,882
0
$0
APPLICATIONS DENIED
1
$66,490
2
$97,855
16
$101,811
6
$60,770
2
$137,535
1
$37,530
APPLICATIONS WITHDRAWN
0
$0
1
$270,780
8
$139,412
0
$0
1
$123,330
0
$0
FILES CLOSED FOR INCOMPLETENESS
0
$0
1
$63,810
2
$145,845
1
$53,620
1
$184,450
1
$107,240
Aggregated Statistics For Year 2007 (Based on 2 partial tracts)
A) FHA, FSA/RHS & VA Home Purchase Loans
B) Conventional Home Purchase Loans
C) Refinancings
D) Home Improvement Loans
F) Non-occupant Loans on < 5 Family Dwellings (A B C & D)
G) Loans On Manufactured Home Dwelling (A B C & D)
Number
Average Value
Number
Average Value
Number
Average Value
Number
Average Value
Number
Average Value
Number
Average Value
LOANS ORIGINATED
1
$64,340
18
$303,608
23
$161,560
10
$54,049
17
$353,104
2
$68,900
APPLICATIONS APPROVED, NOT ACCEPTED
0
$0
6
$226,633
5
$178,662
2
$43,970
3
$241,470
1
$21,450
APPLICATIONS DENIED
0
$0
3
$131,010
13
$141,928
9
$38,428
3
$140,663
1
$62,200
APPLICATIONS WITHDRAWN
0
$0
2
$260,595
5
$151,744
1
$18,230
2
$269,710
0
$0
FILES CLOSED FOR INCOMPLETENESS
0
$0
1
$120,650
3
$147,990
1
$85,790
1
$163,540
0
$0
Aggregated Statistics For Year 2006 (Based on 2 partial tracts)
A) FHA, FSA/RHS & VA Home Purchase Loans
B) Conventional Home Purchase Loans
C) Refinancings
D) Home Improvement Loans
F) Non-occupant Loans on < 5 Family Dwellings (A B C & D)
G) Loans On Manufactured Home Dwelling (A B C & D)
Number
Average Value
Number
Average Value
Number
Average Value
Number
Average Value
Number
Average Value
Number
Average Value
LOANS ORIGINATED
1
$77,750
28
$214,940
33
$198,638
16
$62,869
30
$269,244
2
$43,165
APPLICATIONS APPROVED, NOT ACCEPTED
0
$0
6
$186,418
7
$244,890
3
$70,063
9
$252,431
0
$0
APPLICATIONS DENIED
0
$0
9
$115,879
14
$89,431
10
$118,447
6
$110,100
3
$32,350
APPLICATIONS WITHDRAWN
0
$0
2
$170,780
13
$85,751
4
$184,185
3
$304,920
1
$42,900
FILES CLOSED FOR INCOMPLETENESS
0
$0
1
$304,030
5
$135,874
0
$0
2
$193,570
0
$0
Aggregated Statistics For Year 2005 (Based on 2 partial tracts)
B) Conventional Home Purchase Loans
C) Refinancings
D) Home Improvement Loans
F) Non-occupant Loans on < 5 Family Dwellings (A B C & D)
G) Loans On Manufactured Home Dwelling (A B C & D)
Number
Average Value
Number
Average Value
Number
Average Value
Number
Average Value
Number
Average Value
LOANS ORIGINATED
29
$244,914
21
$122,866
8
$58,111
27
$257,316
2
$75,070
APPLICATIONS APPROVED, NOT ACCEPTED
3
$118,857
6
$206,080
0
$0
1
$483,650
1
$42,900
APPLICATIONS DENIED
7
$72,770
28
$128,631
8
$75,001
3
$211,620
8
$59,116
APPLICATIONS WITHDRAWN
5
$193,140
18
$102,772
2
$96,785
3
$177,303
2
$118,770
FILES CLOSED FOR INCOMPLETENESS
1
$124,400
4
$116,622
0
$0
1
$151,210
1
$34,850
Aggregated Statistics For Year 2004 (Based on 2 partial tracts)
A) FHA, FSA/RHS & VA Home Purchase Loans
B) Conventional Home Purchase Loans
C) Refinancings
D) Home Improvement Loans
F) Non-occupant Loans on < 5 Family Dwellings (A B C & D)
G) Loans On Manufactured Home Dwelling (A B C & D)
Number
Average Value
Number
Average Value
Number
Average Value
Number
Average Value
Number
Average Value
Number
Average Value
LOANS ORIGINATED
1
$45,040
26
$216,563
28
$134,126
12
$48,749
31
$202,926
3
$116,357
APPLICATIONS APPROVED, NOT ACCEPTED
0
$0
3
$226,277
18
$84,541
0
$0
2
$313,140
0
$0
APPLICATIONS DENIED
0
$0
10
$97,481
25
$108,098
5
$47,186
5
$160,216
5
$74,640
APPLICATIONS WITHDRAWN
1
$58,450
2
$116,625
15
$125,935
1
$25,200
3
$170,870
1
$86,860
FILES CLOSED FOR INCOMPLETENESS
0
$0
1
$84,180
3
$152,460
1
$18,770
1
$81,500
1
$101,340
Aggregated Statistics For Year 2003 (Based on 2 partial tracts)
B) Conventional Home Purchase Loans
C) Refinancings
D) Home Improvement Loans
F) Non-occupant Loans on < 5 Family Dwellings (A B C & D)
Number
Average Value
Number
Average Value
Number
Average Value
Number
Average Value
LOANS ORIGINATED
34
$160,970
55
$120,762
4
$42,360
41
$174,867
APPLICATIONS APPROVED, NOT ACCEPTED
5
$84,720
13
$165,191
1
$13,410
6
$231,907
APPLICATIONS DENIED
6
$126,097
22
$104,071
1
$20,380
4
$178,958
APPLICATIONS WITHDRAWN
2
$306,170
12
$109,072
1
$16,620
3
$243,257
FILES CLOSED FOR INCOMPLETENESS
0
$0
2
$78,015
0
$0
0
$0
Aggregated Statistics For Year 2002 (Based on 2 partial tracts)
A) FHA, FSA/RHS & VA Home Purchase Loans
B) Conventional Home Purchase Loans
C) Refinancings
D) Home Improvement Loans
F) Non-occupant Loans on < 5 Family Dwellings (A B C & D)
Number
Average Value
Number
Average Value
Number
Average Value
Number
Average Value
Number
Average Value
LOANS ORIGINATED
1
$91,690
13
$139,659
23
$130,670
5
$15,658
19
$165,799
APPLICATIONS APPROVED, NOT ACCEPTED
0
$0
3
$125,293
5
$100,376
0
$0
3
$157,107
APPLICATIONS DENIED
0
$0
2
$110,725
17
$87,432
1
$13,410
3
$125,293
APPLICATIONS WITHDRAWN
0
$0
1
$62,200
9
$82,456
1
$37,000
2
$85,790
FILES CLOSED FOR INCOMPLETENESS
0
$0
0
$0
3
$117,963
0
$0
1
$190,890
Aggregated Statistics For Year 2001 (Based on 2 partial tracts)
A) FHA, FSA/RHS & VA Home Purchase Loans
B) Conventional Home Purchase Loans
C) Refinancings
D) Home Improvement Loans
E) Loans on Dwellings For 5+ Families
F) Non-occupant Loans on < 5 Family Dwellings (A B C & D)
Number
Average Value
Number
Average Value
Number
Average Value
Number
Average Value
Number
Average Value
Number
Average Value
LOANS ORIGINATED
1
$114,210
17
$130,518
15
$71,743
4
$7,372
1
$45,040
11
$111,968
APPLICATIONS APPROVED, NOT ACCEPTED
0
$0
3
$123,147
5
$74,102
0
$0
0
$0
3
$133,693
APPLICATIONS DENIED
0
$0
4
$73,460
12
$46,515
5
$10,616
0
$0
1
$132,980
APPLICATIONS WITHDRAWN
0
$0
1
$117,960
8
$94,572
1
$5,360
0
$0
2
$142,895
FILES CLOSED FOR INCOMPLETENESS
0
$0
0
$0
1
$64,340
0
$0
0
$0
0
$0
Aggregated Statistics For Year 2000 (Based on 2 partial tracts)
B) Conventional Home Purchase Loans
C) Refinancings
D) Home Improvement Loans
F) Non-occupant Loans on < 5 Family Dwellings (A B C & D)
Number
Average Value
Number
Average Value
Number
Average Value
Number
Average Value
LOANS ORIGINATED
11
$105,924
8
$81,435
7
$16,086
12
$108,491
APPLICATIONS APPROVED, NOT ACCEPTED
1
$69,710
3
$70,600
2
$13,135
1
$131,370
APPLICATIONS DENIED
2
$58,445
5
$80,108
4
$11,125
0
$0
APPLICATIONS WITHDRAWN
1
$32,170
8
$43,834
1
$2,680
1
$39,140
FILES CLOSED FOR INCOMPLETENESS
1
$15,010
1
$96,520
0
$0
0
$0
Aggregated Statistics For Year 1999 (Based on 1 partial tract)
A) FHA, FSA/RHS & VA Home Purchase Loans
B) Conventional Home Purchase Loans
C) Refinancings
D) Home Improvement Loans
F) Non-occupant Loans on < 5 Family Dwellings (A B C & D)


 Nearest zip codes: 12874, 12815, 12814, 12808, 12841, 12883.