Estimated zip code population in 2022: 8,740 Zip code population in 2010: 8,891 Zip code population in 2000: 9,052
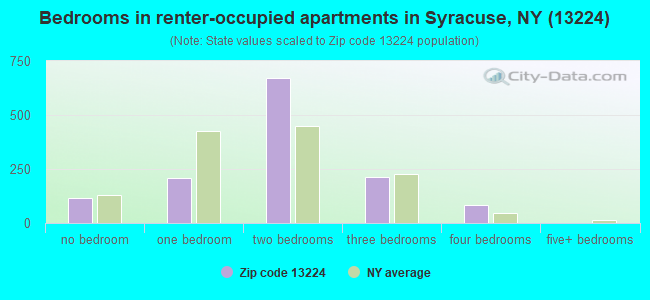
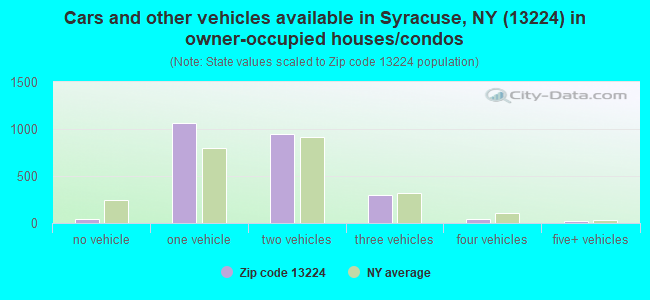
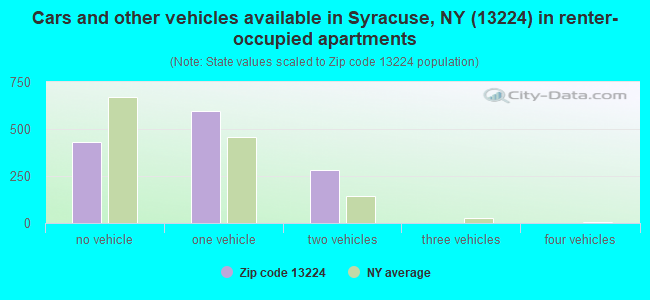
Houses and condos: 3,991 Renter-occupied apartments: 1,303
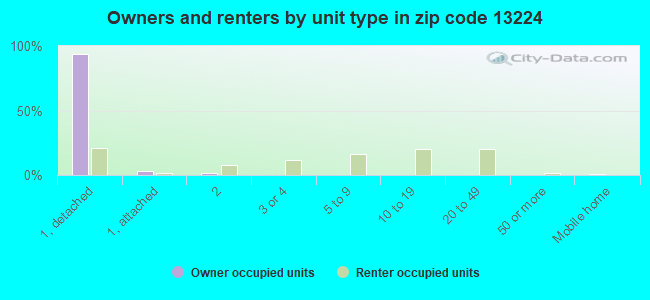
% of renters here:
35%
State:
46%
March 2022 cost of living index in zip code 13224: 101.8 (near average, U.S. average is 100)
Land area: 3.0 sq. mi. Water area: 0.0 sq. mi.
Population density: 2,933 people per square mile
(average).
OSM Map
General Map
Google Map
MSN Map
OSM Map
General Map
Google Map
MSN Map
OSM Map
General Map
Google Map
MSN Map
OSM Map
General Map
Google Map
MSN Map
Please wait while loading the map...
Real estate property taxes paid for housing units in 2022:
This zip code:
2.2% ($4,357)
New York:
1.5% ($6,180)
Median real estate property taxes paid for housing units with mortgages in 2022: $4,435 (2.2%) Median real estate property taxes paid for housing units with no mortgage in 2022: $4,278 (2.2%)
Business Search- 14 Million verified businesses
Males: 4,149
(47.5%)
Females: 4,590
(52.5%)
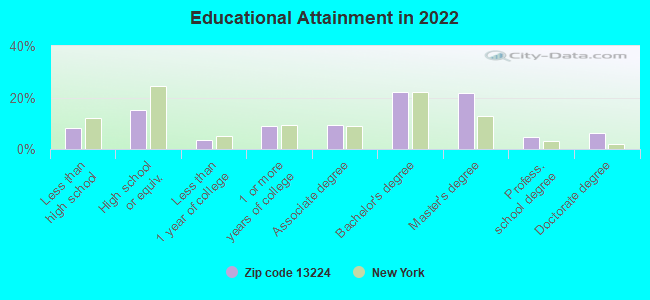
For population 25 years and over in 13224:
High school or higher: 92.7%
Bachelor's degree or higher: 55.4%
Graduate or professional degree: 33.0%
Unemployed: 4.6%
Mean travel time to work (commute): 16.9 minutes
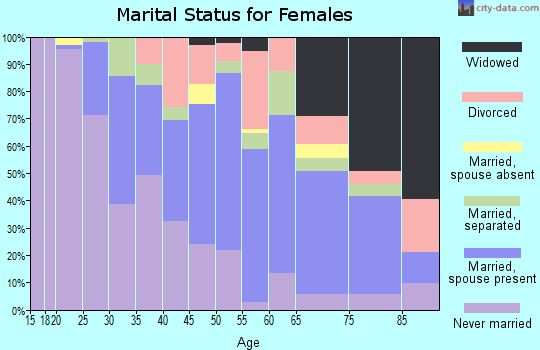
For population 15 years and over in 13224:
Never married: 39.3%
Now married: 44.3%
Separated: 1.9%
Widowed: 5.3%
Divorced: 9.2%
Zip code 13224 compared to state average:
Median house value below state average.
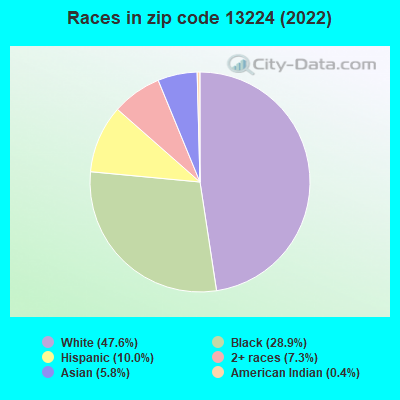
Black race population percentage above state average.
Hispanic race population percentage below state average.
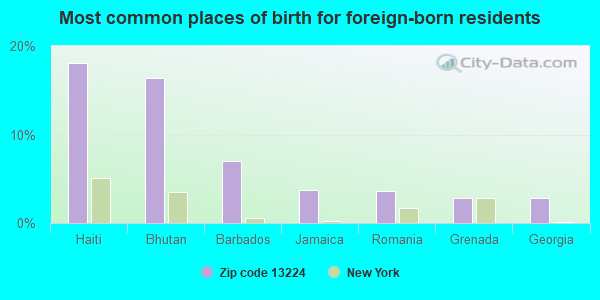
Foreign-born population percentage below state average.
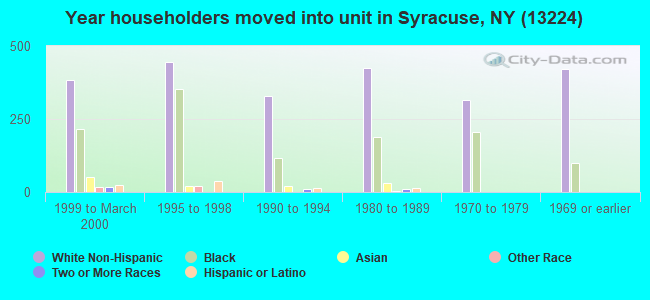
Length of stay since moving in significantly above state average.
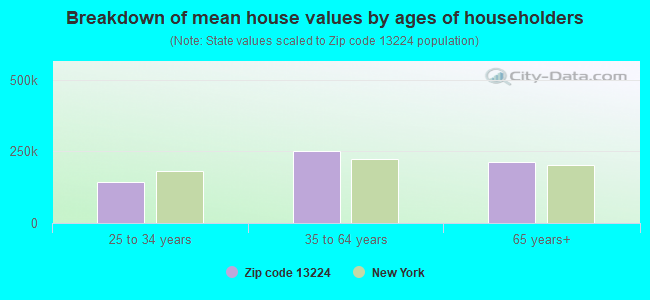
Estimated median house/condo value in 2022: $196,187
13224:
$196,187
New York:
$400,400
According to our research of New York and other state lists, there were 9 registered sex offenders living in 13224 zip code as of April 27, 2024. The ratio of all residents to sex offenders in zip code 13224 is 965 to 1. The ratio of registered sex offenders to all residents in this zip code is near the state average.
Median resident age:
This zip code:
41.9 years
New York median age:
40.0 years
Average household size:
This zip code:
2.3 people
New York:
2.5 people
Averages for the 2020 tax year for zip code 13224, filed in 2021:
Average Adjusted Gross Income (AGI) in 2020: $74,892 (Individual Income Tax Returns)
Here:
$74,892
State:
$90,930
Salary/wage: $55,812 (reported on 80.0% of returns)
Here:
$55,812
State:
$72,104
(% of AGI for various income ranges: 1105.1% for AGIs below $25k, 3580.5% for AGIs $25k-50k, 6272.8% for AGIs $50k-75k, 8999.1% for AGIs $75k-100k, 18285.5% for AGIs $100k-200k, 77275.0% for AGIs over 200k)
Taxable interest for individuals: $1,692 (reported on 37.5% of returns)
This zip code:
$1,692
New York:
$3,075
(% of AGI for various income ranges: 10.3% for AGIs below $25k, 12.7% for AGIs $25k-50k, 42.8% for AGIs $50k-75k, 69.5% for AGIs $75k-100k, 164.5% for AGIs $100k-200k, 2745.0% for AGIs over 200k)
Ordinary dividends: $9,391 (reported on 23.3% of returns)
Here:
$9,391
State:
$11,095
(% of AGI for various income ranges: 24.0% for AGIs below $25k, 38.6% for AGIs $25k-50k, 106.7% for AGIs $50k-75k, 354.1% for AGIs $75k-100k, 609.7% for AGIs $100k-200k, 9396.7% for AGIs over 200k)
Net capital gain/loss in AGI: +$18,646 (reported on 20.0% of returns)
Here:
+$18,646
State:
+$44,925
(% of AGI for various income ranges: 16.4% for AGIs below $25k, 10.7% for AGIs $25k-50k, 63.2% for AGIs $50k-75k, 309.1% for AGIs $75k-100k, 728.7% for AGIs $100k-200k, 20675.0% for AGIs over 200k)
Profit/loss from business: +$12,144 (reported on 16.7% of returns)
Here:
+$12,144
State:
+$14,940
(% of AGI for various income ranges: 83.4% for AGIs below $25k, 87.2% for AGIs $25k-50k, 134.2% for AGIs $50k-75k, 322.7% for AGIs $75k-100k, 577.1% for AGIs $100k-200k, 6713.3% for AGIs over 200k)
Taxable individual retirement arrangement distribution: $23,655 (reported on 9.9% of returns)
13224:
$23,655
New York:
$19,609
(% of AGI for various income ranges: 28.1% for AGIs below $25k, 73.6% for AGIs $25k-50k, 242.8% for AGIs $50k-75k, 576.4% for AGIs $75k-100k, 1359.0% for AGIs $100k-200k, 4303.3% for AGIs over 200k)
Self-employed (Keogh) retirement plans: $25,329 (reported on 1.7% of returns)
13224:
$25,329
New York:
$32,497
(% of AGI for various income ranges: 125.8% for AGIs $100k-200k, 2305.0% for AGIs over 200k)
Total itemized deductions: $32,697 (reported on 7.5% of returns)
Here:
$32,697
State:
$39,326
(% of AGI for various income ranges: 51.4% for AGIs below $25k, 87.8% for AGIs $25k-50k, 251.5% for AGIs $50k-75k, 424.1% for AGIs $75k-100k, 939.4% for AGIs $100k-200k, 7270.0% for AGIs over 200k)
Charity contributions: $14,462 (reported on 6.1% of returns)
Here:
$14,462
State:
$15,420
(% of AGI for various income ranges: 11.8% for AGIs below $25k, 36.5% for AGIs $50k-75k, 85.0% for AGIs $75k-100k, 241.3% for AGIs $100k-200k, 4271.7% for AGIs over 200k)
Taxes paid: $8,832 (reported on 7.3% of returns)
13224:
$8,832
State:
$9,183
(% of AGI for various income ranges: 13.6% for AGIs below $25k, 22.9% for AGIs $25k-50k, 81.2% for AGIs $50k-75k, 183.6% for AGIs $75k-100k, 303.2% for AGIs $100k-200k, 1235.0% for AGIs over 200k)
Earned income credit: $2,204 (reported on 17.2% of returns)
Here:
$2,204
State:
$2,138
(% of AGI for various income ranges: 100.9% for AGIs below $25k, 72.9% for AGIs $25k-50k)
Percentage of individuals using paid preparers for their 2020 taxes: 94.3%
Here:
94%
State:
95%
(% for various income ranges: 93.3% for AGIs below $25k, 95.4% for AGIs $25k-50k, 93.0% for AGIs $50k-75k, 91.9% for AGIs $75k-100k, 95.2% for AGIs $100k-200k, 100.0% for AGIs over 200k)
Averages for the 2012 tax year for zip code 13224, filed in 2013:
Average Adjusted Gross Income (AGI) in 2012: $62,918 (Individual Income Tax Returns)
Here:
$62,918
State:
$77,088
Salary/wage: $47,138 (reported on 83.3% of returns)
Here:
$47,138
State:
$60,593
(% of AGI for various income ranges: 75.8% for AGIs below $25k, 79.6% for AGIs $25k-50k, 69.8% for AGIs $50k-75k, 67.1% for AGIs $75k-100k, 61.4% for AGIs $100k-200k, 47.1% for AGIs over 200k)
Taxable interest for individuals: $1,230 (reported on 40.7% of returns)
This zip code:
$1,230
New York:
$3,125
(% of AGI for various income ranges: 0.8% for AGIs below $25k, 0.3% for AGIs $25k-50k, 0.7% for AGIs $50k-75k, 0.7% for AGIs $75k-100k, 0.8% for AGIs $100k-200k, 1.1% for AGIs over 200k)
Ordinary dividends: $6,867 (reported on 25.7% of returns)
Here:
$6,867
State:
$10,299
(% of AGI for various income ranges: 1.4% for AGIs below $25k, 1.4% for AGIs $25k-50k, 2.1% for AGIs $50k-75k, 1.8% for AGIs $75k-100k, 3.0% for AGIs $100k-200k, 4.3% for AGIs over 200k)
Net capital gain/loss in AGI: +$6,363 (reported on 20.0% of returns)
Here:
+$6,363
State:
+$42,474
(% of AGI for various income ranges: 0.3% for AGIs $25k-50k, 0.2% for AGIs $50k-75k, 1.3% for AGIs $75k-100k, 1.9% for AGIs $100k-200k, 4.6% for AGIs over 200k)
Profit/loss from business: +$17,897 (reported on 15.7% of returns)
Here:
+$17,897
State:
+$16,168
(% of AGI for various income ranges: 5.2% for AGIs below $25k, 1.8% for AGIs $25k-50k, 3.4% for AGIs $50k-75k, 2.7% for AGIs $75k-100k, 5.0% for AGIs $100k-200k, 6.1% for AGIs over 200k)
Taxable individual retirement arrangement distribution: $18,408 (reported on 11.9% of returns)
13224:
$18,408
New York:
$17,621
(% of AGI for various income ranges: 2.0% for AGIs below $25k, 2.2% for AGIs $25k-50k, 3.1% for AGIs $50k-75k, 4.9% for AGIs $75k-100k, 5.3% for AGIs $100k-200k, 2.4% for AGIs over 200k)
Self-employment retirement plans: $27,538 (reported on 1.9% of returns)
13224:
$27,538
New York:
$27,330
Total itemized deductions: $24,576 (20% of AGI, reported on 36.0% of returns)
Here:
$24,576
State:
$34,985
Here:
19.8% of AGI
State:
21.3% of AGI
(% of AGI for various income ranges: 6.7% for AGIs below $25k, 11.2% for AGIs $25k-50k, 13.8% for AGIs $50k-75k, 15.0% for AGIs $75k-100k, 15.9% for AGIs $100k-200k, 15.3% for AGIs over 200k)
Charity contributions: $4,457 (reported on 31.9% of returns)
Here:
$4,457
State:
$5,572
(% of AGI for various income ranges: 0.7% for AGIs below $25k, 1.4% for AGIs $25k-50k, 2.3% for AGIs $50k-75k, 2.1% for AGIs $75k-100k, 2.8% for AGIs $100k-200k, 2.7% for AGIs over 200k)
Taxes paid: $13,088 (reported on 36.0% of returns)
13224:
$13,088
State:
$18,656
(% of AGI for various income ranges: 2.1% for AGIs below $25k, 3.8% for AGIs $25k-50k, 5.9% for AGIs $50k-75k, 7.0% for AGIs $75k-100k, 8.5% for AGIs $100k-200k, 10.6% for AGIs over 200k)
Earned income credit: $2,290 (reported on 20.7% of returns)
Here:
$2,290
State:
$2,230
(% of AGI for various income ranges: 7.9% for AGIs below $25k, 1.1% for AGIs $25k-50k)
Percentage of individuals using paid preparers for their 2012 taxes: 52.1%
Here:
52%
State:
66%
(% for various income ranges: 45.8% for AGIs below $25k, 46.2% for AGIs $25k-50k, 55.4% for AGIs $50k-75k, 60.0% for AGIs $75k-100k, 64.7% for AGIs $100k-200k, 78.9% for AGIs over 200k)
Averages for the 2004 tax year for zip code 13224, filed in 2005:
Average Adjusted Gross Income (AGI) in 2004: $53,952 (Individual Income Tax Returns)
Here:
$53,952
State:
$59,519
Salary/wage: $43,302 (reported on 82.6% of returns)
Here:
$43,302
State:
$50,673
(% of AGI for various income ranges: 130.4% for AGIs below $10k, 72.8% for AGIs $10k-25k, 77.9% for AGIs $25k-50k, 75.1% for AGIs $50k-75k, 68.7% for AGIs $75k-100k, 56.6% for AGIs over 100k)
Taxable interest for individuals: $1,617 (reported on 54.5% of returns)
This zip code:
$1,617
New York:
$2,377
(% of AGI for various income ranges: 6.3% for AGIs below $10k, 2.2% for AGIs $10k-25k, 1.5% for AGIs $25k-50k, 2.1% for AGIs $50k-75k, 1.9% for AGIs $75k-100k, 1.2% for AGIs over 100k)
Taxable dividends: $3,923 (reported on 34.8% of returns)
Here:
$3,923
State:
$5,394
(% of AGI for various income ranges: 7.5% for AGIs below $10k, 1.7% for AGIs $10k-25k, 1.8% for AGIs $25k-50k, 2.2% for AGIs $50k-75k, 2.1% for AGIs $75k-100k, 3.0% for AGIs over 100k)
Net capital gain/loss: +$7,355 (reported on 27.4% of returns)
Here:
+$7,355
State:
+$23,581
(% of AGI for various income ranges: -4.9% for AGIs below $10k, 0.7% for AGIs $10k-25k, 0.8% for AGIs $25k-50k, 0.3% for AGIs $50k-75k, 1.1% for AGIs $75k-100k, 7.2% for AGIs over 100k)
Profit/loss from business: +$16,227 (reported on 15.4% of returns)
Here:
+$16,227
State:
+$13,809
(% of AGI for various income ranges: 4.5% for AGIs below $10k, 3.8% for AGIs $10k-25k, 3.2% for AGIs $25k-50k, 2.8% for AGIs $50k-75k, 3.6% for AGIs $75k-100k, 6.1% for AGIs over 100k)
IRA payment deduction: $2,789 (reported on 2.4% of returns)
13224:
$2,789
New York:
$3,115
(% of AGI for various income ranges: 0.3% for AGIs $10k-25k, 0.2% for AGIs $25k-50k, 0.1% for AGIs $50k-75k, 0.1% for AGIs $75k-100k, 0.1% for AGIs over 100k)
Self-employed pension: $13,872 (reported on 2.8% of returns)
Here:
$13,872
New York:
$19,016
(% of AGI for various income ranges: 0.3% for AGIs $25k-50k, 0.2% for AGIs $50k-75k, 0.3% for AGIs $75k-100k, 1.3% for AGIs over 100k)
Total itemized deductions: $19,156 (19% of AGI, reported on 40.6% of returns)
Here:
$19,156
State:
$25,864
Here:
19.4% of AGI
State:
21.9% of AGI
(% of AGI for various income ranges: 8.8% for AGIs below $10k, 9.6% for AGIs $10k-25k, 11.7% for AGIs $25k-50k, 16.1% for AGIs $50k-75k, 16.7% for AGIs $75k-100k, 14.9% for AGIs over 100k)
Charity contributions deductions: $4,016 (4% of AGI, reported on 38.0% of returns)
Here:
$4,016
State:
$4,439
Here:
4.0% of AGI
State:
3.6% of AGI
(% of AGI for various income ranges: 0.7% for AGIs below $10k, 1.4% for AGIs $10k-25k, 2.0% for AGIs $25k-50k, 2.5% for AGIs $50k-75k, 2.8% for AGIs $75k-100k, 3.5% for AGIs over 100k)
Total tax: $9,861 (reported on 74.8% of returns)
13224:
$9,861
State:
$11,730
(% of AGI for various income ranges: 2.9% for AGIs below $10k, 3.7% for AGIs $10k-25k, 7.3% for AGIs $25k-50k, 10.0% for AGIs $50k-75k, 11.6% for AGIs $75k-100k, 19.2% for AGIs over 100k)
Earned income credit: $1,668 (reported on 16.5% of returns)
Here:
$1,668
State:
$1,757
Percentage of individuals using paid preparers for their 2004 taxes: 62.4%
Here:
62%
State:
67%
(% for various income ranges: 54.0% for AGIs below $10k, 62.8% for AGIs $10k-25k, 61.4% for AGIs $25k-50k, 61.9% for AGIs $50k-75k, 68.7% for AGIs $75k-100k, 72.9% for AGIs over 100k)
Likely homosexual households (counted as self-reported same-sex unmarried-partner households)
Lesbian couples: 1.1% of all households
Gay men: 0.0% of all households
Household received Food Stamps/SNAP in the past 12 months: 724 Household did not receive Food Stamps/SNAP in the past 12 months: 3,002
Women who had a birth in the past 12 months: 61 (48 now married, 12 unmarried) Women who did not have a birth in the past 12 months: 2,045 (702 now married, 1,345 unmarried)
Housing units in zip code 13224 with a mortgage: 1,335 (182 second mortgage, 184 both second mortgage and home equity loan) Houses without a mortgage: 10
Median monthly owner costs for units with a mortgage: $1,498 Median monthly owner costs for units without a mortgage: $688
Residents with income below the poverty level in 2022:
This zip code:
14.2%
Whole state:
14.3%
Residents with income below 50% of the poverty level in 2022:
This zip code:
5.6%
Whole state:
6.8%
Median number of rooms in houses and condos:
Here:
7.0
State:
6.3
Median number of rooms in apartments:
Here:
4.0
State:
3.8
Notable locations in this zip code not listed on our city pages
Notable locations in zip code 13224: Drumlins Country Club East Golf Course (A), McKeon House (B), Elmcrest Childrens Center (C), Onondaga County Public Library Soule Branch (D). Display/hide their locations on the map
Churches in zip code 13224 include: Bethany Baptist Church (A), First Unitarian Universalist Church (B), Our Lady of Solace Church (C), Sovereign Grace Baptist Church (D), Saint Alban's Episcopal Church (E), Saint Mary's Russian Orthodox Church (F), Saint Sophia's Greek Orthodox Church (G). Display/hide their locations on the map
In group quarters: 282 (-1 institutionalized population)
Size of family households: 1,018 2-persons, 623 3-persons, 395 4-persons, 139 5-persons, 23 6-persons, 11 7-or-more-persons
Size of nonfamily households: 1,295 1-person, 110 2-persons, 90 3-persons
921 married couples with children.
751 single-parent households (103 men, 648 women).
85.0% of residents of 13224 zip code speak English at home.
6.7% of residents speak Spanish at home (65% very well, 8% well, 5% not well, 23% not at all).
4.9% of residents speak other Indo-European language at home (56% very well, 9% well, 28% not well, 6% not at all).
1.1% of residents speak Asian or Pacific Island language at home (82% very well, 18% well).
2.4% of residents speak other language at home (86% very well, 13% well, 1% not well).
Foreign born population: 1,223 (14.0%) (64.4% of them are naturalized citizens)
Facilities with environmental interests located in this zip code:
H.W. SMITH ES ( in SYRACUSE, NY)
(National Center for Education Statistics) - STATE ID-421800010031 Organizations: SYRACUSE CITY SD (SCHOOL DISTRICT)
AAMCO TRANSMISSIONS (2564 ERIE BLVD E in SYRACUSE, NY)
(Resource Conservation and Recovery Act (tracking hazardous waste))
HUDSON ROBERTA (125 FERRIS AVE in SYRACUSE, NY)
(Resource Conservation and Recovery Act (tracking hazardous waste))
AKZO COATINGS INC (2704 ERIE BLVD E in SYRACUSE, NY)
Conditionally Exempt Small Quantity Generators, less than 100 kg/month of hazardous waste (Resource Conservation and Recovery Act (tracking hazardous waste)) - notification Organizations: CASE INDUSTRIAL SUPPLY INC (CONTACT/OWNER)
ASPEN SQUARE MGMT-BRIARCLIFF ESTATES (300 AUDUBON PARKWAY in SYRACUSE, NY)
ENFORCEMENT/COMPLIANCE ACTIVITY (Integrated Compliance Information System) COMPLIANCE ACTIVITY (Tracking inspections of insecticide, fungicide, and rodenticide, and toxic substances) Business SIC classification: OPERATORS OF APARTMENT BUILDINGS Alternative names: Briarcliff Estates
CRISAFULLI ENVIRON SVC INC (204-206 GENESEE PARK DR in SYRACUSE, NY)
Small Quantity Generators, between 100 kg and 1000 kg of hazardous waste/month (Resource Conservation and Recovery Act (tracking hazardous waste)) - notification Organizations: LEPORA PAIGE (CONTACT/OWNER)
ALL PUTTER CO INC (115 CROYDEN LANE in DEWITT, NY)
COMPLIANCE ACTIVITY (Tracking inspections of insecticide, fungicide, and rodenticide, and toxic substances)
H.W. SMITH ELEMENTARY SCHOOL (1130 ASLT SPRING RD in SYRACUSE, NY)
COMPLIANCE ACTIVITY (Tracking inspections of insecticide, fungicide, and rodenticide, and toxic substances)
Housing units lacking complete plumbing facilities: 0.7% Housing units lacking complete kitchen facilities: 1.9%
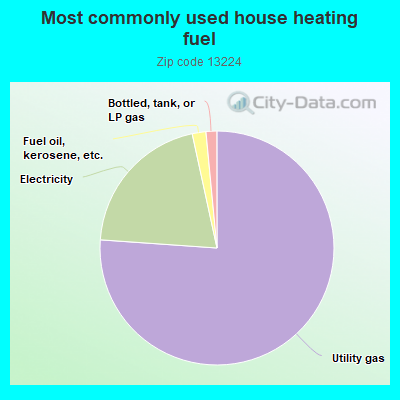
76.2%Utility gas
20.5%Electricity
1.9%Fuel oil, kerosene, etc.
1.5%Bottled, tank, or LP gas
Population in 1990: 9,845.
Place of birth for U.S.-born residents:
This state: 5,778
Northeast: 318
Midwest: 309
South: 701
West: 223
65% of the 13224 zip code residents lived in the same house 5 years ago. Out of people who lived in different houses, 76% lived in this county. Out of people who lived in different counties, 50% lived in New York.
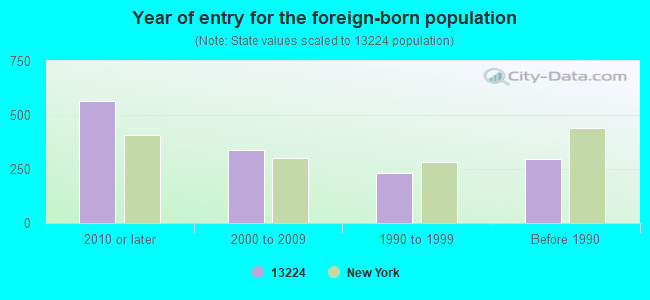
88% of the 13224 zip code residents lived in the same house 1 year ago. Out of people who lived in different houses, 56% moved from this county. Out of people who lived in different houses, 15% moved from different county within same state. Out of people who lived in different houses, 26% moved from different state. Out of people who lived in different houses, 3% moved from abroad.
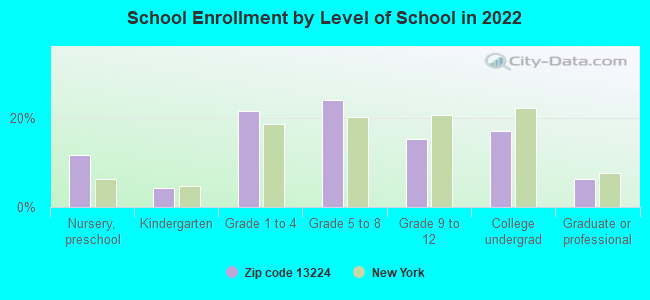
Private vs. public school enrollment:
Students in private schools in grades 1 to 8 (elementary and middle school): 87
Here:
8.8%
New York:
15.6%
Students in private schools in grades 9 to 12 (high school):
Here:
0.0%
New York:
15.0%
Students in private undergraduate colleges: 258
Here:
68.4%
New York:
39.2%
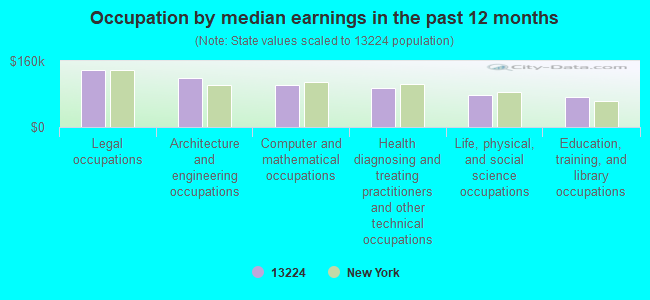
Occupation by median earnings in the past 12 months ($)
138,404Legal occupations
118,083Architecture and engineering occupations
101,727Computer and mathematical occupations
95,081Health diagnosing and treating practitioners and other technical occupations
76,616Life, physical, and social science occupations
73,422Education, training, and library occupations
Top industries in this zip code by the number of employees in 2005:
Health Care and Social Assistance: Other Residential Care Facilities (250-499 employees: 1 establishment)
2002 - 2018 National Fire Incident Reporting System (NFIRS) incidents
Based on the data from the years 2002 - 2018 the average number of fires per year is 34. The highest number of fire incidents - 73 took place in 2017, and the least - 0 in 2011. The data has a rising trend.
When looking into fire subcategories, the most incidents belonged to: Structure Fires (72.5%), and Outside Fires (18.5%).
Fire incident types reported to NFIRS in Zip Code 13224

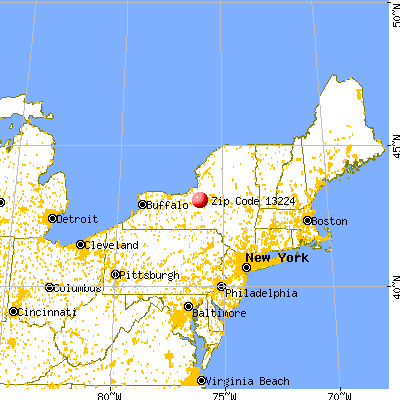


 Nearest zip codes: 13210, 13214, 13206, 13203, 13202, 13205.


 Based on the data from the years 2002 - 2018 the average number of fires per year is 34. The highest number of fire incidents - 73 took place in 2017, and the least - 0 in 2011. The data has a rising trend.
 When looking into fire subcategories, the most incidents belonged to: Structure Fires (72.5%), and Outside Fires (18.5%).