Estimated zip code population in 2022: 17,782 Zip code population in 2010: 19,201 Zip code population in 2000: 20,592
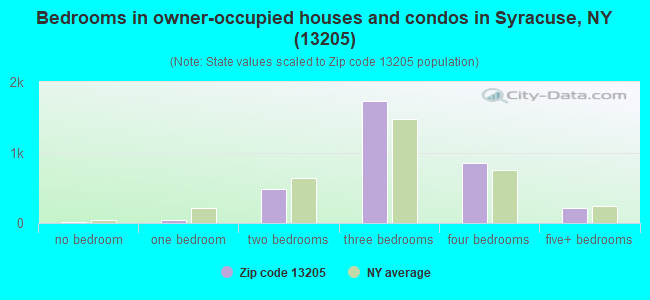
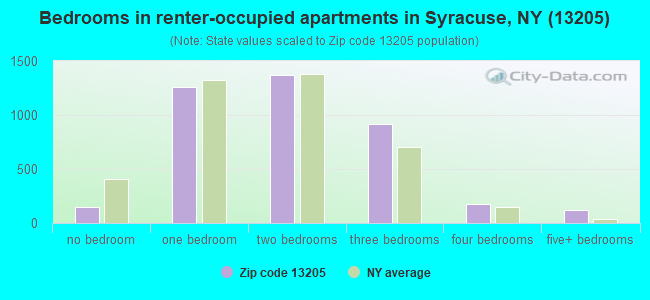
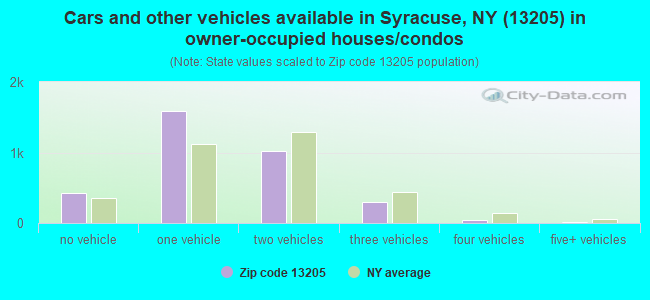
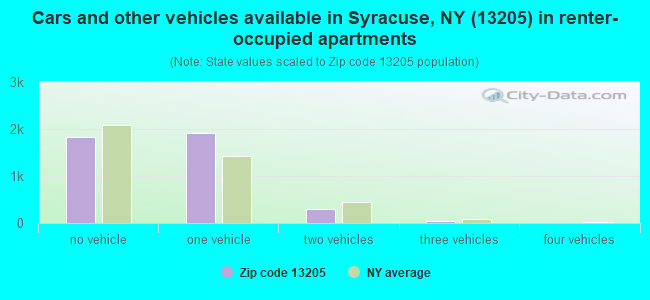
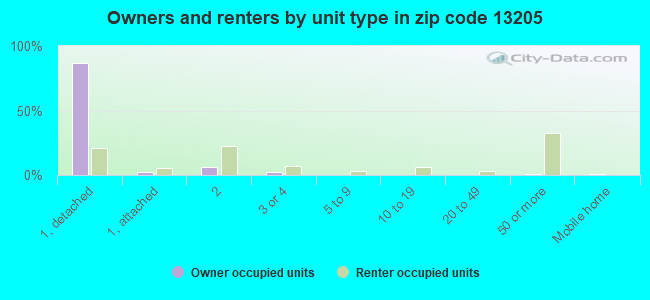
Houses and condos: 9,082 Renter-occupied apartments: 4,033
% of renters here:
55%
State:
46%
March 2022 cost of living index in zip code 13205: 101.6 (near average, U.S. average is 100)
Land area: 3.4 sq. mi. Water area: 0.0 sq. mi.
Population density: 5,155 people per square mile
(average).
OSM Map
General Map
Google Map
MSN Map
OSM Map
General Map
Google Map
MSN Map
OSM Map
General Map
Google Map
MSN Map
OSM Map
General Map
Google Map
MSN Map
Please wait while loading the map...
Real estate property taxes paid for housing units in 2022:
This zip code:
2.6% ($2,527)
New York:
1.5% ($6,180)
Median real estate property taxes paid for housing units with mortgages in 2022: $2,648 (2.5%) Median real estate property taxes paid for housing units with no mortgage in 2022: $2,367 (2.6%)
Averages for the 2020 tax year for zip code 13205, filed in 2021:
Average Adjusted Gross Income (AGI) in 2020: $34,705 (Individual Income Tax Returns)
Here:
$34,705
State:
$90,930
Salary/wage: $30,836 (reported on 84.8% of returns)
Here:
$30,836
State:
$72,104
(% of AGI for various income ranges: 1101.9% for AGIs below $25k, 3575.9% for AGIs $25k-50k, 6854.0% for AGIs $50k-75k, 9461.7% for AGIs $75k-100k, 16782.9% for AGIs $100k-200k)
Taxable interest for individuals: $367 (reported on 16.6% of returns)
This zip code:
$367
New York:
$3,075
(% of AGI for various income ranges: 4.5% for AGIs below $25k, 4.3% for AGIs $25k-50k, 14.3% for AGIs $50k-75k, 15.0% for AGIs $75k-100k, 72.9% for AGIs $100k-200k)
Ordinary dividends: $2,531 (reported on 6.5% of returns)
Here:
$2,531
State:
$11,095
(% of AGI for various income ranges: 4.5% for AGIs below $25k, 10.9% for AGIs $25k-50k, 30.5% for AGIs $50k-75k, 76.2% for AGIs $75k-100k, 303.5% for AGIs $100k-200k)
Net capital gain/loss in AGI: +$3,089 (reported on 5.0% of returns)
Here:
+$3,089
State:
+$44,925
(% of AGI for various income ranges: 0.9% for AGIs below $25k, 6.8% for AGIs $25k-50k, 32.3% for AGIs $50k-75k, 109.2% for AGIs $75k-100k, 318.2% for AGIs $100k-200k)
Profit/loss from business: +$5,458 (reported on 9.5% of returns)
Here:
+$5,458
State:
+$14,940
(% of AGI for various income ranges: 63.7% for AGIs below $25k, 56.9% for AGIs $25k-50k, 46.5% for AGIs $50k-75k, 84.6% for AGIs $75k-100k, 311.8% for AGIs $100k-200k)
Taxable individual retirement arrangement distribution: $11,577 (reported on 4.6% of returns)
13205:
$11,577
New York:
$19,609
(% of AGI for various income ranges: 21.7% for AGIs below $25k, 42.7% for AGIs $25k-50k, 116.6% for AGIs $50k-75k, 285.8% for AGIs $75k-100k, 677.1% for AGIs $100k-200k)
Total itemized deductions: $24,338 (reported on 1.7% of returns)
Here:
$24,338
State:
$39,326
(% of AGI for various income ranges: 30.8% for AGIs below $25k, 128.8% for AGIs $50k-75k, 252.5% for AGIs $75k-100k, 514.1% for AGIs $100k-200k)
Charity contributions: $8,836 (reported on 1.5% of returns)
Here:
$8,836
State:
$15,420
(% of AGI for various income ranges: 3.5% for AGIs below $25k, 42.6% for AGIs $50k-75k, 87.9% for AGIs $75k-100k, 228.2% for AGIs $100k-200k)
Taxes paid: $6,262 (reported on 1.7% of returns)
13205:
$6,262
State:
$9,183
(% of AGI for various income ranges: 4.2% for AGIs below $25k, 37.1% for AGIs $50k-75k, 82.1% for AGIs $75k-100k, 153.5% for AGIs $100k-200k)
Earned income credit: $2,462 (reported on 32.0% of returns)
Here:
$2,462
State:
$2,138
(% of AGI for various income ranges: 145.1% for AGIs below $25k, 98.0% for AGIs $25k-50k)
Percentage of individuals using paid preparers for their 2020 taxes: 95.1%
Here:
95%
State:
95%
(% for various income ranges: 95.1% for AGIs below $25k, 95.6% for AGIs $25k-50k, 93.7% for AGIs $50k-75k, 94.4% for AGIs $75k-100k, 96.3% for AGIs $100k-200k, 100.0% for AGIs over 200k)
Averages for the 2012 tax year for zip code 13205, filed in 2013:
Average Adjusted Gross Income (AGI) in 2012: $30,502 (Individual Income Tax Returns)
Here:
$30,502
State:
$77,088
Salary/wage: $27,529 (reported on 85.6% of returns)
Here:
$27,529
State:
$60,593
(% of AGI for various income ranges: 74.4% for AGIs below $25k, 83.4% for AGIs $25k-50k, 78.5% for AGIs $50k-75k, 78.1% for AGIs $75k-100k, 66.4% for AGIs $100k-200k)
Taxable interest for individuals: $508 (reported on 22.4% of returns)
This zip code:
$508
New York:
$3,125
(% of AGI for various income ranges: 0.4% for AGIs below $25k, 0.2% for AGIs $25k-50k, 0.5% for AGIs $50k-75k, 0.4% for AGIs $75k-100k, 0.3% for AGIs $100k-200k)
Ordinary dividends: $2,383 (reported on 8.5% of returns)
Here:
$2,383
State:
$10,299
(% of AGI for various income ranges: 0.5% for AGIs below $25k, 0.5% for AGIs $25k-50k, 0.6% for AGIs $50k-75k, 0.8% for AGIs $75k-100k, 1.0% for AGIs $100k-200k)
Net capital gain/loss in AGI: +$2,529 (reported on 4.7% of returns)
Here:
+$2,529
State:
+$42,474
(% of AGI for various income ranges: 0.2% for AGIs $50k-75k, 2.2% for AGIs $100k-200k)
Profit/loss from business: +$7,686 (reported on 11.4% of returns)
Here:
+$7,686
State:
+$16,168
(% of AGI for various income ranges: 7.8% for AGIs below $25k, 1.1% for AGIs $25k-50k, 0.8% for AGIs $50k-75k, 1.4% for AGIs $75k-100k, 3.3% for AGIs $100k-200k)
Taxable individual retirement arrangement distribution: $9,247 (reported on 6.0% of returns)
13205:
$9,247
New York:
$17,621
(% of AGI for various income ranges: 1.6% for AGIs below $25k, 1.3% for AGIs $25k-50k, 1.9% for AGIs $50k-75k, 3.2% for AGIs $75k-100k, 2.2% for AGIs $100k-200k)
Total itemized deductions: $14,808 (23% of AGI, reported on 14.8% of returns)
Here:
$14,808
State:
$34,985
Here:
22.6% of AGI
State:
21.3% of AGI
(% of AGI for various income ranges: 3.2% for AGIs below $25k, 5.8% for AGIs $25k-50k, 9.2% for AGIs $50k-75k, 9.7% for AGIs $75k-100k, 11.3% for AGIs $100k-200k)
Charity contributions: $3,423 (reported on 11.7% of returns)
Here:
$3,423
State:
$5,572
(% of AGI for various income ranges: 0.4% for AGIs below $25k, 0.9% for AGIs $25k-50k, 1.6% for AGIs $50k-75k, 2.2% for AGIs $75k-100k, 2.4% for AGIs $100k-200k)
Taxes paid: $5,728 (reported on 14.6% of returns)
13205:
$5,728
State:
$18,656
(% of AGI for various income ranges: 0.7% for AGIs below $25k, 2.0% for AGIs $25k-50k, 3.5% for AGIs $50k-75k, 3.8% for AGIs $75k-100k, 5.5% for AGIs $100k-200k)
Earned income credit: $2,487 (reported on 37.6% of returns)
Here:
$2,487
State:
$2,230
(% of AGI for various income ranges: 11.4% for AGIs below $25k, 1.7% for AGIs $25k-50k)
Percentage of individuals using paid preparers for their 2012 taxes: 46.3%
Here:
46%
State:
66%
(% for various income ranges: 43.7% for AGIs below $25k, 46.0% for AGIs $25k-50k, 49.4% for AGIs $50k-75k, 58.6% for AGIs $75k-100k, 69.6% for AGIs $100k-200k)
Averages for the 2004 tax year for zip code 13205, filed in 2005:
Average Adjusted Gross Income (AGI) in 2004: $27,710 (Individual Income Tax Returns)
Here:
$27,710
State:
$59,519
Salary/wage: $26,350 (reported on 86.4% of returns)
Here:
$26,350
State:
$50,673
(% of AGI for various income ranges: 82.9% for AGIs below $10k, 79.8% for AGIs $10k-25k, 84.6% for AGIs $25k-50k, 83.8% for AGIs $50k-75k, 81.1% for AGIs $75k-100k, 77.0% for AGIs over 100k)
Taxable interest for individuals: $914 (reported on 33.0% of returns)
This zip code:
$914
New York:
$2,377
(% of AGI for various income ranges: 1.9% for AGIs below $10k, 1.2% for AGIs $10k-25k, 1.0% for AGIs $25k-50k, 0.8% for AGIs $50k-75k, 0.8% for AGIs $75k-100k, 1.4% for AGIs over 100k)
Taxable dividends: $1,600 (reported on 13.1% of returns)
Here:
$1,600
State:
$5,394
(% of AGI for various income ranges: 1.1% for AGIs below $10k, 0.8% for AGIs $10k-25k, 0.7% for AGIs $25k-50k, 0.7% for AGIs $50k-75k, 0.7% for AGIs $75k-100k, 0.9% for AGIs over 100k)
Net capital gain/loss: +$1,117 (reported on 8.3% of returns)
Here:
+$1,117
State:
+$23,581
(% of AGI for various income ranges: -0.1% for AGIs below $10k, -0.0% for AGIs $10k-25k, 0.3% for AGIs $25k-50k, 0.3% for AGIs $50k-75k, 0.4% for AGIs $75k-100k, 1.3% for AGIs over 100k)
Profit/loss from business: +$4,515 (reported on 8.2% of returns)
Here:
+$4,515
State:
+$13,809
(% of AGI for various income ranges: 3.6% for AGIs below $10k, 2.9% for AGIs $10k-25k, 1.3% for AGIs $25k-50k, 0.5% for AGIs $50k-75k, 0.6% for AGIs $75k-100k, -0.0% for AGIs over 100k)
IRA payment deduction: $2,293 (reported on 1.1% of returns)
13205:
$2,293
New York:
$3,115
(% of AGI for various income ranges: 0.1% for AGIs $10k-25k, 0.1% for AGIs $25k-50k, 0.1% for AGIs $50k-75k, 0.1% for AGIs $75k-100k)
Total itemized deductions: $12,660 (23% of AGI, reported on 19.6% of returns)
Here:
$12,660
State:
$25,864
Here:
22.5% of AGI
State:
21.9% of AGI
(% of AGI for various income ranges: 2.7% for AGIs below $10k, 4.6% for AGIs $10k-25k, 8.5% for AGIs $25k-50k, 11.3% for AGIs $50k-75k, 12.7% for AGIs $75k-100k, 12.7% for AGIs over 100k)
Charity contributions deductions: $2,968 (5% of AGI, reported on 17.1% of returns)
Here:
$2,968
State:
$4,439
Here:
5.0% of AGI
State:
3.6% of AGI
(% of AGI for various income ranges: 0.4% for AGIs below $10k, 0.8% for AGIs $10k-25k, 1.6% for AGIs $25k-50k, 2.6% for AGIs $50k-75k, 2.9% for AGIs $75k-100k, 2.6% for AGIs over 100k)
Total tax: $3,524 (reported on 59.8% of returns)
13205:
$3,524
State:
$11,730
(% of AGI for various income ranges: 1.5% for AGIs below $10k, 3.0% for AGIs $10k-25k, 6.3% for AGIs $25k-50k, 9.4% for AGIs $50k-75k, 11.0% for AGIs $75k-100k, 15.8% for AGIs over 100k)
Earned income credit: $1,787 (reported on 33.2% of returns)
Here:
$1,787
State:
$1,757
Percentage of individuals using paid preparers for their 2004 taxes: 64.8%
Here:
65%
State:
67%
(% for various income ranges: 57.9% for AGIs below $10k, 69.5% for AGIs $10k-25k, 64.4% for AGIs $25k-50k, 64.9% for AGIs $50k-75k, 70.0% for AGIs $75k-100k, 75.2% for AGIs over 100k)
Likely homosexual households (counted as self-reported same-sex unmarried-partner households)
Lesbian couples: 0.1% of all households
Gay men: 0.2% of all households
Household received Food Stamps/SNAP in the past 12 months: 2,268 Household did not receive Food Stamps/SNAP in the past 12 months: 5,240
Women who had a birth in the past 12 months: 289 (125 now married, 168 unmarried) Women who did not have a birth in the past 12 months: 3,879 (918 now married, 2,984 unmarried)
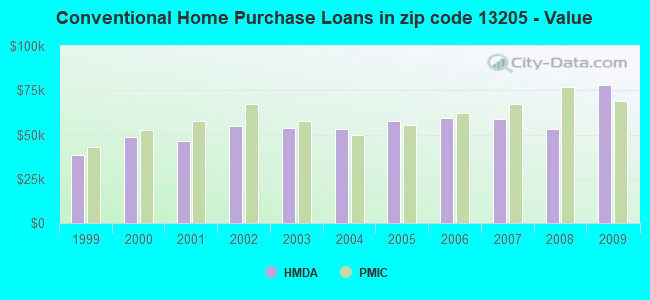
Housing units in zip code 13205 with a mortgage: 1,952 (213 second mortgage, 131 both second mortgage and home equity loan) Houses without a mortgage: 89
Median monthly owner costs for units with a mortgage: $995 Median monthly owner costs for units without a mortgage: $524
Residents with income below the poverty level in 2022:
This zip code:
29.9%
Whole state:
14.3%
Residents with income below 50% of the poverty level in 2022:
This zip code:
13.4%
Whole state:
6.8%
Median number of rooms in houses and condos:
Here:
6.7
State:
6.3
Median number of rooms in apartments:
Here:
4.5
State:
3.8
Notable locations in this zip code not listed on our city pages
Notable locations in zip code 13205: State College Experimental Station (A), Loretto Rest (B), Loretto Health and Rehabilitation Center (C), Onondaga County Public Library Beauchamp Branch (D), Onondaga County Public Library Betts Branch (E). Display/hide their locations on the map
Churches in zip code 13205 include: Antioch Baptist Church (A), Antioch Missionary Baptist Church (B), Apostolic Church of Jesus Christ (C), Atonement Lutheran Church (D), Bell Grove Missionary Baptist Church (E), Bethlehem Temple Church (F), Central Baptist Church (G), Christ Missionary Baptist Church (H), Crossroads Church of God (I). Display/hide their locations on the map
In group quarters: 1,019 (-1 institutionalized population)
Size of family households: 1,702 2-persons, 1,040 3-persons, 744 4-persons, 347 5-persons, 210 6-persons, 54 7-or-more-persons
Size of nonfamily households: 2,833 1-person, 434 2-persons, 31 3-persons
1,385 married couples with children.
2,485 single-parent households (533 men, 1,952 women).
86.7% of residents of 13205 zip code speak English at home.
4.9% of residents speak Spanish at home (71% very well, 14% well, 15% not well).
2.4% of residents speak other Indo-European language at home (78% very well, 11% well, 6% not well, 5% not at all).
2.9% of residents speak Asian or Pacific Island language at home (32% very well, 49% well, 20% not well).
3.4% of residents speak other language at home (35% very well, 57% well, 6% not well, 2% not at all).
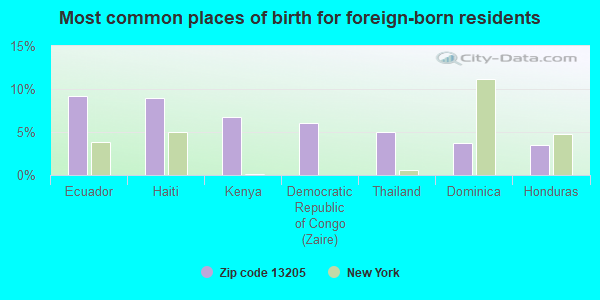
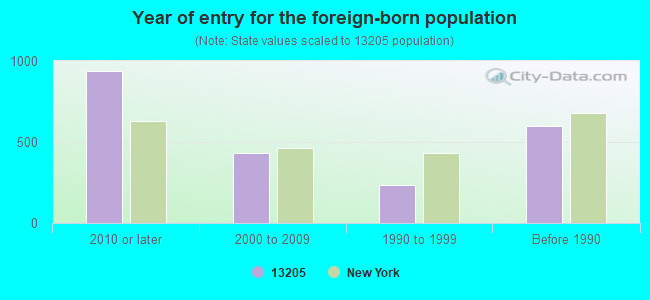
Foreign born population: 1,889 (10.6%) (54.8% of them are naturalized citizens)
Major facilities with environmental interests located in this zip code:
GROUP HOME ( in SYRACUSE, NY)
(National Center for Education Statistics) - STATE ID-421800893001 (National Center for Education Statistics) - STATE ID-421800893003 (National Center for Education Statistics) - STATE ID-421800893005 (National Center for Education Statistics) - STATE ID-421800893006 Organizations: SYRACUSE CITY SD (SCHOOL DISTRICT)
CNY CENTRO INC (200 CORTLAND AVE in SYRACUSE, NY)
STATE MASTER (New York facility tracking) - AIR PROGRAM, HAZARDOUS WASTE PROGRAM HAZARDOUS WASTE BIENNIAL REPORTER (Resource Conservation and Recovery Act (tracking hazardous waste)) Large Quantity Generators, more that 1000 kg of hazardous waste/month (Resource Conservation and Recovery Act (tracking hazardous waste)) Business SIC classification: LOCAL AND SUBURBAN TRANSIT Business NAICS classification: BUS AND OTHER MOTOR VEHICLE TRANSIT SYSTEMS. Organizations: CENTRAL NEW YORK REGIONAL TRANSPORTATION AUTHORITY Alternative names: C N Y CENTRO INC, CENTRAL NY REG TRANSPORTATION AUTHORITY
ANAREN MICROWAVE INC. (185 AINSLEY DR in SYRACUSE, NY)
CRISAFULLI ENVIRON SVC INC (209 HUBBELL AVE in SYRACUSE, NY)
Conditionally Exempt Small Quantity Generators, less than 100 kg/month of hazardous waste (Resource Conservation and Recovery Act (tracking hazardous waste)) - notification Small Quantity Generators, between 100 kg and 1000 kg of hazardous waste/month (Resource Conservation and Recovery Act (tracking hazardous waste)) - notification Organizations: JOSE & ELAINE JIMENEZ (CONTACT/OWNER)
, JOHN STUBBS (CONTACT/OWNER)
CRISAFULLI ENVIRON SVC INC (1064 W ONONDAGA ST in SYRACUSE, NY)
(Resource Conservation and Recovery Act (tracking hazardous waste)) Organizations: BRENDA SPAIGHTS (CONTACT/OWNER)
A R C CANNAVINO ENTERPRISE INC (1501 S SALINA ST in SYRACUSE, NY)
(Resource Conservation and Recovery Act (tracking hazardous waste))
GRAVINA NURSERY INC SALES YARD (4344 S SALINA ST CORNER OF in SYRACUSE, NY)
(Resource Conservation and Recovery Act (tracking hazardous waste))
GRAVINA RONALD A (4338-4340 S SALINA ST in SYRACUSE, NY)
(Resource Conservation and Recovery Act (tracking hazardous waste))
HOXIE PAINTING CO INC (4615 S SALINA ST in SYRACUSE, NY)
(Resource Conservation and Recovery Act (tracking hazardous waste))
CRIPPEN APARTMENTS (216 CRIPPEN AVENUE in SYRACUSE, NY)
ENFORCEMENT/COMPLIANCE ACTIVITY (Integrated Compliance Information System) COMPLIANCE ACTIVITY (Tracking inspections of insecticide, fungicide, and rodenticide, and toxic substances) Business SIC classification: OPERATORS OF APARTMENT BUILDINGS Alternative names: CRIPPEN APTS
CLEMONS ALLEN & REBECCA (217 W BRIGTON AVE in SYRACUSE, NY)
(Resource Conservation and Recovery Act (tracking hazardous waste))
A E T USED OIL SERVICES (201 FILLMORE AVE in SYRACUSE, NY)
TRANSPORTER (Resource Conservation and Recovery Act (tracking hazardous waste)) Organizations: WILLIAM JONES (CONTACT/OWNER)
GRAHAM SAM & MARY (140 GLENWOOD AVE in SYRACUSE, NY)
Small Quantity Generators, between 100 kg and 1000 kg of hazardous waste/month (Resource Conservation and Recovery Act (tracking hazardous waste)) - notification Organizations: SAM & MARY GRAHAM (CONTACT/OWNER)
Housing units lacking complete plumbing facilities: 3.1% Housing units lacking complete kitchen facilities: 8.4%
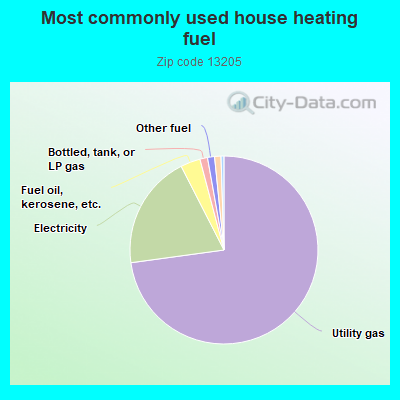
72.7%Utility gas
19.6%Electricity
3.4%Fuel oil, kerosene, etc.
1.3%Bottled, tank, or LP gas
1.2%Other fuel
1.1%No fuel used
0.5%Wood
Population in 1990: 23,048.
Place of birth for U.S.-born residents:
This state: 12,691
Northeast: 447
Midwest: 369
South: 1,852
West: 223
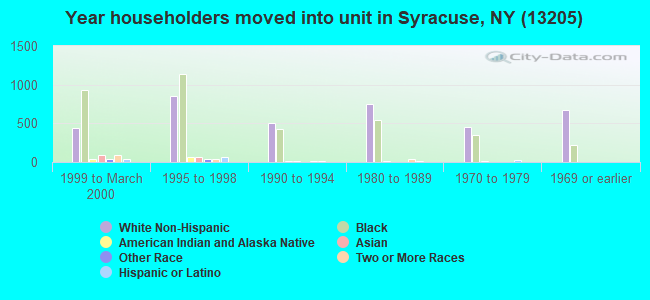
54% of the 13205 zip code residents lived in the same house 5 years ago. Out of people who lived in different houses, 84% lived in this county. Out of people who lived in different counties, 50% lived in New York.
87% of the 13205 zip code residents lived in the same house 1 year ago. Out of people who lived in different houses, 71% moved from this county. Out of people who lived in different houses, 14% moved from different county within same state. Out of people who lived in different houses, 7% moved from different state. Out of people who lived in different houses, 7% moved from abroad.
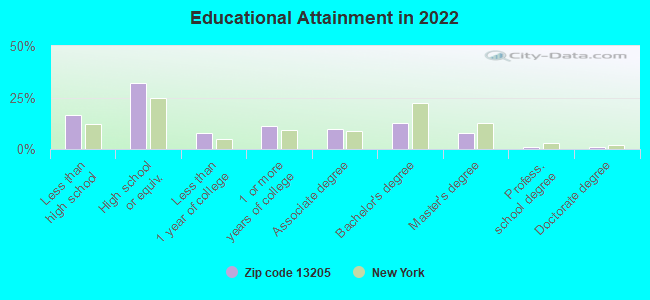
Private vs. public school enrollment:
Students in private schools in grades 1 to 8 (elementary and middle school): 159
Here:
8.9%
New York:
15.6%
Students in private schools in grades 9 to 12 (high school): 24
Here:
2.1%
New York:
15.0%
Students in private undergraduate colleges: 171
Here:
29.6%
New York:
39.2%
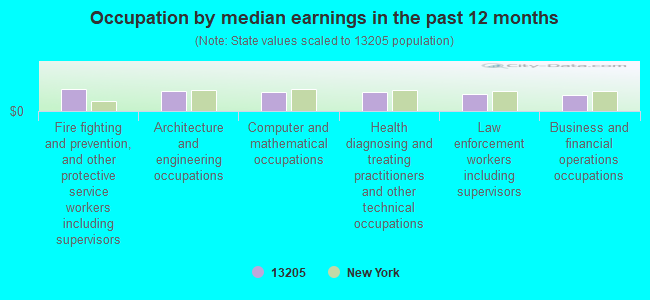
Occupation by median earnings in the past 12 months ($)
85,139Fire fighting and prevention, and other protective service workers including supervisors
78,186Architecture and engineering occupations
75,051Computer and mathematical occupations
72,211Health diagnosing and treating practitioners and other technical occupations
65,298Law enforcement workers including supervisors
62,902Business and financial operations occupations
Companies with federal contracts located in this zip code:
JEMCOAT, INC (191 INTREPID LANE in SYRACUSE, NY; small business) : $13,619,706 in 10 contractsfrom 2003 to 2006
Contracts for Construction of Structures and Facilities -- Other Administrative Facilities and Service Buildings, Maintenance, Repair or Alteration of Real Property -- Highways, Roads, Streets, Bridges, and Railways (includes resurfacing) by Army, Air Force Signed by year:2000: $0; 2001: $0; 2002: $0; 2003: $6,252,000; 2004: $7,232,182; 2005: $132,324; 2006: $3,200.
Biggest contracts:
$6,252,000 with Army for Construction of Structures and Facilities -- Other Administrative Facilities and Service Buildings. Signed on 2003-09-24. Completion date: 2004-10-31.
$5,849,000, same as above.Signed on 2004-08-26. Completion date: 2005-09-30.
$920,000, same as above.Signed on 2004-11-03. Completion date: 2005-09-30.
$210,000, same as above.Signed on 2004-09-20. Completion date: 2005-06-30.
M A BONGIOVANNI INC (1400 JAMESVILLE AVE in SYRACUSE, NY) : $805,140 in 3 contractsfrom 2003 to 2004
$805,140 with U.S. Army Corps of Engineers - civil program financing only for Construction of Structures and Facilities -- Other Non-Building Facilities. Signed on 2003-07-22. Completion date: 2004-02-03.
$12,603 with Army for Construction of Structures and Facilities -- Other Non-Building Facilities. Signed on 2004-09-22. Completion date: 2004-02-03.
-$12,603, same as above.Signed on 2004-09-22. Completion date: 2004-02-03.
DUNK & BRIGHT FURNITURE CO INC (2648 S SALINA ST in SYRACUSE, NY; small business) : $16,632 in 2 contractsin 2004
$9,600 with Army for Installation of Equipment -- Furniture. Signed on 2004-04-12. Completion date: 2004-05-24.
$7,032, same as above.Signed on 2004-03-15. Completion date: 2004-04-30.
Top industries in this zip code by the number of employees in 2005:
Health Care and Social Assistance: Nursing Care Facilities (500-999 employees: 1 establishment, 100-249 employees: 1 establishment, 10-19 employees: 1 establishment)
Health Care and Social Assistance: Community Food Services (250-499: 1)
Other Services (except Public Administration): Religious Organizations (20-49: 2, 10-19: 2, 5-9: 2, 1-4: 9)
2007 - 2018 National Fire Incident Reporting System (NFIRS) incidents
Based on the data from the years 2007 - 2018 the average number of fires per year is 109. The highest number of fire incidents - 148 took place in 2010, and the least - 7 in 2011. The data has a rising trend.
When looking into fire subcategories, the most incidents belonged to: Structure Fires (67.0%), and Outside Fires (23.1%).
Fire incident types reported to NFIRS in Zip Code 13205

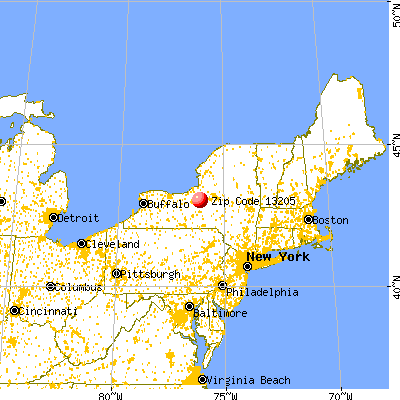


 Nearest zip codes: 13207, 13210, 13202, 13224, 13203, 13204.


 Based on the data from the years 2007 - 2018 the average number of fires per year is 109. The highest number of fire incidents - 148 took place in 2010, and the least - 7 in 2011. The data has a rising trend.
 When looking into fire subcategories, the most incidents belonged to: Structure Fires (67.0%), and Outside Fires (23.1%).