Estimated zip code population in 2022: 12,581 Zip code population in 2010: 13,897 Zip code population in 2000: 14,890
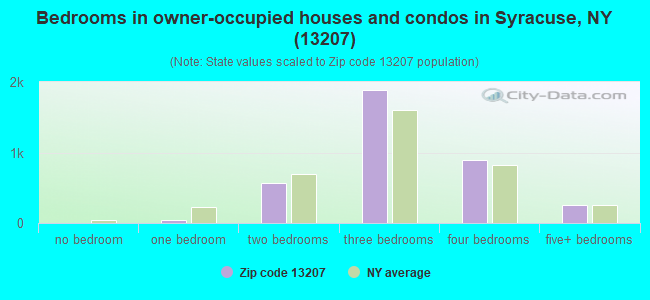
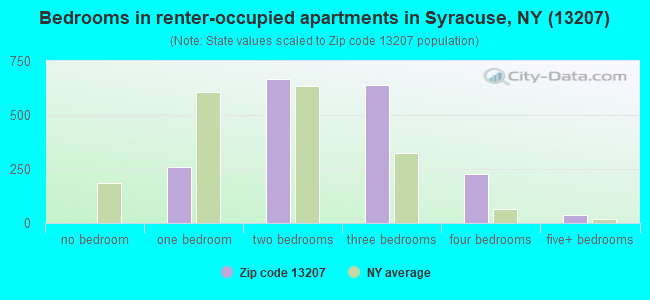
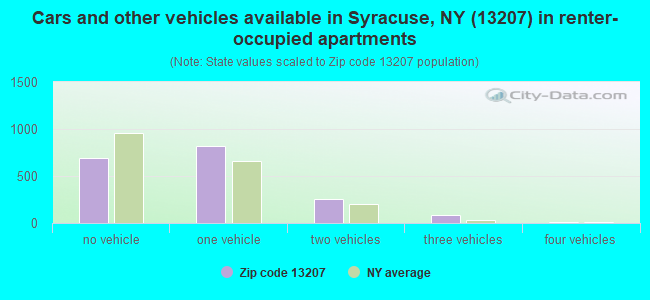
Houses and condos: 6,137 Renter-occupied apartments: 1,860
% of renters here:
34%
State:
46%
March 2022 cost of living index in zip code 13207: 101.3 (near average, U.S. average is 100)
Land area: 3.1 sq. mi. Water area: 0.0 sq. mi.
Population density: 4,071 people per square mile
(average).
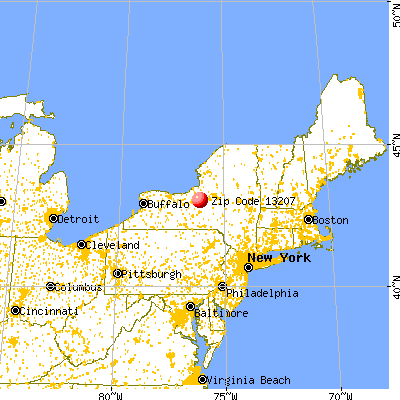
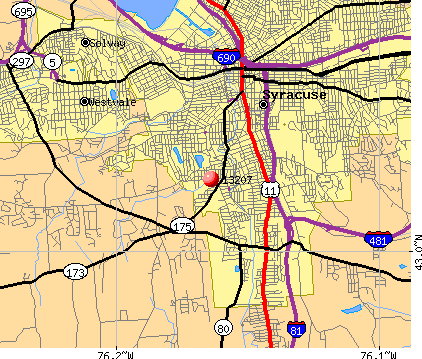
OSM Map
General Map
Google Map
MSN Map
OSM Map
General Map
Google Map
MSN Map
OSM Map
General Map
Google Map
MSN Map
OSM Map
General Map
Google Map
MSN Map
Please wait while loading the map...
Real estate property taxes paid for housing units in 2022:
This zip code:
2.7% ($2,854)
New York:
1.5% ($6,180)
Median real estate property taxes paid for housing units with mortgages in 2022: $3,131 (2.6%) Median real estate property taxes paid for housing units with no mortgage in 2022: $2,540 (2.6%)
Business Search- 14 Million verified businesses
Males: 5,937
(47.2%)
Females: 6,644
(52.8%)
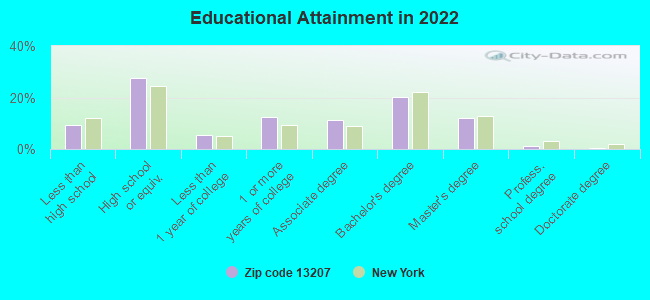
For population 25 years and over in 13207:
High school or higher: 90.4%
Bachelor's degree or higher: 33.6%
Graduate or professional degree: 13.6%
Unemployed: 5.3%
Mean travel time to work (commute): 17.3 minutes
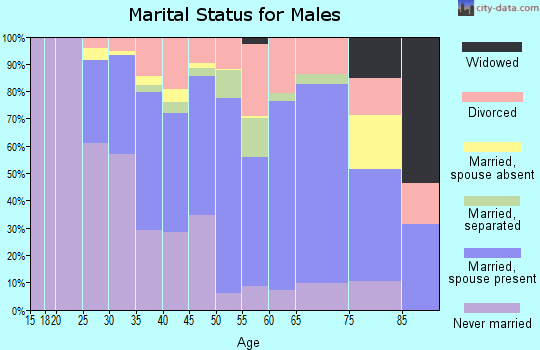
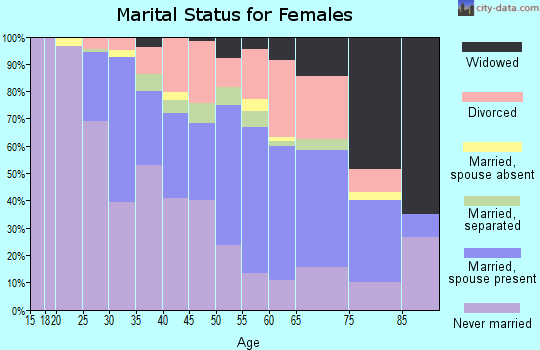
For population 15 years and over in 13207:
Never married: 45.2%
Now married: 37.0%
Separated: 2.3%
Widowed: 4.0%
Divorced: 11.6%
Zip code 13207 compared to state average:
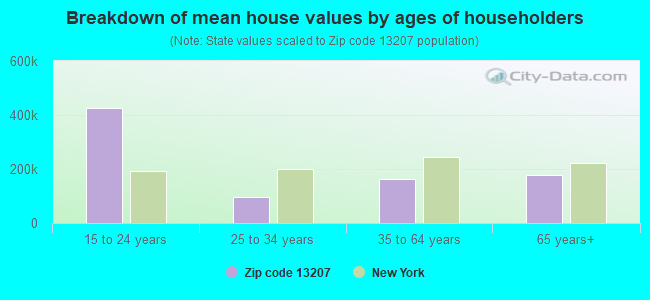
Median house value significantly below state average.
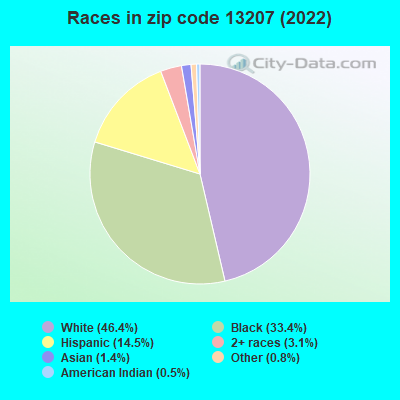
Black race population percentage above state average.
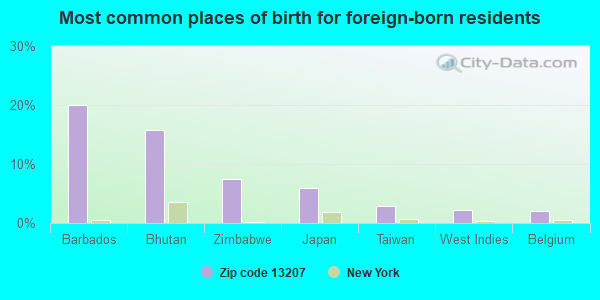
Foreign-born population percentage significantly below state average.
Averages for the 2020 tax year for zip code 13207, filed in 2021:
Average Adjusted Gross Income (AGI) in 2020: $45,644 (Individual Income Tax Returns)
Here:
$45,644
State:
$90,930
Salary/wage: $39,238 (reported on 84.3% of returns)
Here:
$39,238
State:
$72,104
(% of AGI for various income ranges: 1121.2% for AGIs below $25k, 3450.6% for AGIs $25k-50k, 6582.5% for AGIs $50k-75k, 8894.7% for AGIs $75k-100k, 17003.5% for AGIs $100k-200k, 54493.3% for AGIs over 200k)
Taxable interest for individuals: $653 (reported on 24.6% of returns)
This zip code:
$653
New York:
$3,075
(% of AGI for various income ranges: 6.6% for AGIs below $25k, 7.2% for AGIs $25k-50k, 29.2% for AGIs $50k-75k, 42.7% for AGIs $75k-100k, 116.9% for AGIs $100k-200k, 473.3% for AGIs over 200k)
Ordinary dividends: $3,049 (reported on 11.4% of returns)
Here:
$3,049
State:
$11,095
(% of AGI for various income ranges: 10.9% for AGIs below $25k, 13.4% for AGIs $25k-50k, 48.0% for AGIs $50k-75k, 77.7% for AGIs $75k-100k, 261.2% for AGIs $100k-200k, 1763.3% for AGIs over 200k)
Net capital gain/loss in AGI: +$6,239 (reported on 9.1% of returns)
Here:
+$6,239
State:
+$44,925
(% of AGI for various income ranges: 4.0% for AGIs below $25k, 15.2% for AGIs $25k-50k, 43.7% for AGIs $50k-75k, 110.0% for AGIs $75k-100k, 518.8% for AGIs $100k-200k, 4246.7% for AGIs over 200k)
Profit/loss from business: +$11,089 (reported on 11.6% of returns)
Here:
+$11,089
State:
+$14,940
(% of AGI for various income ranges: 74.1% for AGIs below $25k, 58.5% for AGIs $25k-50k, 111.4% for AGIs $50k-75k, 223.7% for AGIs $75k-100k, 608.5% for AGIs $100k-200k, 9106.7% for AGIs over 200k)
Taxable individual retirement arrangement distribution: $12,959 (reported on 6.3% of returns)
13207:
$12,959
New York:
$19,609
(% of AGI for various income ranges: 31.1% for AGIs below $25k, 71.6% for AGIs $25k-50k, 99.2% for AGIs $50k-75k, 231.7% for AGIs $75k-100k, 768.1% for AGIs $100k-200k)
Self-employed (Keogh) retirement plans: $19,300 (reported on 0.5% of returns)
13207:
$19,300
New York:
$32,497
(% of AGI for various income ranges: 222.7% for AGIs $100k-200k)
Total itemized deductions: $21,670 (reported on 3.2% of returns)
Here:
$21,670
State:
$39,326
(% of AGI for various income ranges: 46.9% for AGIs $25k-50k, 93.1% for AGIs $50k-75k, 352.0% for AGIs $75k-100k, 426.2% for AGIs $100k-200k, 2686.7% for AGIs over 200k)
Charity contributions: $7,527 (reported on 2.4% of returns)
Here:
$7,527
State:
$15,420
(% of AGI for various income ranges: 3.5% for AGIs $25k-50k, 21.5% for AGIs $50k-75k, 78.3% for AGIs $75k-100k, 134.2% for AGIs $100k-200k, 1163.3% for AGIs over 200k)
Taxes paid: $7,647 (reported on 3.0% of returns)
13207:
$7,647
State:
$9,183
(% of AGI for various income ranges: 10.7% for AGIs $25k-50k, 39.4% for AGIs $50k-75k, 126.0% for AGIs $75k-100k, 173.5% for AGIs $100k-200k, 650.0% for AGIs over 200k)
Earned income credit: $2,396 (reported on 26.5% of returns)
Here:
$2,396
State:
$2,138
(% of AGI for various income ranges: 134.0% for AGIs below $25k, 96.0% for AGIs $25k-50k)
Percentage of individuals using paid preparers for their 2020 taxes: 94.9%
Here:
95%
State:
95%
(% for various income ranges: 94.4% for AGIs below $25k, 96.0% for AGIs $25k-50k, 94.4% for AGIs $50k-75k, 93.2% for AGIs $75k-100k, 95.7% for AGIs $100k-200k, 90.0% for AGIs over 200k)
Averages for the 2012 tax year for zip code 13207, filed in 2013:
Average Adjusted Gross Income (AGI) in 2012: $39,067 (Individual Income Tax Returns)
Here:
$39,067
State:
$77,088
Salary/wage: $34,477 (reported on 86.1% of returns)
Here:
$34,477
State:
$60,593
(% of AGI for various income ranges: 75.0% for AGIs below $25k, 83.4% for AGIs $25k-50k, 79.3% for AGIs $50k-75k, 75.5% for AGIs $75k-100k, 73.9% for AGIs $100k-200k, 50.9% for AGIs over 200k)
Taxable interest for individuals: $521 (reported on 29.3% of returns)
This zip code:
$521
New York:
$3,125
(% of AGI for various income ranges: 0.5% for AGIs below $25k, 0.3% for AGIs $25k-50k, 0.3% for AGIs $50k-75k, 0.3% for AGIs $75k-100k, 0.5% for AGIs $100k-200k, 0.6% for AGIs over 200k)
Ordinary dividends: $2,374 (reported on 12.6% of returns)
Here:
$2,374
State:
$10,299
(% of AGI for various income ranges: 0.6% for AGIs below $25k, 0.5% for AGIs $25k-50k, 0.6% for AGIs $50k-75k, 1.0% for AGIs $75k-100k, 0.8% for AGIs $100k-200k, 2.0% for AGIs over 200k)
Net capital gain/loss in AGI: +$2,084 (reported on 7.9% of returns)
Here:
+$2,084
State:
+$42,474
(% of AGI for various income ranges: 0.1% for AGIs $25k-50k, 0.3% for AGIs $50k-75k, 0.4% for AGIs $75k-100k, 0.6% for AGIs $100k-200k, 2.1% for AGIs over 200k)
Profit/loss from business: +$10,989 (reported on 11.8% of returns)
Here:
+$10,989
State:
+$16,168
(% of AGI for various income ranges: 6.7% for AGIs below $25k, 2.1% for AGIs $25k-50k, 1.5% for AGIs $50k-75k, 1.8% for AGIs $75k-100k, 3.5% for AGIs $100k-200k, 8.0% for AGIs over 200k)
Taxable individual retirement arrangement distribution: $10,022 (reported on 7.4% of returns)
13207:
$10,022
New York:
$17,621
(% of AGI for various income ranges: 1.7% for AGIs below $25k, 1.3% for AGIs $25k-50k, 1.9% for AGIs $50k-75k, 2.0% for AGIs $75k-100k, 3.5% for AGIs $100k-200k)
Self-employment retirement plans: $20,900 (reported on 0.5% of returns)
13207:
$20,900
New York:
$27,330
Total itemized deductions: $15,655 (20% of AGI, reported on 23.5% of returns)
Here:
$15,655
State:
$34,985
Here:
20.0% of AGI
State:
21.3% of AGI
(% of AGI for various income ranges: 4.5% for AGIs below $25k, 7.5% for AGIs $25k-50k, 9.9% for AGIs $50k-75k, 10.8% for AGIs $75k-100k, 12.8% for AGIs $100k-200k, 13.4% for AGIs over 200k)
Charity contributions: $3,024 (reported on 19.3% of returns)
Here:
$3,024
State:
$5,572
(% of AGI for various income ranges: 0.5% for AGIs below $25k, 0.8% for AGIs $25k-50k, 1.5% for AGIs $50k-75k, 1.6% for AGIs $75k-100k, 2.2% for AGIs $100k-200k, 3.9% for AGIs over 200k)
Taxes paid: $7,330 (reported on 23.5% of returns)
13207:
$7,330
State:
$18,656
(% of AGI for various income ranges: 1.1% for AGIs below $25k, 2.9% for AGIs $25k-50k, 4.4% for AGIs $50k-75k, 5.2% for AGIs $75k-100k, 7.1% for AGIs $100k-200k, 7.9% for AGIs over 200k)
Earned income credit: $2,408 (reported on 29.3% of returns)
Here:
$2,408
State:
$2,230
(% of AGI for various income ranges: 10.0% for AGIs below $25k, 1.2% for AGIs $25k-50k)
Percentage of individuals using paid preparers for their 2012 taxes: 48.7%
Here:
49%
State:
66%
(% for various income ranges: 43.8% for AGIs below $25k, 45.7% for AGIs $25k-50k, 57.8% for AGIs $50k-75k, 61.5% for AGIs $75k-100k, 61.8% for AGIs $100k-200k, 83.3% for AGIs over 200k)
Averages for the 2004 tax year for zip code 13207, filed in 2005:
Average Adjusted Gross Income (AGI) in 2004: $35,072 (Individual Income Tax Returns)
Here:
$35,072
State:
$59,519
Salary/wage: $32,686 (reported on 87.9% of returns)
Here:
$32,686
State:
$50,673
(% of AGI for various income ranges: 91.1% for AGIs below $10k, 80.6% for AGIs $10k-25k, 86.5% for AGIs $25k-50k, 83.6% for AGIs $50k-75k, 85.6% for AGIs $75k-100k, 71.3% for AGIs over 100k)
Taxable interest for individuals: $740 (reported on 40.6% of returns)
This zip code:
$740
New York:
$2,377
(% of AGI for various income ranges: 2.2% for AGIs below $10k, 1.0% for AGIs $10k-25k, 0.6% for AGIs $25k-50k, 0.9% for AGIs $50k-75k, 0.4% for AGIs $75k-100k, 1.2% for AGIs over 100k)
Taxable dividends: $1,678 (reported on 17.4% of returns)
Here:
$1,678
State:
$5,394
(% of AGI for various income ranges: 2.1% for AGIs below $10k, 0.9% for AGIs $10k-25k, 0.6% for AGIs $25k-50k, 0.6% for AGIs $50k-75k, 0.6% for AGIs $75k-100k, 1.4% for AGIs over 100k)
Net capital gain/loss: +$2,483 (reported on 11.5% of returns)
Here:
+$2,483
State:
+$23,581
(% of AGI for various income ranges: -1.1% for AGIs below $10k, -0.0% for AGIs $10k-25k, 0.3% for AGIs $25k-50k, 0.5% for AGIs $50k-75k, 0.5% for AGIs $75k-100k, 2.9% for AGIs over 100k)
Profit/loss from business: +$8,404 (reported on 9.8% of returns)
Here:
+$8,404
State:
+$13,809
(% of AGI for various income ranges: 4.4% for AGIs below $10k, 3.0% for AGIs $10k-25k, 1.0% for AGIs $25k-50k, 1.7% for AGIs $50k-75k, 3.8% for AGIs $75k-100k, 3.2% for AGIs over 100k)
IRA payment deduction: $2,398 (reported on 1.7% of returns)
13207:
$2,398
New York:
$3,115
(% of AGI for various income ranges: 0.1% for AGIs $10k-25k, 0.2% for AGIs $25k-50k, 0.1% for AGIs $50k-75k, 0.2% for AGIs $75k-100k)
Self-employed pension: $11,925 (reported on 0.7% of returns)
Here:
$11,925
New York:
$19,016
Total itemized deductions: $13,734 (20% of AGI, reported on 27.2% of returns)
Here:
$13,734
State:
$25,864
Here:
20.1% of AGI
State:
21.9% of AGI
(% of AGI for various income ranges: 4.9% for AGIs below $10k, 5.2% for AGIs $10k-25k, 8.9% for AGIs $25k-50k, 11.9% for AGIs $50k-75k, 14.3% for AGIs $75k-100k, 13.8% for AGIs over 100k)
Charity contributions deductions: $2,583 (4% of AGI, reported on 24.9% of returns)
Here:
$2,583
State:
$4,439
Here:
3.7% of AGI
State:
3.6% of AGI
(% of AGI for various income ranges: 0.3% for AGIs below $10k, 0.7% for AGIs $10k-25k, 1.4% for AGIs $25k-50k, 2.0% for AGIs $50k-75k, 2.6% for AGIs $75k-100k, 2.8% for AGIs over 100k)
Total tax: $4,851 (reported on 68.2% of returns)
13207:
$4,851
State:
$11,730
(% of AGI for various income ranges: 1.5% for AGIs below $10k, 3.4% for AGIs $10k-25k, 6.7% for AGIs $25k-50k, 9.7% for AGIs $50k-75k, 10.9% for AGIs $75k-100k, 17.0% for AGIs over 100k)
Earned income credit: $1,792 (reported on 25.3% of returns)
Here:
$1,792
State:
$1,757
Percentage of individuals using paid preparers for their 2004 taxes: 60.2%
Here:
60%
State:
67%
(% for various income ranges: 51.0% for AGIs below $10k, 64.7% for AGIs $10k-25k, 60.4% for AGIs $25k-50k, 62.3% for AGIs $50k-75k, 60.5% for AGIs $75k-100k, 69.6% for AGIs over 100k)
Likely homosexual households (counted as self-reported same-sex unmarried-partner households)
Lesbian couples: 0.3% of all households
Gay men: 0.7% of all households
Household received Food Stamps/SNAP in the past 12 months: 1,402 Household did not receive Food Stamps/SNAP in the past 12 months: 4,167
Women who had a birth in the past 12 months: 176 (93 now married, 84 unmarried) Women who did not have a birth in the past 12 months: 3,053 (922 now married, 2,140 unmarried)
Housing units in zip code 13207 with a mortgage: 2,185 (231 second mortgage, 173 both second mortgage and home equity loan) Houses without a mortgage: 92
Median monthly owner costs for units with a mortgage: $1,125 Median monthly owner costs for units without a mortgage: $512
Residents with income below the poverty level in 2022:
This zip code:
26.7%
Whole state:
14.3%
Residents with income below 50% of the poverty level in 2022:
This zip code:
12.1%
Whole state:
6.8%
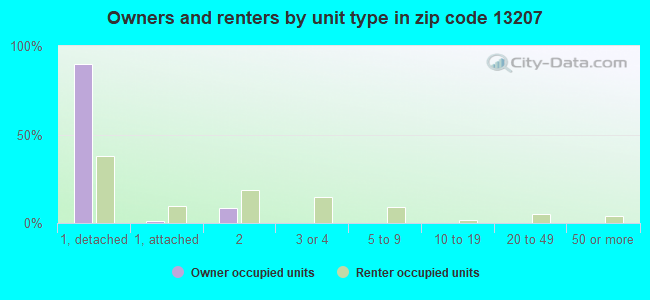
Median number of rooms in houses and condos:
Here:
6.8
State:
6.3
Median number of rooms in apartments:
Here:
5.2
State:
3.8
Notable locations in this zip code not listed on our city pages
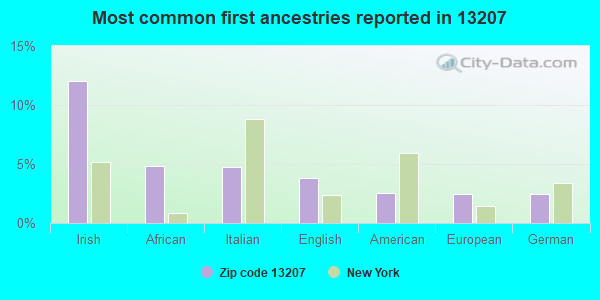
Churches in zip code 13207 include: Saint Paul's United Methodist Church (A), Elmwood Presbyterian Church (B), Faith Missionary Baptist Church (C), Fountain of Life Church of God in Christ (D), God's Temple of Faith (E), Grace Baptist Church (F), Onondaga Valley Presbyterian Church (G), Our Lady of Lourdes Catholic Church (H), Southside Church of Christ (I). Display/hide their locations on the map
1,163 married couples with children.
1,518 single-parent households (174 men, 1,344 women).
91.1% of residents of 13207 zip code speak English at home.
6.5% of residents speak Spanish at home (75% very well, 21% well, 4% not well).
0.9% of residents speak other Indo-European language at home (78% very well, 22% not well).
0.7% of residents speak Asian or Pacific Island language at home (67% very well, 33% well).
0.4% of residents speak other language at home (76% very well, 24% not well).
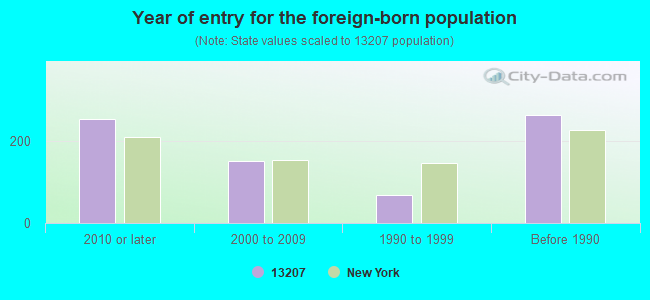
Foreign born population: 405 (3.2%) (62.4% of them are naturalized citizens)
Facilities with environmental interests located in this zip code:
CORCORAN HIGH SCHOOL (919 GLENWOOD AVE in SYRACUSE, NY)
STATE MASTER (New York facility tracking) - SECTION 404 PERMITTING, 401 CERTIFICATION, 401 CERTIFICATION, National Pollutant Discharge Elimination System Permit COMPLIANCE ACTIVITY (Tracking inspections of insecticide, fungicide, and rodenticide, and toxic substances) Organizations: SYRACUSE CITY SCH DIST
CORCORAN HS ( in SYRACUSE, NY)
(National Center for Education Statistics) - STATE ID-421800010033 Organizations: SYRACUSE CITY SD (SCHOOL DISTRICT)
BELLEVUE ES (530 STOLP AVE in SYRACUSE, NY)
(National Center for Education Statistics) - STATE ID-421800010004 Organizations: SYRACUSE CITY SD (SCHOOL DISTRICT)
HARRY OSBORNE CO INC (115 VALLEY DR in SYRACUSE, NY)
(Resource Conservation and Recovery Act (tracking hazardous waste))
HARRY OSBORNE CO INC (1835 SOUTH AVE in SYRACUSE, NY)
(Resource Conservation and Recovery Act (tracking hazardous waste))
BELLVUE COUNTRY CLUB (1901 GLENWOOD AVE in SYRACUSE, NY)
(Resource Conservation and Recovery Act (tracking hazardous waste))
CLASSIC AMERICAN TOWNHOMES AND APARTMENTS (300 MAINS AVENUE in SYRACUSE, NY)
ENFORCEMENT/COMPLIANCE ACTIVITY (Integrated Compliance Information System) COMPLIANCE ACTIVITY (Tracking inspections of insecticide, fungicide, and rodenticide, and toxic substances) Business SIC classification: OPERATORS OF APARTMENT BUILDINGS Alternative names: CLASSIC AMERICAN TOWN HOMES & APTS
HOLT PAINTING CO INC (611 SOUTH AVE in SYRACUSE, NY)
Small Quantity Generators, between 100 kg and 1000 kg of hazardous waste/month (Resource Conservation and Recovery Act (tracking hazardous waste)) - notification Organizations: BOB HOLT (CONTACT/OWNER)
CONIFER-SENECA GARDENS (104 RIVERDALE DRIVE in SYRACUSE, NY)
ENFORCEMENT/COMPLIANCE ACTIVITY (Integrated Compliance Information System) COMPLIANCE ACTIVITY (Tracking inspections of insecticide, fungicide, and rodenticide, and toxic substances) Business SIC classification: OPERATORS OF APARTMENT BUILDINGS
CHESTNUT ANDREW & DEBRA (131 ANNETTA ST in SYRACUSE, NY)
Small Quantity Generators, between 100 kg and 1000 kg of hazardous waste/month (Resource Conservation and Recovery Act (tracking hazardous waste)) - notification Organizations: ANDREW & DEBRA CHESTNUT (CONTACT/OWNER)
CLARK MYRTLE (1009 BALLANTYNE RD in SYRACUSE, NY)
Small Quantity Generators, between 100 kg and 1000 kg of hazardous waste/month (Resource Conservation and Recovery Act (tracking hazardous waste)) - notification Organizations: MYRTLE CLARK (CONTACT/OWNER)
Housing units lacking complete plumbing facilities: 1.9% Housing units lacking complete kitchen facilities: 2.7%
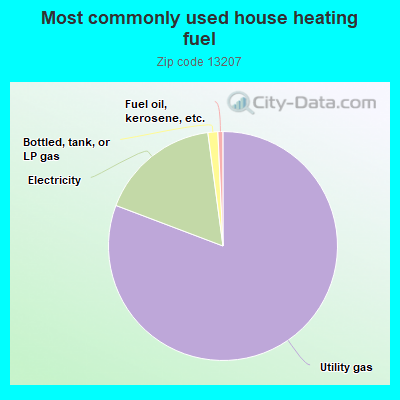
80.2%Utility gas
17.0%Electricity
1.4%Bottled, tank, or LP gas
0.7%Fuel oil, kerosene, etc.
Population in 1990: 16,380.
Place of birth for U.S.-born residents:
This state: 9,989
Northeast: 384
Midwest: 318
South: 693
West: 455
53% of the 13207 zip code residents lived in the same house 5 years ago. Out of people who lived in different houses, 82% lived in this county. Out of people who lived in different counties, 50% lived in New York.
94% of the 13207 zip code residents lived in the same house 1 year ago. Out of people who lived in different houses, 74% moved from this county. Out of people who lived in different houses, 15% moved from different county within same state. Out of people who lived in different houses, 3% moved from different state. Out of people who lived in different houses, 5% moved from abroad.
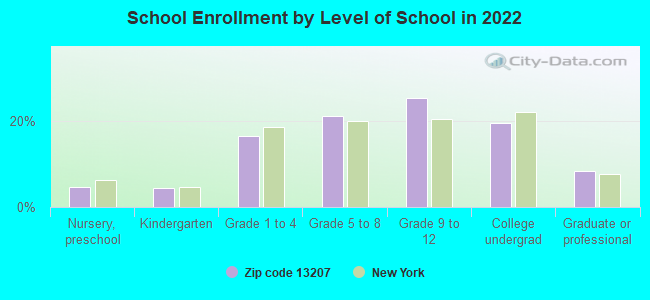
Private vs. public school enrollment:
Students in private schools in grades 1 to 8 (elementary and middle school): 109
Here:
10.1%
New York:
15.6%
Students in private schools in grades 9 to 12 (high school): 106
Here:
14.7%
New York:
15.0%
Students in private undergraduate colleges: 127
Here:
22.8%
New York:
39.2%
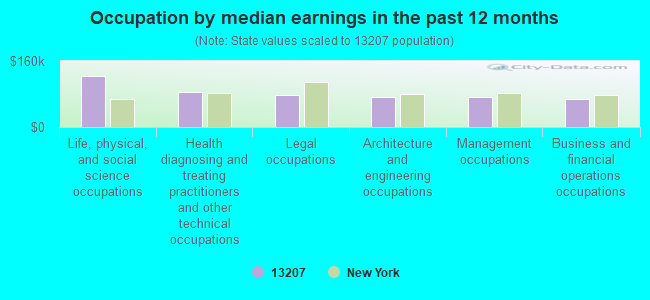
Occupation by median earnings in the past 12 months ($)
123,300Life, physical, and social science occupations
85,913Health diagnosing and treating practitioners and other technical occupations
78,507Legal occupations
73,793Architecture and engineering occupations
73,738Management occupations
67,572Business and financial operations occupations
Companies with federal contracts located in this zip code:
ROBERT HENTY SNOWPLOWING & LAN (220 HANCOCK DRIVE in SYRACUSE, NY; small business) : $465,544 in 2 contractsin 2001
$450,000 with Army for Landscaping/Groundskeeping Services. Signed on 2001-06-14. Completion date: 2002-02-28.
$15,544 with Army for Surveillance Services. Signed on 2001-07-03. Completion date: 2002-02-28.
BUILDING ENERGY TECHNOLOGIES (205 STRATHMORE DRIVE in SYRACUSE, NY; small business) : -$1,100 in 2 contractsin 2002
$0 with Army for Compressors and Vacuum Pumps. Signed on 2002-10-16. Completion date: 2002-08-23.
-$1,100, same as above.Signed on 2002-10-16. Completion date: 2002-08-23.
Top industries in this zip code by the number of employees in 2005:
Arts, Entertainment, and Recreation: Golf Courses and Country Clubs (50-99 employees: 1 establishment)
Finance and Insurance: Reinsurance Carriers (50-99: 1)
2007 - 2018 National Fire Incident Reporting System (NFIRS) incidents
Based on the data from the years 2007 - 2018 the average number of fires per year is 55. The highest number of fire incidents - 73 took place in 2016, and the least - 0 in 2011. The data has a rising trend.
When looking into fire subcategories, the most incidents belonged to: Structure Fires (55.9%), and Outside Fires (35.9%).
Fire incident types reported to NFIRS in Zip Code 13207


 Nearest zip codes: 13205, 13202, 13204, 13210, 13203, 13290.


 Based on the data from the years 2007 - 2018 the average number of fires per year is 55. The highest number of fire incidents - 73 took place in 2016, and the least - 0 in 2011. The data has a rising trend.
 When looking into fire subcategories, the most incidents belonged to: Structure Fires (55.9%), and Outside Fires (35.9%).