Estimated zip code population in 2022: 18,840 Zip code population in 2010: 27,606 Zip code population in 2000: 27,352
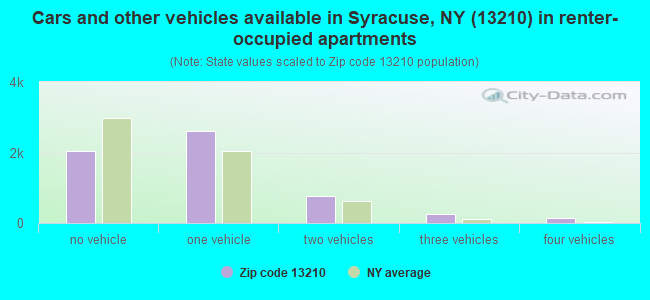
Houses and condos: 9,813 Renter-occupied apartments: 5,819
% of renters here:
74%
State:
46%
March 2022 cost of living index in zip code 13210: 104.1 (near average, U.S. average is 100)
Land area: 4.6 sq. mi. Water area: 0.0 sq. mi.
Population density: 4,126 people per square mile
(average).
OSM Map
General Map
Google Map
MSN Map
OSM Map
General Map
Google Map
MSN Map
OSM Map
General Map
Google Map
MSN Map
OSM Map
General Map
Google Map
MSN Map
Please wait while loading the map...
Real estate property taxes paid for housing units in 2022:
This zip code:
2.2% ($4,000)
New York:
1.5% ($6,180)
Median real estate property taxes paid for housing units with mortgages in 2022: $4,125 (2.2%) Median real estate property taxes paid for housing units with no mortgage in 2022: $3,667 (2.1%)
Business Search- 14 Million verified businesses
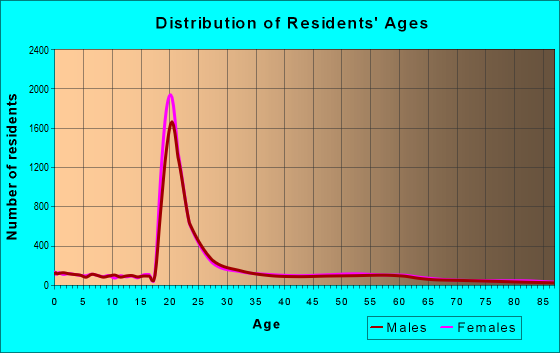
Males: 9,089
(48.2%)
Females: 9,751
(51.8%)
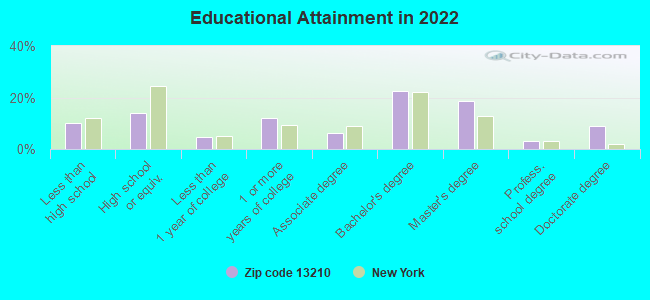
For population 25 years and over in 13210:
High school or higher: 90.8%
Bachelor's degree or higher: 53.4%
Graduate or professional degree: 30.8%
Unemployed: 5.7%
Mean travel time to work (commute): 16.0 minutes
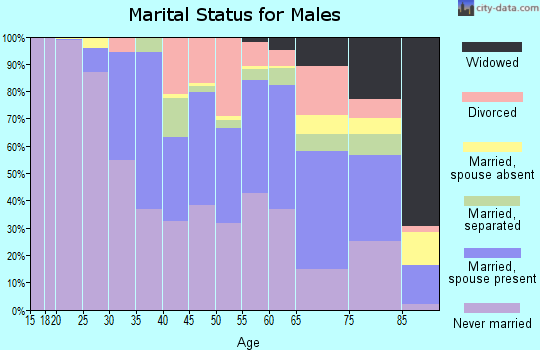
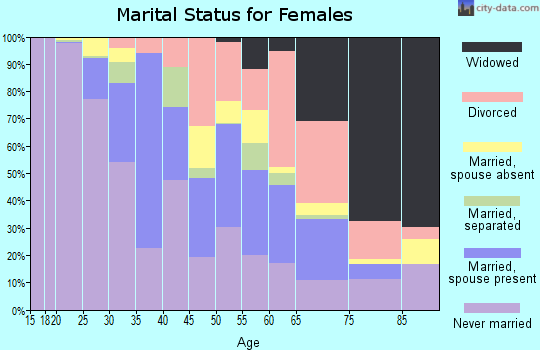
For population 15 years and over in 13210:
Never married: 67.0%
Now married: 22.0%
Separated: 2.3%
Widowed: 2.6%
Divorced: 6.2%
Zip code 13210 compared to state average:
Median household income below state average.
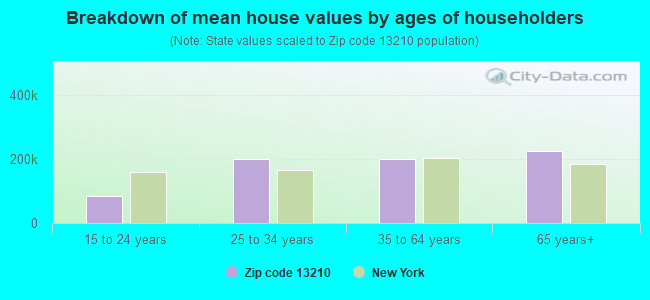
Median house value below state average.
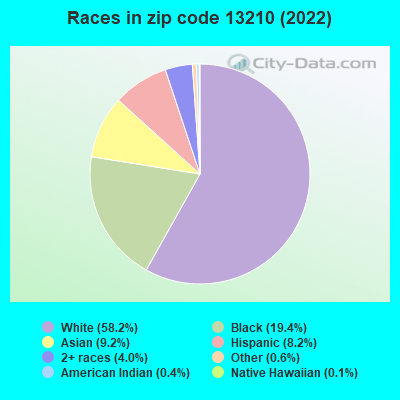
Hispanic race population percentage below state average.
Median age significantly below state average.
Renting percentage above state average.
Number of college students significantly above state average.
Averages for the 2020 tax year for zip code 13210, filed in 2021:
Average Adjusted Gross Income (AGI) in 2020: $46,200 (Individual Income Tax Returns)
Here:
$46,200
State:
$90,930
Salary/wage: $39,987 (reported on 87.2% of returns)
Here:
$39,987
State:
$72,104
(% of AGI for various income ranges: 1165.4% for AGIs below $25k, 3648.5% for AGIs $25k-50k, 6563.2% for AGIs $50k-75k, 10549.2% for AGIs $75k-100k, 18131.0% for AGIs $100k-200k, 53790.0% for AGIs over 200k)
Taxable interest for individuals: $705 (reported on 23.4% of returns)
This zip code:
$705
New York:
$3,075
(% of AGI for various income ranges: 4.5% for AGIs below $25k, 9.1% for AGIs $25k-50k, 21.9% for AGIs $50k-75k, 62.0% for AGIs $75k-100k, 118.3% for AGIs $100k-200k, 414.0% for AGIs over 200k)
Ordinary dividends: $4,146 (reported on 14.8% of returns)
Here:
$4,146
State:
$11,095
(% of AGI for various income ranges: 10.9% for AGIs below $25k, 17.5% for AGIs $25k-50k, 90.5% for AGIs $50k-75k, 194.8% for AGIs $75k-100k, 346.9% for AGIs $100k-200k, 2908.0% for AGIs over 200k)
Net capital gain/loss in AGI: +$6,681 (reported on 13.8% of returns)
Here:
+$6,681
State:
+$44,925
(% of AGI for various income ranges: 8.7% for AGIs below $25k, 31.2% for AGIs $25k-50k, 90.2% for AGIs $50k-75k, 276.4% for AGIs $75k-100k, 564.1% for AGIs $100k-200k, 4912.0% for AGIs over 200k)
Profit/loss from business: +$8,238 (reported on 13.0% of returns)
Here:
+$8,238
State:
+$14,940
(% of AGI for various income ranges: 52.7% for AGIs below $25k, 98.7% for AGIs $25k-50k, 126.3% for AGIs $50k-75k, 142.4% for AGIs $75k-100k, 572.1% for AGIs $100k-200k, 3084.0% for AGIs over 200k)
Taxable individual retirement arrangement distribution: $17,871 (reported on 5.2% of returns)
13210:
$17,871
New York:
$19,609
(% of AGI for various income ranges: 15.5% for AGIs below $25k, 38.3% for AGIs $25k-50k, 129.4% for AGIs $50k-75k, 456.4% for AGIs $75k-100k, 824.8% for AGIs $100k-200k, 1614.0% for AGIs over 200k)
Self-employed (Keogh) retirement plans: $24,700 (reported on 0.5% of returns)
13210:
$24,700
New York:
$32,497
(% of AGI for various income ranges: 255.5% for AGIs $100k-200k)
Total itemized deductions: $27,971 (reported on 3.7% of returns)
Here:
$27,971
State:
$39,326
(% of AGI for various income ranges: 67.0% for AGIs $25k-50k, 124.8% for AGIs $50k-75k, 433.6% for AGIs $75k-100k, 829.0% for AGIs $100k-200k, 2856.0% for AGIs over 200k)
Charity contributions: $9,232 (reported on 2.9% of returns)
Here:
$9,232
State:
$15,420
(% of AGI for various income ranges: 4.8% for AGIs below $25k, 25.1% for AGIs $50k-75k, 79.6% for AGIs $75k-100k, 245.5% for AGIs $100k-200k, 1160.0% for AGIs over 200k)
Taxes paid: $8,400 (reported on 3.5% of returns)
13210:
$8,400
State:
$9,183
(% of AGI for various income ranges: 14.1% for AGIs $25k-50k, 42.9% for AGIs $50k-75k, 158.8% for AGIs $75k-100k, 246.9% for AGIs $100k-200k, 672.0% for AGIs over 200k)
Earned income credit: $2,161 (reported on 20.9% of returns)
Here:
$2,161
State:
$2,138
(% of AGI for various income ranges: 92.2% for AGIs below $25k, 61.7% for AGIs $25k-50k)
Percentage of individuals using paid preparers for their 2020 taxes: 94.5%
Here:
94%
State:
95%
(% for various income ranges: 94.9% for AGIs below $25k, 95.7% for AGIs $25k-50k, 92.9% for AGIs $50k-75k, 90.2% for AGIs $75k-100k, 94.3% for AGIs $100k-200k, 92.9% for AGIs over 200k)
Averages for the 2012 tax year for zip code 13210, filed in 2013:
Average Adjusted Gross Income (AGI) in 2012: $39,564 (Individual Income Tax Returns)
Here:
$39,564
State:
$77,088
Salary/wage: $34,762 (reported on 88.8% of returns)
Here:
$34,762
State:
$60,593
(% of AGI for various income ranges: 83.8% for AGIs below $25k, 86.7% for AGIs $25k-50k, 81.9% for AGIs $50k-75k, 76.0% for AGIs $75k-100k, 76.8% for AGIs $100k-200k, 52.0% for AGIs over 200k)
Taxable interest for individuals: $703 (reported on 28.5% of returns)
This zip code:
$703
New York:
$3,125
(% of AGI for various income ranges: 0.4% for AGIs below $25k, 0.3% for AGIs $25k-50k, 0.2% for AGIs $50k-75k, 0.4% for AGIs $75k-100k, 0.6% for AGIs $100k-200k, 1.3% for AGIs over 200k)
Ordinary dividends: $3,489 (reported on 15.3% of returns)
Here:
$3,489
State:
$10,299
(% of AGI for various income ranges: 0.9% for AGIs below $25k, 0.7% for AGIs $25k-50k, 1.4% for AGIs $50k-75k, 1.5% for AGIs $75k-100k, 1.7% for AGIs $100k-200k, 2.1% for AGIs over 200k)
Net capital gain/loss in AGI: +$3,630 (reported on 11.6% of returns)
Here:
+$3,630
State:
+$42,474
(% of AGI for various income ranges: 0.2% for AGIs $25k-50k, 0.3% for AGIs $50k-75k, 0.2% for AGIs $75k-100k, 1.5% for AGIs $100k-200k, 5.3% for AGIs over 200k)
Profit/loss from business: +$9,534 (reported on 14.5% of returns)
Here:
+$9,534
State:
+$16,168
(% of AGI for various income ranges: 6.6% for AGIs below $25k, 2.6% for AGIs $25k-50k, 1.4% for AGIs $50k-75k, 2.4% for AGIs $75k-100k, 2.4% for AGIs $100k-200k, 7.6% for AGIs over 200k)
Taxable individual retirement arrangement distribution: $13,526 (reported on 5.7% of returns)
13210:
$13,526
New York:
$17,621
(% of AGI for various income ranges: 0.9% for AGIs below $25k, 1.2% for AGIs $25k-50k, 1.8% for AGIs $50k-75k, 2.7% for AGIs $75k-100k, 2.9% for AGIs $100k-200k, 2.2% for AGIs over 200k)
Self-employment retirement plans: $18,550 (reported on 0.7% of returns)
13210:
$18,550
New York:
$27,330
Total itemized deductions: $18,279 (20% of AGI, reported on 22.0% of returns)
Here:
$18,279
State:
$34,985
Here:
20.0% of AGI
State:
21.3% of AGI
(% of AGI for various income ranges: 3.7% for AGIs below $25k, 5.5% for AGIs $25k-50k, 11.1% for AGIs $50k-75k, 14.6% for AGIs $75k-100k, 13.8% for AGIs $100k-200k, 13.7% for AGIs over 200k)
Charity contributions: $3,456 (reported on 17.8% of returns)
Here:
$3,456
State:
$5,572
(% of AGI for various income ranges: 0.3% for AGIs below $25k, 0.7% for AGIs $25k-50k, 1.3% for AGIs $50k-75k, 2.2% for AGIs $75k-100k, 2.4% for AGIs $100k-200k, 2.6% for AGIs over 200k)
Taxes paid: $8,635 (reported on 21.8% of returns)
13210:
$8,635
State:
$18,656
(% of AGI for various income ranges: 1.0% for AGIs below $25k, 2.0% for AGIs $25k-50k, 4.8% for AGIs $50k-75k, 6.3% for AGIs $75k-100k, 7.5% for AGIs $100k-200k, 7.7% for AGIs over 200k)
Earned income credit: $2,173 (reported on 25.7% of returns)
Here:
$2,173
State:
$2,230
(% of AGI for various income ranges: 7.5% for AGIs below $25k, 1.1% for AGIs $25k-50k)
Percentage of individuals using paid preparers for their 2012 taxes: 42.7%
Here:
43%
State:
66%
(% for various income ranges: 36.2% for AGIs below $25k, 41.4% for AGIs $25k-50k, 52.9% for AGIs $50k-75k, 52.8% for AGIs $75k-100k, 64.3% for AGIs $100k-200k, 75.0% for AGIs over 200k)
Averages for the 2004 tax year for zip code 13210, filed in 2005:
Average Adjusted Gross Income (AGI) in 2004: $30,647 (Individual Income Tax Returns)
Here:
$30,647
State:
$59,519
Salary/wage: $28,267 (reported on 88.8% of returns)
Here:
$28,267
State:
$50,673
(% of AGI for various income ranges: 93.7% for AGIs below $10k, 86.3% for AGIs $10k-25k, 87.8% for AGIs $25k-50k, 83.9% for AGIs $50k-75k, 78.3% for AGIs $75k-100k, 70.1% for AGIs over 100k)
Taxable interest for individuals: $847 (reported on 37.1% of returns)
This zip code:
$847
New York:
$2,377
(% of AGI for various income ranges: 1.5% for AGIs below $10k, 1.1% for AGIs $10k-25k, 0.8% for AGIs $25k-50k, 0.7% for AGIs $50k-75k, 1.4% for AGIs $75k-100k, 1.3% for AGIs over 100k)
Taxable dividends: $2,335 (reported on 18.8% of returns)
Here:
$2,335
State:
$5,394
(% of AGI for various income ranges: 1.9% for AGIs below $10k, 1.1% for AGIs $10k-25k, 0.8% for AGIs $25k-50k, 1.4% for AGIs $50k-75k, 1.6% for AGIs $75k-100k, 2.2% for AGIs over 100k)
Net capital gain/loss: +$2,833 (reported on 13.8% of returns)
Here:
+$2,833
State:
+$23,581
(% of AGI for various income ranges: -0.8% for AGIs below $10k, 0.4% for AGIs $10k-25k, 0.2% for AGIs $25k-50k, 0.8% for AGIs $50k-75k, 1.0% for AGIs $75k-100k, 4.1% for AGIs over 100k)
Profit/loss from business: +$8,467 (reported on 12.2% of returns)
Here:
+$8,467
State:
+$13,809
(% of AGI for various income ranges: 4.8% for AGIs below $10k, 3.2% for AGIs $10k-25k, 1.8% for AGIs $25k-50k, 2.0% for AGIs $50k-75k, 2.6% for AGIs $75k-100k, 6.7% for AGIs over 100k)
IRA payment deduction: $2,364 (reported on 1.8% of returns)
13210:
$2,364
New York:
$3,115
(% of AGI for various income ranges: 0.2% for AGIs $10k-25k, 0.2% for AGIs $25k-50k, 0.2% for AGIs $50k-75k, 0.1% for AGIs over 100k)
Self-employed pension: $12,952 (reported on 0.6% of returns)
Here:
$12,952
New York:
$19,016
Total itemized deductions: $11,994 (22% of AGI, reported on 29.6% of returns)
Here:
$11,994
State:
$25,864
Here:
21.9% of AGI
State:
21.9% of AGI
(% of AGI for various income ranges: 16.4% for AGIs below $10k, 6.1% for AGIs $10k-25k, 9.1% for AGIs $25k-50k, 13.1% for AGIs $50k-75k, 14.3% for AGIs $75k-100k, 14.8% for AGIs over 100k)
Charity contributions deductions: $2,952 (4% of AGI, reported on 19.7% of returns)
Here:
$2,952
State:
$4,439
Here:
4.0% of AGI
State:
3.6% of AGI
(% of AGI for various income ranges: 0.3% for AGIs below $10k, 0.6% for AGIs $10k-25k, 1.6% for AGIs $25k-50k, 2.1% for AGIs $50k-75k, 2.4% for AGIs $75k-100k, 3.1% for AGIs over 100k)
Total tax: $4,698 (reported on 63.9% of returns)
13210:
$4,698
State:
$11,730
(% of AGI for various income ranges: 1.7% for AGIs below $10k, 3.9% for AGIs $10k-25k, 7.4% for AGIs $25k-50k, 10.1% for AGIs $50k-75k, 11.8% for AGIs $75k-100k, 17.1% for AGIs over 100k)
Earned income credit: $1,784 (reported on 21.8% of returns)
Here:
$1,784
State:
$1,757
Percentage of individuals using paid preparers for their 2004 taxes: 48.7%
Here:
49%
State:
67%
(% for various income ranges: 36.2% for AGIs below $10k, 51.6% for AGIs $10k-25k, 53.1% for AGIs $25k-50k, 55.0% for AGIs $50k-75k, 58.9% for AGIs $75k-100k, 65.3% for AGIs over 100k)
Likely homosexual households (counted as self-reported same-sex unmarried-partner households)
Lesbian couples: 0.2% of all households
Gay men: 0.1% of all households
Household received Food Stamps/SNAP in the past 12 months: 2,148 Household did not receive Food Stamps/SNAP in the past 12 months: 5,848
Women who had a birth in the past 12 months: 169 (128 now married, 40 unmarried) Women who did not have a birth in the past 12 months: 6,549 (1,101 now married, 5,510 unmarried)
Housing units in zip code 13210 with a mortgage: 1,357 (250 second mortgage, 5 home equity loan, 228 both second mortgage and home equity loan) Houses without a mortgage: 40
Median monthly owner costs for units with a mortgage: $1,356 Median monthly owner costs for units without a mortgage: $632
Residents with income below the poverty level in 2022:
This zip code:
35.4%
Whole state:
14.3%
Residents with income below 50% of the poverty level in 2022:
This zip code:
11.1%
Whole state:
6.8%
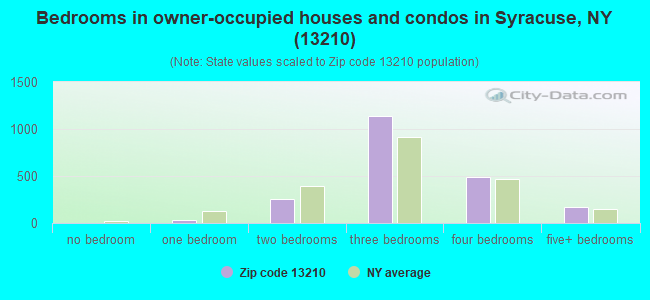
Median number of rooms in houses and condos:
Here:
6.9
State:
6.3
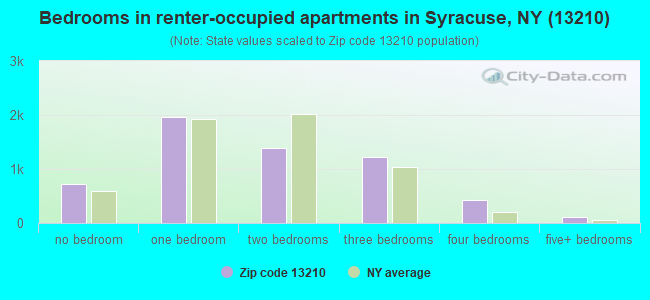
Median number of rooms in apartments:
Here:
3.9
State:
3.8
Notable locations in this zip code not listed on our city pages
Notable locations in zip code 13210: Carrier Dome (A), J. Stanley Coyne Stadium (B), Drumlins Country Club West Golf Course (C), Marion Residence Hall (D), Kimmel Residence Hall and Dining Center (E), Booth Residence Hall (F), DellPlain Residence Hall (G), Watson Residence Hall (H), Goldstein Alumni and Faculty Center (I), E. S. Bird Library (J), Schine Student Center (K), Newhouse Hall (L), Marley Education Center (M), Holden Observatory (N), Maxwell Hall (O), Eggers Hall (P), Tolley Administrative Building (Q), H. B. Crouse Building (R), Hall of Languages (S), Smith Hall (T). Display/hide their locations on the map
Churches in zip code 13210 include: Winnick Hillel Center (A), Hendricks Chapel (B), Bethesda Temple Pentecostal Church (C), Erwin First United Methodist Church (D), The Church of Jesus Christ of Latter Day Saints (E), Trinity Fellowship Church (F), United Baptist Church (G), Grace Episcopal Church (H), Korean Church of Syracuse (I). Display/hide their locations on the map
891 married couples with children.
956 single-parent households (331 men, 625 women).
76.9% of residents of 13210 zip code speak English at home.
3.8% of residents speak Spanish at home (78% very well, 20% well, 2% not well).
5.5% of residents speak other Indo-European language at home (70% very well, 24% well, 5% not well).
7.2% of residents speak Asian or Pacific Island language at home (57% very well, 43% well).
6.0% of residents speak other language at home (40% very well, 51% well, 4% not well, 5% not at all).
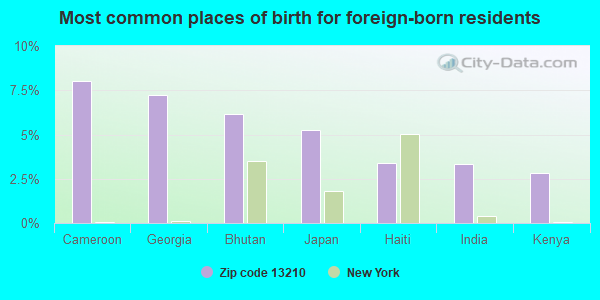
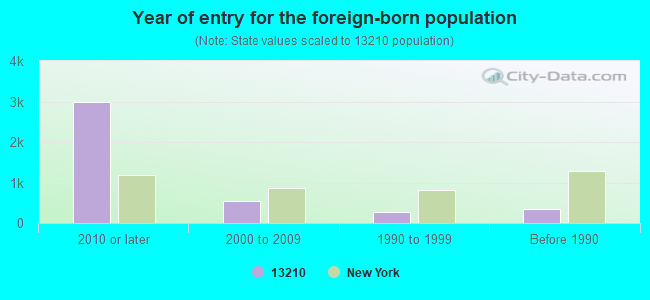
Foreign born population: 3,397 (18.0%) (41.1% of them are naturalized citizens)
Major facilities with environmental interests located in this zip code:
CITY OF SYRACUSE DPW (1200 CANAL ST EXT in SYRACUSE, NY)
AIR SYNTHETIC MINOR (AIRS/AFS) (Integrated Compliance Information System) - ICIS-02-2001-7918, FORMAL ENFORCEMENT ACTION HAZARDOUS WASTE BIENNIAL REPORTER (Resource Conservation and Recovery Act (tracking hazardous waste)) Large Quantity Generators, more that 1000 kg of hazardous waste/month (Resource Conservation and Recovery Act (tracking hazardous waste)) Business SIC classification: WATER, SEWER, PIPELINE, AND COMMUNICATIONS AND POWER LINE CONSTRUCTION; ASPHALT PAVING MIXTURES AND BLOCKS Alternative names: CITY OF SYRACUSE DEPT OF PUBLIC WORKS, SYRACUSE CITY OF DEPT PUBLIC WORKS
HESS CORP SYRACUSE TERMINAL (420 W HIAWATHA BLVD in SYRACUSE, NY)
STATE MASTER (New York facility tracking) - AIR PROGRAM, National Pollutant Discharge Elimination System Permit Conditionally Exempt Small Quantity Generators, less than 100 kg/month of hazardous waste (Resource Conservation and Recovery Act (tracking hazardous waste)) - notification Business SIC classification: PRODUCTS OF PETROLEUM AND COAL; PETROLEUM BULK STATIONS AND TERMINALS Organizations: HESS CORPORATION, AMERADA HESS CORP (CONTACT/OWNER)
Alternative names: AMERADA HESS CORP SYRACUSE TERMINAL, AMERADA HESS STATION 32214
CROUSE IRVING MEMORIAL HOSPITAL (736 IRVING AVENUE in SYRACUSE, NY)
STATE MASTER (New York facility tracking) - REFUSE DISPOSAL, AIR PROGRAM, HAZARDOUS WASTE BIENNIAL REPORTER (Resource Conservation and Recovery Act (tracking hazardous waste)) Small Quantity Generators, between 100 kg and 1000 kg of hazardous waste/month (Resource Conservation and Recovery Act (tracking hazardous waste)) Business SIC and NAICS classification: GENERAL MEDICAL AND SURGICAL HOSPITALS Alternative names: CROUSE IRVING MEM HOSP
HUGHES ACAD MAGNET SCHOOL ( in SYRACUSE, NY)
(National Center for Education Statistics) - STATE ID-421800010025 Organizations: SYRACUSE CITY SD (SCHOOL DISTRICT)
HUTCHINGS CHILD & YOUTH SVCS ( in SYRACUSE, NY)
(National Center for Education Statistics) - STATE ID-421800928188 Organizations: SYRACUSE CITY SD (SCHOOL DISTRICT)
ADT 75 (101 PINE STREET in SYRACUSE, NY)
(Integrated Compliance Information System) - ICIS-HQ-2002-6000, FORMAL ENFORCEMENT ACTION
H.W. SMITH ELEMENTARY SCHOOL (1130 SALT SPRINGS ROAD in SYRACUSE, NY)
ENFORCEMENT/COMPLIANCE ACTIVITY (Integrated Compliance Information System) (Resource Conservation and Recovery Act (tracking hazardous waste)) Alternative names: SYRACUSE CITY OF SCHOOL DIST
2118 PHYSICAL THERAPY & SPORTS FITNESS (2118 E GENESEE ST in SYRACUSE, NY)
(Resource Conservation and Recovery Act (tracking hazardous waste))
AINSLEY SUBSTATION (201 AINSLEY DR in SYRACUSE, NY)
(Resource Conservation and Recovery Act (tracking hazardous waste))
GREYHOUND BUS LINES (815 ERIE BLVD E in SYRACUSE, NY)
(Resource Conservation and Recovery Act (tracking hazardous waste))
HENDERSON JOHNSON CO INC (918 CANAL ST in SYRACUSE, NY)
(Resource Conservation and Recovery Act (tracking hazardous waste))
HUTCHINGS PSYCHIATRIC CENTER (500 CEDAR ST in SYRACUSE, NY)
Small Quantity Generators, between 100 kg and 1000 kg of hazardous waste/month (Resource Conservation and Recovery Act (tracking hazardous waste)) Organizations: NEW YORK STATE OFFICE OF MENTAL HEALTH (CONTACT/OWNER)
IMPROVE IT INC (500 WESTCOTT ST in SYRACUSE, NY)
(Resource Conservation and Recovery Act (tracking hazardous waste))
Housing units lacking complete plumbing facilities: 1.1% Housing units lacking complete kitchen facilities: 2.2%
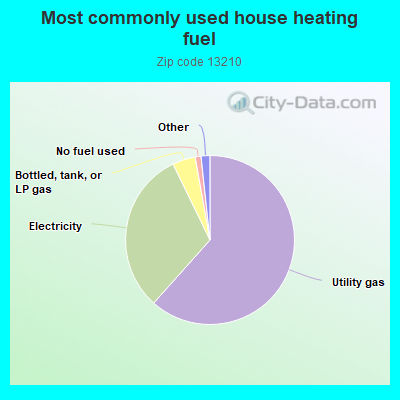
61.6%Utility gas
31.2%Electricity
4.4%Bottled, tank, or LP gas
1.1%No fuel used
0.8%Fuel oil, kerosene, etc.
0.7%Other fuel
Population in 1990: 31,197.
Place of birth for U.S.-born residents:
This state: 9,046
Northeast: 2,267
Midwest: 1,050
South: 1,696
West: 1,038
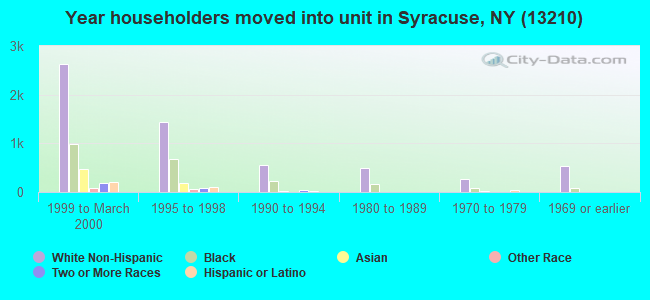
27% of the 13210 zip code residents lived in the same house 5 years ago. Out of people who lived in different houses, 31% lived in this county. Out of people who lived in different counties, 50% lived in New York.
75% of the 13210 zip code residents lived in the same house 1 year ago. Out of people who lived in different houses, 52% moved from this county. Out of people who lived in different houses, 13% moved from different county within same state. Out of people who lived in different houses, 19% moved from different state. Out of people who lived in different houses, 17% moved from abroad.
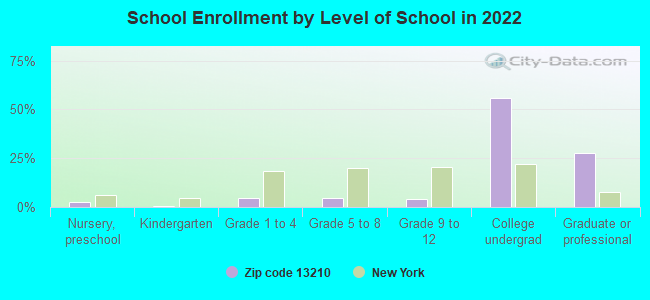
Private vs. public school enrollment:
Students in private schools in grades 1 to 8 (elementary and middle school): 68
Here:
8.5%
New York:
15.6%
Students in private schools in grades 9 to 12 (high school): 76
Here:
19.5%
New York:
15.0%
Students in private undergraduate colleges: 2,850
Here:
55.5%
New York:
39.2%
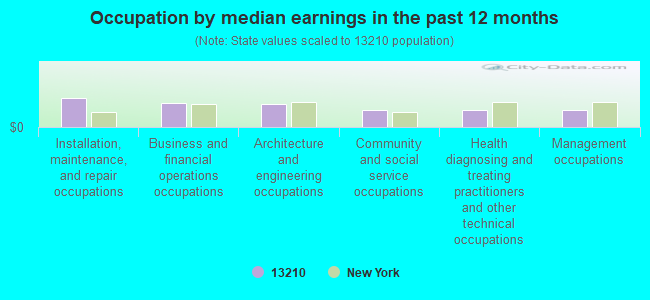
Occupation by median earnings in the past 12 months ($)
87,694Installation, maintenance, and repair occupations
73,215Business and financial operations occupations
69,559Architecture and engineering occupations
51,508Community and social service occupations
51,493Health diagnosing and treating practitioners and other technical occupations
50,764Management occupations
Companies with biggest federal contracts located in this zip code (SYRACUSE, NY):
SUNY UPSTATE MEDICAL UNIVERSIT (155 ELIZABETH BLACKWELL ST) : $3,251,408 in 36 contractsfrom 2000 to 2006
Contracts for Technical Assistance, Radiology Services, Tuition, Registration, and Membership Fees, Educational Services by U.S. Agency for International Development, Department of Veterans Affairs, Navy, Army, and others Signed by year:2000: $29,452; 2001: $98,516; 2002: $241,335; 2003: $2,156,993; 2004: $258,966; 2005: $300,543; 2006: $165,603.
Biggest contracts:
$1,781,459 with U.S. Agency for International Development for Technical Assistance. Taking place in DC. Signed on 2003-11-26. Completion date: 2004-11-01.
$150,000 with Department of Veterans Affairs for Radiology Services. Signed on 2003-08-25. Completion date: 2004-01-31.
$121,275 with Navy for Tuition, Registration, and Membership Fees. Signed on 2005-11-17. Completion date: 2006-06-30.
$121,275, same as above.Signed on 2005-05-26. Completion date: 2005-12-31.
FIEDLER, DAN (108 BALL CIR; small business) : $916,868 in 42 contractsfrom 2003 to 2006
Contracts for Laundry and DryCleaning Services by Army Signed by year:2000: $0; 2001: $0; 2002: $0; 2003: $229,207; 2004: $352,752; 2005: $197,515; 2006: $137,394.
Biggest contracts:
$120,000 with Army for Laundry and DryCleaning Services. Signed on 2005-06-01. Completion date: 2005-09-30.
$90,917, same as above.Signed on 2003-02-28. Completion date: 2003-06-30.
$90,000, same as above.Signed on 2006-01-17. Completion date: 2006-03-31.
$90,000, same as above.Signed on 2004-12-29. Completion date: 2005-03-31.
STATE UNIVERSITY OF NEW YORK (155 ELIZABETH BLACKWELL S) : $380,581 in 3 contractsfrom 2002 to 2003
$178,581 with U.S. Army Corps of Engineers - civil program financing only for Environmental Studies and Assessments. Signed on 2003-05-08. Completion date: 2002-06-06.
$156,000, same as above.Signed on 2002-09-03. Completion date: 2002-06-06.
$46,000, same as above.Signed on 2003-05-08. Completion date: 2002-06-06.
HENDERSON-JOHNSON CO INC (918 CANAL ST) : $244,760 in 3 contractsfrom 2001 to 2005
$169,970 with U.S. Army Corps of Engineers - civil program financing only for Maintenance, Repair or Alteration of Real Property -- Other Non-Building Facilities. Signed on 2001-08-22. Completion date: 2001-11-20.
$64,925 with Army for Construction of Structures and Facilities -- Other Administrative Facilities and Service Buildings. Signed on 2005-05-23. Completion date: 2005-08-31.
$9,865 with U.S. Army Corps of Engineers - civil program financing only for Maintenance, Repair or Alteration of Real Property -- Other Non-Building Facilities. Signed on 2002-01-25. Completion date: 2001-11-20.
POLYENE LLC (943 COMSTOCK AVE; small business) : $122,000 in 5 contractsfrom 2003 to 2006
Contracts for Other Professional Services, Dyes, Chemicals by Air Force Signed by year:2000: $0; 2001: $0; 2002: $0; 2003: $50,000; 2004: $0; 2005: $18,000; 2006: $54,000.
Biggest contracts:
$50,000 with Air Force for Other Professional Services. Signed on 2003-05-28. Completion date: 2003-09-30.
$42,000 with Air Force for Dyes. Signed on 2006-06-05. Completion date: 2006-08-25.
$12,000, same as above.Signed on 2006-02-16. Completion date: 2006-03-17.
$12,000, same as above.Signed on 2005-12-01. Completion date: 2005-12-15.
DYNAMIC HYBRIDS INC (1201 E FAYETTE ST; small business) 250 employees, $0 revenue. : $72,427 in 2 contractsin 2004
$43,466 with Navy for Resistors. Signed on 2004-04-20. Completion date: 2004-05-24.
$28,961, same as above.Signed on 2004-05-05. Completion date: 2004-06-14.
CARRIER SALES & DISTRIBUTION, (1401 ERIE BOULEVARD EAST; small business) 250 employees, $0 revenue: $69,903 in 4 contractsfrom 2002 to 2005
$46,286 with Army for Refrigeration and Air Conditioning Components. Taking place in TN. Signed on 2002-04-15. Completion date: 2002-04-17.
$11,229 with Navy for Non-nuclear Ship Repair (East) Ship repair (including overhauls and conversions) performed on non-nuclear propelled and nonpropelled ships east of the 108th meridian. Taking place in VA. Signed on 2005-09-30. Completion date: 2005-09-30.
$6,337 with National Institute of Standards and Technology for Air Conditioning Equipment. Taking place in MD. Signed on 2004-06-06. Completion date: 2004-06-18.
$6,051 with Army for Air Conditioning Equipment. Taking place in VA. Signed on 2004-05-11. Completion date: 2004-05-12.
NIAGARA ERECTING, INC. (201 PEAT STREET; small business) : $65,651 in 2 contractsin 2000
$65,651 with Army for Maintenance, Repair or Alteration of Real Property -- Office Buildings. Signed on 2000-07-06. Completion date: 2000-07-30.
$0, same as above.Signed on 2000-07-06. Completion date: 2000-07-30.
JAQUITH INDUSTRIES INC (600 E BRIGHTON AVE; small business) : $27,276 in 5 contractsfrom 2004 to 2006
Contracts for Miscellaneous Items, Indoor and Outdoor Electric Lighting Fixtures, Antennas, Waveguides, and Related Equipment, Prefabricated Tower Structures by Army, Navy Signed by year:2000: $0; 2001: $0; 2002: $0; 2003: $0; 2004: $3,207; 2005: $20,134; 2006: $3,935.
Biggest contracts:
$17,177 with Army for Miscellaneous Items. Taking place in AK. Signed on 2005-08-22. Completion date: 2005-09-22.
$3,935 with Army for Indoor and Outdoor Electric Lighting Fixtures. Signed on 2006-02-23. Completion date: 2006-02-23.
$3,207 with Army for Antennas, Waveguides, and Related Equipment. Taking place in SC. Signed on 2004-09-27. Completion date: 2004-11-09.
$3,199 with Navy for Prefabricated Tower Structures. Signed on 2005-01-19. Completion date: 2005-02-15.
THE RESEARCH FOUNDATION OF STA (155 ELZTH BLCWL RM 300) : $25,772 in 5 contractsfrom 2003 to 2005
Contracts for Other Professional Services, Other Medical Services, Other Education and Training Services by Office of Assistant Secretary for Health except national centers (disused code), Army Signed by year:2000: $0; 2001: $0; 2002: $0; 2003: $4,900; 2004: $20,000; 2005: $872; 2006: $0.
Biggest contracts:
$20,000 with Office of Assistant Secretary for Health except national centers (disused code) for Other Professional Services. Signed on 2004-06-10. Completion date: 2005-06-29.
$4,900 with Army for Other Medical Services. Signed on 2003-09-16. Completion date: 2003-04-10.
$4,750 with Army for Other Education and Training Services. Signed on 2005-04-01. Completion date: 2005-06-17.
$3,900, same as above.Signed on 2005-12-30. Completion date: 2006-09-30.
Top industries in this zip code by the number of employees in 2005:
Health Care and Social Assistance: General Medical and Surgical Hospitals (over 1000 employees: 3 establishments)
Professional, Scientific, and Technical Services: Research and Development in the Physical, Engineering, and Life Sciences (over 1000: 1, 100-249: 1, 20-49: 1)
Health Care and Social Assistance: Offices of Physicians (except Mental Health Specialists) (100-249: 2, 50-99: 5, 20-49: 15, 10-19: 17, 5-9: 20, 1-4: 42)
Accommodation and Food Services: Hotels (except Casino Hotels) and Motels (100-249: 3, 1-4: 1)
2007 - 2018 National Fire Incident Reporting System (NFIRS) incidents
Based on the data from the years 2007 - 2018 the average number of fires per year is 132. The highest number of fire incidents - 177 took place in 2017, and the least - 0 in 2011. The data has a rising trend.
When looking into fire subcategories, the most incidents belonged to: Structure Fires (66.5%), and Outside Fires (25.1%).
Fire incident types reported to NFIRS in Zip Code 13210


 Nearest zip codes: 13224, 13202, 13205, 13203, 13207, 13206.
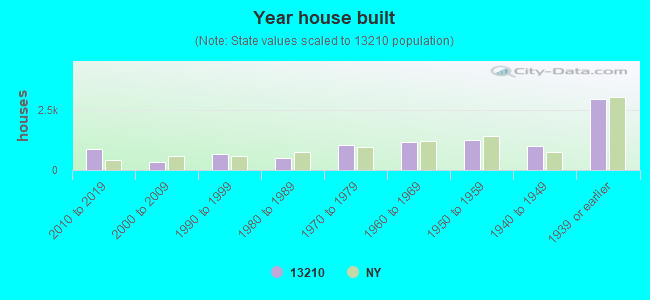


 Based on the data from the years 2007 - 2018 the average number of fires per year is 132. The highest number of fire incidents - 177 took place in 2017, and the least - 0 in 2011. The data has a rising trend.
 When looking into fire subcategories, the most incidents belonged to: Structure Fires (66.5%), and Outside Fires (25.1%).