Estimated zip code population in 2022: 2,613 Zip code population in 2010: 3,310 Zip code population in 2000: 3,437
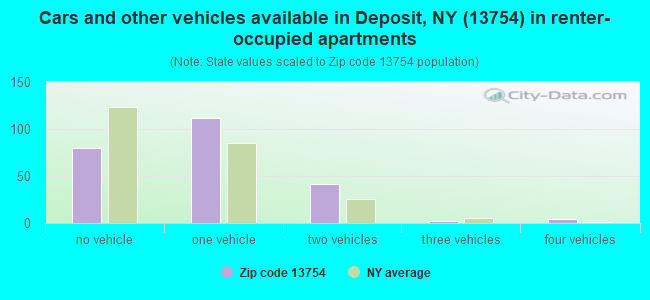
Houses and condos: 2,076 Renter-occupied apartments: 239
% of renters here:
20%
State:
46%
March 2022 cost of living index in zip code 13754: 94.0 (less than average, U.S. average is 100)
Land area: 79.6 sq. mi. Water area: 1.5 sq. mi.
Population density: 33 people per square mile
(very low).
OSM Map
General Map
Google Map
MSN Map
OSM Map
General Map
Google Map
MSN Map
OSM Map
General Map
Google Map
MSN Map
OSM Map
General Map
Google Map
MSN Map
Please wait while loading the map...
Real estate property taxes paid for housing units in 2022:
This zip code:
2.2% ($2,840)
New York:
1.5% ($6,180)
Median real estate property taxes paid for housing units with mortgages in 2022: $3,021 (2.1%) Median real estate property taxes paid for housing units with no mortgage in 2022: $2,638 (2.2%)
Business Search- 14 Million verified businesses
Males: 1,264
(48.4%)
Females: 1,348
(51.6%)
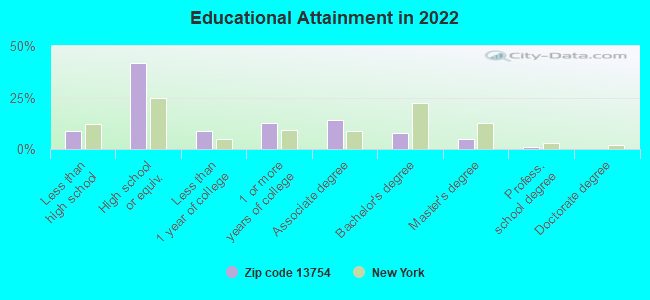
For population 25 years and over in 13754:
High school or higher: 89.8%
Bachelor's degree or higher: 13.8%
Graduate or professional degree: 6.0%
Unemployed: 1.9%
Mean travel time to work (commute): 24.2 minutes
For population 15 years and over in 13754:
Never married: 27.1%
Now married: 51.3%
Separated: 2.7%
Widowed: 9.3%
Divorced: 9.5%
Zip code 13754 compared to state average:
Median household income below state average.
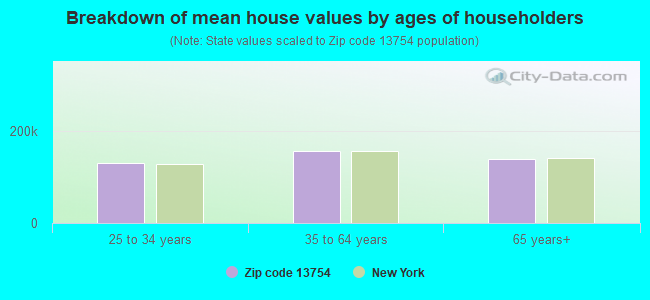
Median house value significantly below state average.
Unemployed percentage below state average.
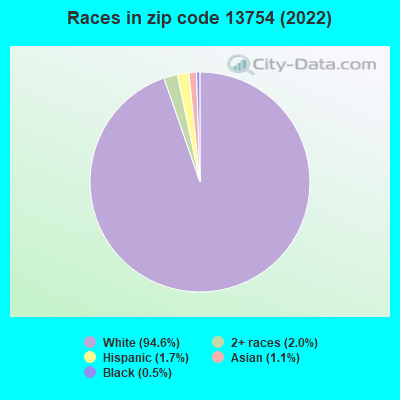
Black race population percentage significantly below state average.
Hispanic race population percentage significantly below state average.
Median age significantly above state average.
Foreign-born population percentage significantly below state average.
Renting percentage significantly below state average.
Length of stay since moving in significantly above state average.
Number of rooms per house above state average.
Number of college students below state average.
Percentage of population with a bachelor's degree or higher significantly below state average.
Averages for the 2020 tax year for zip code 13754, filed in 2021:
Average Adjusted Gross Income (AGI) in 2020: $50,936 (Individual Income Tax Returns)
Here:
$50,936
State:
$90,930
Salary/wage: $42,337 (reported on 75.9% of returns)
Here:
$42,337
State:
$72,104
(% of AGI for various income ranges: 1045.3% for AGIs below $25k, 2952.9% for AGIs $25k-50k, 5727.1% for AGIs $50k-75k, 8387.5% for AGIs $75k-100k, 16594.0% for AGIs $100k-200k)
Taxable interest for individuals: $738 (reported on 28.5% of returns)
This zip code:
$738
New York:
$3,075
(% of AGI for various income ranges: 16.8% for AGIs below $25k, 14.5% for AGIs $25k-50k, 65.0% for AGIs $50k-75k, 40.0% for AGIs $75k-100k, 63.0% for AGIs $100k-200k)
Ordinary dividends: $3,039 (reported on 16.8% of returns)
Here:
$3,039
State:
$11,095
(% of AGI for various income ranges: 36.2% for AGIs below $25k, 10.3% for AGIs $25k-50k, 122.1% for AGIs $50k-75k, 135.0% for AGIs $75k-100k, 265.0% for AGIs $100k-200k)
Net capital gain/loss in AGI: +$5,676 (reported on 12.4% of returns)
Here:
+$5,676
State:
+$44,925
(% of AGI for various income ranges: 15.9% for AGIs below $25k, 21.9% for AGIs $25k-50k, 199.3% for AGIs $50k-75k, 564.0% for AGIs $100k-200k)
Profit/loss from business: +$7,413 (reported on 10.9% of returns)
Here:
+$7,413
State:
+$14,940
(% of AGI for various income ranges: 112.6% for AGIs below $25k, 227.1% for AGIs $25k-50k, 31.2% for AGIs $75k-100k)
Taxable individual retirement arrangement distribution: $12,008 (reported on 9.5% of returns)
13754:
$12,008
New York:
$19,609
(% of AGI for various income ranges: 44.7% for AGIs below $25k, 77.7% for AGIs $25k-50k, 334.3% for AGIs $50k-75k, 700.0% for AGIs $100k-200k)
Total itemized deductions: $20,933 (reported on 2.2% of returns)
Here:
$20,933
State:
$39,326
(% of AGI for various income ranges: 628.0% for AGIs $100k-200k)
Charity contributions: $4,050 (reported on 1.5% of returns)
Here:
$4,050
State:
$15,420
(% of AGI for various income ranges: 101.2% for AGIs $75k-100k)
Taxes paid: $8,200 (reported on 2.2% of returns)
13754:
$8,200
State:
$9,183
(% of AGI for various income ranges: 246.0% for AGIs $100k-200k)
Earned income credit: $2,354 (reported on 19.0% of returns)
Here:
$2,354
State:
$2,138
(% of AGI for various income ranges: 102.1% for AGIs below $25k, 85.5% for AGIs $25k-50k)
Percentage of individuals using paid preparers for their 2020 taxes: 93.4%
Here:
93%
State:
95%
(% for various income ranges: 92.0% for AGIs below $25k, 94.7% for AGIs $25k-50k, 95.0% for AGIs $50k-75k, 91.7% for AGIs $75k-100k, 94.1% for AGIs $100k-200k)
Averages for the 2012 tax year for zip code 13754, filed in 2013:
Average Adjusted Gross Income (AGI) in 2012: $40,513 (Individual Income Tax Returns)
Here:
$40,513
State:
$77,088
Salary/wage: $35,506 (reported on 78.4% of returns)
Here:
$35,506
State:
$60,593
(% of AGI for various income ranges: 64.2% for AGIs below $25k, 74.1% for AGIs $25k-50k, 71.4% for AGIs $50k-75k, 66.6% for AGIs $75k-100k, 66.1% for AGIs $100k-200k)
Taxable interest for individuals: $880 (reported on 36.6% of returns)
This zip code:
$880
New York:
$3,125
(% of AGI for various income ranges: 1.7% for AGIs below $25k, 0.7% for AGIs $25k-50k, 0.4% for AGIs $50k-75k, 0.5% for AGIs $75k-100k, 0.9% for AGIs $100k-200k)
Ordinary dividends: $2,338 (reported on 17.9% of returns)
Here:
$2,338
State:
$10,299
(% of AGI for various income ranges: 1.5% for AGIs below $25k, 1.0% for AGIs $25k-50k, 1.0% for AGIs $50k-75k, 0.7% for AGIs $75k-100k, 1.1% for AGIs $100k-200k)
Net capital gain/loss in AGI: +$3,793 (reported on 10.4% of returns)
Here:
+$3,793
State:
+$42,474
(% of AGI for various income ranges: 1.4% for AGIs $25k-50k, 0.9% for AGIs $50k-75k, 2.0% for AGIs $100k-200k)
Profit/loss from business: +$10,030 (reported on 14.9% of returns)
Here:
+$10,030
State:
+$16,168
(% of AGI for various income ranges: 6.9% for AGIs below $25k, 3.5% for AGIs $25k-50k, 3.6% for AGIs $50k-75k, 5.1% for AGIs $100k-200k)
Taxable individual retirement arrangement distribution: $8,893 (reported on 11.2% of returns)
13754:
$8,893
New York:
$17,621
(% of AGI for various income ranges: 3.6% for AGIs below $25k, 1.4% for AGIs $25k-50k, 3.4% for AGIs $50k-75k, 4.9% for AGIs $75k-100k)
Total itemized deductions: $16,556 (22% of AGI, reported on 18.7% of returns)
Here:
$16,556
State:
$34,985
Here:
21.7% of AGI
State:
21.3% of AGI
(% of AGI for various income ranges: 5.2% for AGIs below $25k, 5.7% for AGIs $25k-50k, 6.9% for AGIs $50k-75k, 8.4% for AGIs $75k-100k, 10.6% for AGIs $100k-200k)
Charity contributions: $2,513 (reported on 11.2% of returns)
Here:
$2,513
State:
$5,572
(% of AGI for various income ranges: 0.7% for AGIs $25k-50k, 0.5% for AGIs $50k-75k, 1.0% for AGIs $75k-100k, 0.9% for AGIs $100k-200k)
Taxes paid: $7,320 (reported on 18.7% of returns)
13754:
$7,320
State:
$18,656
(% of AGI for various income ranges: 1.5% for AGIs below $25k, 2.0% for AGIs $25k-50k, 2.9% for AGIs $50k-75k, 3.4% for AGIs $75k-100k, 5.9% for AGIs $100k-200k)
Earned income credit: $2,107 (reported on 22.4% of returns)
Here:
$2,107
State:
$2,230
(% of AGI for various income ranges: 6.5% for AGIs below $25k, 1.3% for AGIs $25k-50k)
Percentage of individuals using paid preparers for their 2012 taxes: 51.5%
Here:
51%
State:
66%
(% for various income ranges: 41.3% for AGIs below $25k, 58.1% for AGIs $25k-50k, 55.6% for AGIs $50k-75k, 66.7% for AGIs $75k-100k, 70.0% for AGIs $100k-200k)
Averages for the 2004 tax year for zip code 13754, filed in 2005:
Average Adjusted Gross Income (AGI) in 2004: $32,411 (Individual Income Tax Returns)
Here:
$32,411
State:
$59,519
Salary/wage: $29,026 (reported on 81.1% of returns)
Here:
$29,026
State:
$50,673
(% of AGI for various income ranges: 100.2% for AGIs below $10k, 67.9% for AGIs $10k-25k, 78.3% for AGIs $25k-50k, 76.8% for AGIs $50k-75k, 66.0% for AGIs $75k-100k, 61.3% for AGIs over 100k)
Taxable interest for individuals: $1,028 (reported on 46.7% of returns)
This zip code:
$1,028
New York:
$2,377
(% of AGI for various income ranges: 4.3% for AGIs below $10k, 2.5% for AGIs $10k-25k, 1.3% for AGIs $25k-50k, 1.5% for AGIs $50k-75k, 0.9% for AGIs $75k-100k, 0.8% for AGIs over 100k)
Taxable dividends: $1,398 (reported on 22.3% of returns)
Here:
$1,398
State:
$5,394
(% of AGI for various income ranges: 4.4% for AGIs below $10k, 0.8% for AGIs $10k-25k, 1.1% for AGIs $25k-50k, 0.7% for AGIs $50k-75k, 0.6% for AGIs $75k-100k, 0.8% for AGIs over 100k)
Net capital gain/loss: +$5,799 (reported on 14.6% of returns)
Here:
+$5,799
State:
+$23,581
(% of AGI for various income ranges: 2.9% for AGIs below $10k, 1.1% for AGIs $10k-25k, 0.4% for AGIs $25k-50k, 1.1% for AGIs $50k-75k, -0.2% for AGIs $75k-100k, 11.9% for AGIs over 100k)
Profit/loss from business: +$8,882 (reported on 15.6% of returns)
Here:
+$8,882
State:
+$13,809
(% of AGI for various income ranges: 4.1% for AGIs below $10k, 7.7% for AGIs $10k-25k, 4.1% for AGIs $25k-50k, 4.0% for AGIs $50k-75k, 7.3% for AGIs $75k-100k, -0.1% for AGIs over 100k)
IRA payment deduction: $2,614 (reported on 3.0% of returns)
13754:
$2,614
New York:
$3,115
Total itemized deductions: $15,582 (22% of AGI, reported on 15.8% of returns)
Here:
$15,582
State:
$25,864
Here:
22.0% of AGI
State:
21.9% of AGI
(% of AGI for various income ranges: 7.7% for AGIs below $10k, 3.6% for AGIs $10k-25k, 6.5% for AGIs $25k-50k, 5.7% for AGIs $50k-75k, 12.2% for AGIs $75k-100k, 12.5% for AGIs over 100k)
Charity contributions deductions: $2,775 (4% of AGI, reported on 12.7% of returns)
Here:
$2,775
State:
$4,439
Here:
3.7% of AGI
State:
3.6% of AGI
(% of AGI for various income ranges: 0.6% for AGIs $10k-25k, 0.5% for AGIs $25k-50k, 0.8% for AGIs $50k-75k, 3.1% for AGIs $75k-100k, 1.7% for AGIs over 100k)
Total tax: $4,144 (reported on 70.8% of returns)
13754:
$4,144
State:
$11,730
(% of AGI for various income ranges: 3.1% for AGIs below $10k, 4.3% for AGIs $10k-25k, 6.6% for AGIs $25k-50k, 8.9% for AGIs $50k-75k, 11.9% for AGIs $75k-100k, 16.7% for AGIs over 100k)
Earned income credit: $1,672 (reported on 21.2% of returns)
Here:
$1,672
State:
$1,757
Percentage of individuals using paid preparers for their 2004 taxes: 59.9%
Here:
60%
State:
67%
(% for various income ranges: 46.6% for AGIs below $10k, 62.9% for AGIs $10k-25k, 65.9% for AGIs $25k-50k, 61.5% for AGIs $50k-75k, 62.7% for AGIs $75k-100k, 74.0% for AGIs over 100k)
Household received Food Stamps/SNAP in the past 12 months: 290 Household did not receive Food Stamps/SNAP in the past 12 months: 897
Women who had a birth in the past 12 months: 13 (0 now married, 13 unmarried) Women who did not have a birth in the past 12 months: 495 (218 now married, 275 unmarried)
Housing units in zip code 13754 with a mortgage: 447 (47 second mortgage, 48 both second mortgage and home equity loan) Median monthly owner costs for units with a mortgage: $1,201 Median monthly owner costs for units without a mortgage: $592
Residents with income below the poverty level in 2022:
This zip code:
21.7%
Whole state:
14.3%
Residents with income below 50% of the poverty level in 2022:
This zip code:
6.0%
Whole state:
6.8%
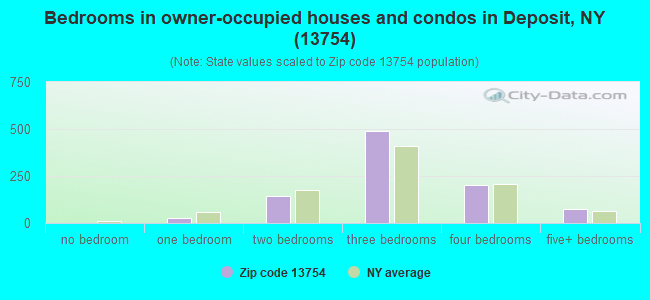
Median number of rooms in houses and condos:
Here:
6.5
State:
6.3
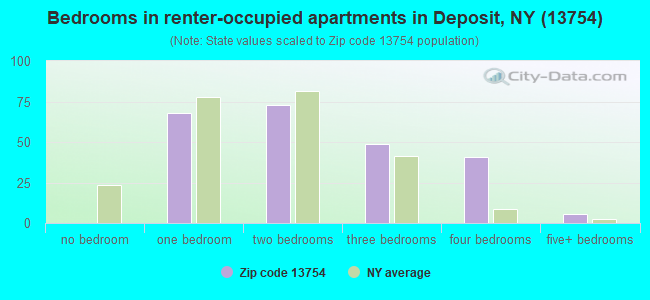
Median number of rooms in apartments:
Here:
4.7
State:
3.8
Notable locations in this zip code not listed on our city pages
Notable locations in zip code 13754: Initial Monument (A), Camp Amahami (B), Scotts Golf Course (C), State Theatre (D), Deposit Village Hall (E), Deposit Free Library (F), Deposit Fire and Rescue (G). Display/hide their locations on the map
Churches in zip code 13754 include: Maple Lane Assembly of God Church (A), Christ Episcopal Church (B), First Baptist Church (C), The Evangelistic Center (D), First Presbyterian Church (E), First United Methodist Church (F), Saint Joseph's Roman Catholic Church (G). Display/hide their locations on the map
Cemeteries: Saint Josephs Cemetery (1), Danville Cemetery (2), Sanford Cemetery (3), Loomis Hill Cemetery (4), China Road Cemetery (5), Barbourville Cemetery (6), Anthony Cemetery (7). Display/hide their locations on the map
Lakes, reservoirs, and swamps: Laurel Lake (A), Oquaga Lake (B), Page Pond (C), Palmers Pond (D), Beaver Pond (E), Blueberry Lake (F), Deposit Reservoir (G), Whitaker Swamp (H). Display/hide their locations on the map
Streams, rivers, and creeks: Butler Brook (A), Fly Creek (B), Whitaker Brook (C), Page Pond Brook (D), Bone Creek (E), Dry Brook (F), Tarbell Brook (G), Cold Spring Creek (H), Steam Mill Branch (I). Display/hide their locations on the map
Size of family households: 418 2-persons, 177 3-persons, 89 4-persons, 48 5-persons, 36 6-persons, 6 7-or-more-persons
Size of nonfamily households: 356 1-person, 44 2-persons
277 married couples with children.
140 single-parent households (48 men, 92 women).
97.1% of residents of 13754 zip code speak English at home.
1.2% of residents speak Spanish at home (100% very well).
0.3% of residents speak other Indo-European language at home (100% very well).
1.4% of residents speak Asian or Pacific Island language at home (80% very well, 20% not well).
0.4% of residents speak other language at home (100% very well).
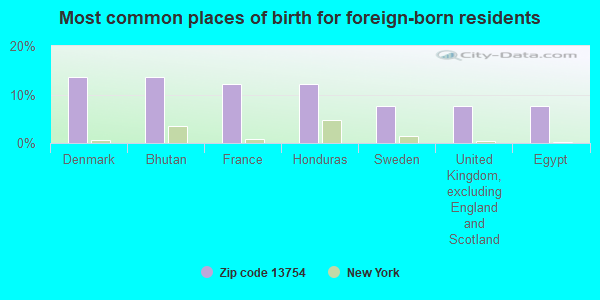
Foreign born population: 66 (2.6%) (72.7% of them are naturalized citizens)
This zip code:
2.6%
Whole state:
22.7%
14%Denmark
14%Bhutan
12%France
12%Honduras
8%Sweden
8%United Kingdom, excluding England and Scotland
8%Egypt
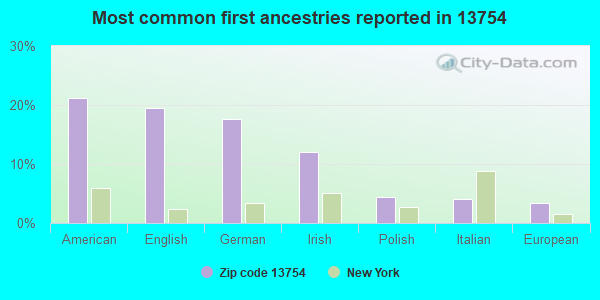
21%American
19%English
18%German
12%Irish
4%Polish
4%Italian
3%European
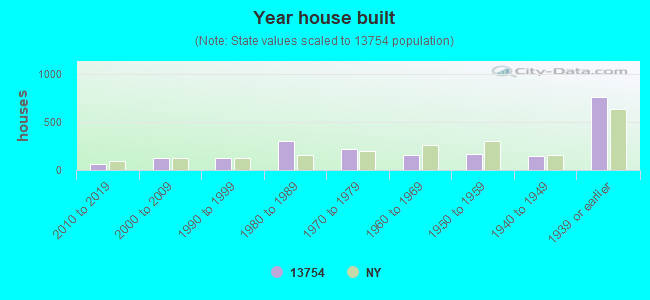
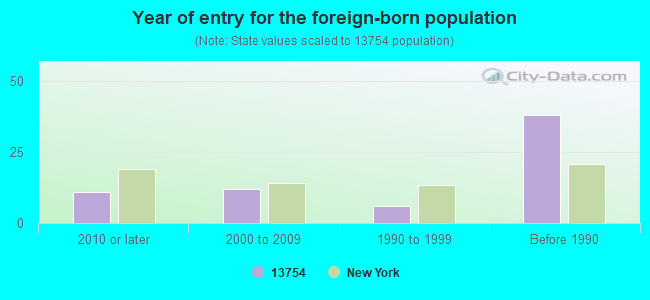
Year of entry for the foreign-born population
112010 or later
122000 to 2009
61990 to 1999
38Before 1990
Facilities with environmental interests located in this zip code:
ALTEC IND INC-EASTERN DIVISION PLANT 86 (ROUTE 17, EXIT 84 in DEPOSIT, NY)
AIR MINOR (AIRS/AFS) STATE MASTER (New York facility tracking) - AIR PROGRAM, HAZARDOUS WASTE PROGRAM Small Quantity Generators, between 100 kg and 1000 kg of hazardous waste/month (Resource Conservation and Recovery Act (tracking hazardous waste)) - notification Organizations: ALTEC INDUSTRIES (CONTACT/OWNER)
, ALTEC INDUSTRIES INCORPORATED (LEGALLY RESPONSIBLE PARTY)
Alternative names: ALTEC INDUSTRIES, ALTEC INDUSTRIES INCORPORATED PLANT 86
INDIAN COUNTRY PLANT (LAUREL BANK AVE in DEPOSIT, NY)
AIR MINOR (AIRS/AFS) STATE MASTER (New York facility tracking) - AIR PROGRAM, Business SIC classification: WOOD PRODUCTS Organizations: INDIAN COUNTRY INC (LEGALLY RESPONSIBLE PARTY)
Alternative names: INDIAN COUNTRY INC
Housing units lacking complete plumbing facilities: 6.8% Housing units lacking complete kitchen facilities: 2.6%
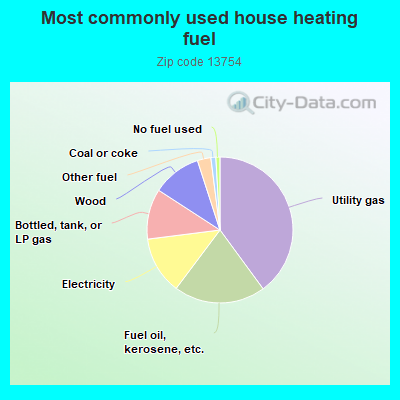
40.1%Utility gas
20.4%Fuel oil, kerosene, etc.
12.8%Electricity
11.2%Bottled, tank, or LP gas
10.9%Wood
3.0%Other fuel
1.1%Coal or coke
0.9%No fuel used
Population in 1990: 3,047. Population change in the 1990s: +390 (+12.8%).
Place of birth for U.S.-born residents:
This state: 2,116
Northeast: 211
Midwest: 50
South: 96
West: 63
62% of the 13754 zip code residents lived in the same house 5 years ago. Out of people who lived in different houses, 42% lived in this county. Out of people who lived in different counties, 50% lived in New York.
91% of the 13754 zip code residents lived in the same house 1 year ago. Out of people who lived in different houses, 21% moved from this county. Out of people who lived in different houses, 58% moved from different county within same state. Out of people who lived in different houses, 23% moved from different state.
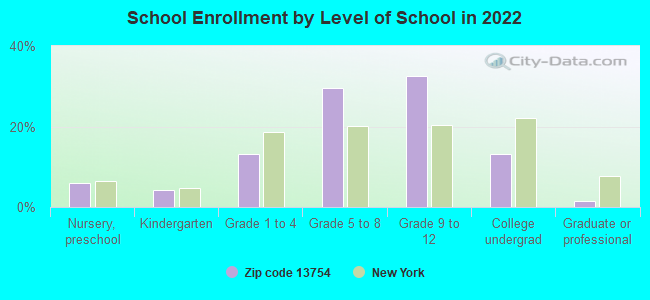
Private vs. public school enrollment:
Students in private schools in grades 1 to 8 (elementary and middle school): 33
Here:
14.6%
New York:
15.6%
Students in private schools in grades 9 to 12 (high school): 4
Here:
2.6%
New York:
15.0%
Students in private undergraduate colleges: 2
Here:
4.1%
New York:
39.2%
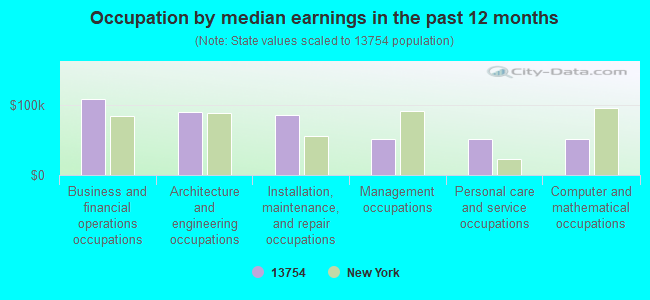
Occupation by median earnings in the past 12 months ($)
108,305Business and financial operations occupations
90,003Architecture and engineering occupations
85,201Installation, maintenance, and repair occupations
51,850Management occupations
51,703Personal care and service occupations
50,649Computer and mathematical occupations
Top industries in this zip code by the number of employees in 2005:
Wholesale Trade: Automobile and Other Motor Vehicle Merchant Wholesalers (50-99 employees: 1 establishment)
Finance and Insurance: Financial Transactions Processing, Reserve, and Clearinghouse Activities (20-49: 2)
Accommodation and Food Services: Limited-Service Restaurants (20-49: 1, 1-4: 1)
Fatal accident statistics in 2013:
Fatal accident count: 2
Vehicles involved in fatal accidents: 2
Fatal accidents caused by drunken drivers: 2
Fatalities: 2
Persons involved in fatal accidents: 2
Pedestrians involved in fatal accidents: 1
Fatal accident statistics in 2011:
Fatal accident count: 1
Vehicles involved in fatal accidents: 2
Fatal accidents caused by drunken drivers: 0
Fatalities: 1
Persons involved in fatal accidents: 2
Pedestrians involved in fatal accidents: 0
Home Mortgage Disclosure Act Aggregated Statistics For Year 2009 (Based on 2 partial tracts)
A) FHA, FSA/RHS & VA Home Purchase Loans
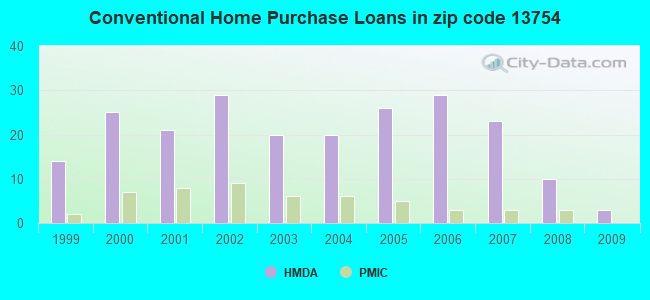
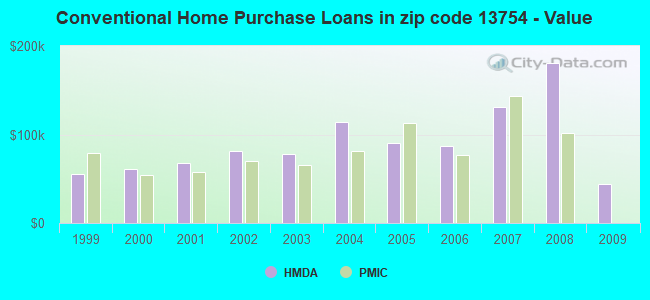
B) Conventional Home Purchase Loans
C) Refinancings
D) Home Improvement Loans
F) Non-occupant Loans on < 5 Family Dwellings (A B C & D)
G) Loans On Manufactured Home Dwelling (A B C & D)
Number
Average Value
Number
Average Value
Number
Average Value
Number
Average Value
Number
Average Value
Number
Average Value
LOANS ORIGINATED
6
$98,710
3
$43,950
21
$102,946
13
$36,946
7
$140,069
3
$62,437
APPLICATIONS APPROVED, NOT ACCEPTED
1
$72,200
0
$0
1
$134,990
0
$0
0
$0
0
$0
APPLICATIONS DENIED
3
$63,480
1
$26,160
22
$72,249
2
$26,160
0
$0
3
$53,367
APPLICATIONS WITHDRAWN
1
$239,630
0
$0
13
$86,207
1
$31,390
2
$79,525
0
$0
FILES CLOSED FOR INCOMPLETENESS
0
$0
0
$0
2
$109,870
0
$0
0
$0
0
$0
Aggregated Statistics For Year 2008 (Based on 2 partial tracts)
A) FHA, FSA/RHS & VA Home Purchase Loans
B) Conventional Home Purchase Loans
C) Refinancings
D) Home Improvement Loans
F) Non-occupant Loans on < 5 Family Dwellings (A B C & D)
G) Loans On Manufactured Home Dwelling (A B C & D)
Number
Average Value
Number
Average Value
Number
Average Value
Number
Average Value
Number
Average Value
Number
Average Value
LOANS ORIGINATED
5
$98,780
10
$180,818
17
$94,668
4
$89,730
3
$133,590
3
$40,460
APPLICATIONS APPROVED, NOT ACCEPTED
0
$0
2
$58,600
5
$80,782
1
$31,390
0
$0
4
$49,965
APPLICATIONS DENIED
2
$103,595
1
$88,940
30
$106,384
8
$58,599
0
$0
2
$85,280
APPLICATIONS WITHDRAWN
0
$0
1
$433,210
14
$110,171
2
$43,950
2
$238,055
0
$0
FILES CLOSED FOR INCOMPLETENESS
0
$0
0
$0
0
$0
2
$93,130
0
$0
0
$0
Aggregated Statistics For Year 2007 (Based on 2 partial tracts)
A) FHA, FSA/RHS & VA Home Purchase Loans
B) Conventional Home Purchase Loans
C) Refinancings
D) Home Improvement Loans
F) Non-occupant Loans on < 5 Family Dwellings (A B C & D)
G) Loans On Manufactured Home Dwelling (A B C & D)
Number
Average Value
Number
Average Value
Number
Average Value
Number
Average Value
Number
Average Value
Number
Average Value
LOANS ORIGINATED
1
$95,220
23
$131,483
43
$80,962
9
$64,644
12
$147,019
4
$58,075
APPLICATIONS APPROVED, NOT ACCEPTED
0
$0
6
$177,017
14
$84,983
1
$62,780
3
$305,550
3
$68,713
APPLICATIONS DENIED
0
$0
16
$86,459
41
$95,120
10
$27,102
7
$105,239
8
$50,881
APPLICATIONS WITHDRAWN
0
$0
1
$502,270
10
$112,383
1
$109,870
2
$287,760
1
$109,870
FILES CLOSED FOR INCOMPLETENESS
0
$0
1
$230,210
3
$70,457
0
$0
2
$152,250
0
$0
Aggregated Statistics For Year 2006 (Based on 2 partial tracts)
A) FHA, FSA/RHS & VA Home Purchase Loans
B) Conventional Home Purchase Loans
C) Refinancings
D) Home Improvement Loans
E) Loans on Dwellings For 5+ Families
F) Non-occupant Loans on < 5 Family Dwellings (A B C & D)
G) Loans On Manufactured Home Dwelling (A B C & D)
Number
Average Value
Number
Average Value
Number
Average Value
Number
Average Value
Number
Average Value
Number
Average Value
Number
Average Value
LOANS ORIGINATED
4
$87,375
29
$87,320
45
$71,713
18
$27,613
1
$129,750
9
$131,962
9
$70,807
APPLICATIONS APPROVED, NOT ACCEPTED
0
$0
4
$99,670
7
$129,903
3
$40,460
0
$0
3
$130,800
0
$0
APPLICATIONS DENIED
1
$125,570
12
$88,333
47
$78,324
27
$36,740
0
$0
6
$79,352
9
$49,413
APPLICATIONS WITHDRAWN
1
$85,800
3
$66,273
28
$93,092
0
$0
0
$0
2
$59,645
0
$0
FILES CLOSED FOR INCOMPLETENESS
0
$0
1
$47,090
5
$129,126
0
$0
0
$0
2
$77,955
1
$47,090
Aggregated Statistics For Year 2005 (Based on 2 partial tracts)
A) FHA, FSA/RHS & VA Home Purchase Loans
B) Conventional Home Purchase Loans
C) Refinancings
D) Home Improvement Loans
F) Non-occupant Loans on < 5 Family Dwellings (A B C & D)
G) Loans On Manufactured Home Dwelling (A B C & D)
Number
Average Value
Number
Average Value
Number
Average Value
Number
Average Value
Number
Average Value
Number
Average Value
LOANS ORIGINATED
4
$89,990
26
$90,433
46
$67,584
16
$58,533
18
$84,352
13
$42,419
APPLICATIONS APPROVED, NOT ACCEPTED
0
$0
13
$63,348
9
$55,576
6
$84,933
2
$127,660
6
$53,018
APPLICATIONS DENIED
2
$81,620
20
$93,025
40
$79,160
15
$42,414
9
$105,453
6
$75,515
APPLICATIONS WITHDRAWN
0
$0
4
$164,285
37
$95,505
7
$72,351
8
$124,652
1
$92,080
FILES CLOSED FOR INCOMPLETENESS
1
$92,080
1
$93,130
10
$83,921
0
$0
1
$104,640
0
$0
Aggregated Statistics For Year 2004 (Based on 2 partial tracts)
A) FHA, FSA/RHS & VA Home Purchase Loans
B) Conventional Home Purchase Loans
C) Refinancings
D) Home Improvement Loans
E) Loans on Dwellings For 5+ Families
F) Non-occupant Loans on < 5 Family Dwellings (A B C & D)
G) Loans On Manufactured Home Dwelling (A B C & D)
Number
Average Value
Number
Average Value
Number
Average Value
Number
Average Value
Number
Average Value
Number
Average Value
Number
Average Value
LOANS ORIGINATED
1
$65,920
20
$114,006
33
$72,392
16
$41,856
1
$127,660
16
$97,446
5
$63,202
APPLICATIONS APPROVED, NOT ACCEPTED
0
$0
3
$60,343
22
$71,821
2
$41,855
0
$0
2
$46,040
2
$85,280
APPLICATIONS DENIED
0
$0
4
$66,970
65
$91,488
7
$44,247
0
$0
3
$98,013
3
$44,647
APPLICATIONS WITHDRAWN
0
$0
3
$48,133
36
$72,056
3
$54,063
0
$0
3
$47,437
1
$52,320
FILES CLOSED FOR INCOMPLETENESS
0
$0
2
$75,865
12
$100,542
2
$62,785
0
$0
1
$238,580
0
$0
Aggregated Statistics For Year 2003 (Based on 2 partial tracts)
A) FHA, FSA/RHS & VA Home Purchase Loans
B) Conventional Home Purchase Loans
C) Refinancings
D) Home Improvement Loans
E) Loans on Dwellings For 5+ Families
F) Non-occupant Loans on < 5 Family Dwellings (A B C & D)
Number
Average Value
Number
Average Value
Number
Average Value
Number
Average Value
Number
Average Value
Number
Average Value
LOANS ORIGINATED
1
$59,640
20
$77,643
55
$82,723
10
$22,812
0
$0
16
$95,876
APPLICATIONS APPROVED, NOT ACCEPTED
0
$0
5
$124,104
8
$50,096
1
$1,050
1
$103,590
5
$126,406
APPLICATIONS DENIED
0
$0
9
$67,783
46
$69,040
7
$24,516
0
$0
7
$56,506
APPLICATIONS WITHDRAWN
1
$59,640
1
$72,200
26
$80,573
2
$14,125
0
$0
0
$0
FILES CLOSED FOR INCOMPLETENESS
1
$49,180
1
$36,620
5
$99,618
1
$26,160
0
$0
0
$0
Aggregated Statistics For Year 2002 (Based on 2 partial tracts)
A) FHA, FSA/RHS & VA Home Purchase Loans
B) Conventional Home Purchase Loans
C) Refinancings
D) Home Improvement Loans
F) Non-occupant Loans on < 5 Family Dwellings (A B C & D)
Number
Average Value
Number
Average Value
Number
Average Value
Number
Average Value
Number
Average Value
LOANS ORIGINATED
3
$50,577
29
$81,691
40
$76,126
16
$29,888
19
$87,402
APPLICATIONS APPROVED, NOT ACCEPTED
1
$71,160
7
$69,211
13
$89,749
0
$0
3
$107,430
APPLICATIONS DENIED
1
$62,780
13
$26,885
50
$58,975
8
$11,380
4
$75,865
APPLICATIONS WITHDRAWN
0
$0
3
$46,740
25
$72,244
4
$22,760
2
$128,185
FILES CLOSED FOR INCOMPLETENESS
0
$0
0
$0
5
$96,268
0
$0
0
$0
Aggregated Statistics For Year 2001 (Based on 2 partial tracts)
A) FHA, FSA/RHS & VA Home Purchase Loans
B) Conventional Home Purchase Loans
C) Refinancings
D) Home Improvement Loans
F) Non-occupant Loans on < 5 Family Dwellings (A B C & D)
Number
Average Value
Number
Average Value
Number
Average Value
Number
Average Value
Number
Average Value
LOANS ORIGINATED
3
$52,670
21
$67,867
36
$59,936
9
$18,487
5
$62,784
APPLICATIONS APPROVED, NOT ACCEPTED
0
$0
6
$57,727
7
$63,083
1
$12,560
0
$0
APPLICATIONS DENIED
0
$0
10
$43,844
40
$49,416
8
$20,144
2
$27,730
APPLICATIONS WITHDRAWN
0
$0
1
$117,200
21
$62,186
6
$25,288
0
$0
FILES CLOSED FOR INCOMPLETENESS
1
$40,810
0
$0
2
$83,710
0
$0
0
$0
Aggregated Statistics For Year 2000 (Based on 2 partial tracts)
A) FHA, FSA/RHS & VA Home Purchase Loans
B) Conventional Home Purchase Loans
C) Refinancings
D) Home Improvement Loans
F) Non-occupant Loans on < 5 Family Dwellings (A B C & D)
Number
Average Value
Number
Average Value
Number
Average Value
Number
Average Value
Number
Average Value
LOANS ORIGINATED
8
$52,451
25
$61,570
20
$56,034
5
$19,672
6
$71,853
APPLICATIONS APPROVED, NOT ACCEPTED
0
$0
15
$38,717
12
$45,692
2
$8,895
3
$38,367
APPLICATIONS DENIED
2
$39,240
28
$33,746
42
$50,103
8
$22,236
2
$55,460
APPLICATIONS WITHDRAWN
2
$62,260
4
$43,425
30
$48,797
1
$41,860
4
$33,485
FILES CLOSED FOR INCOMPLETENESS
0
$0
3
$53,017
3
$50,923
0
$0
1
$28,250
Aggregated Statistics For Year 1999 (Based on 1 partial tract)
A) FHA, FSA/RHS & VA Home Purchase Loans
B) Conventional Home Purchase Loans
C) Refinancings
D) Home Improvement Loans
F) Non-occupant Loans on < 5 Family Dwellings (A B C & D)

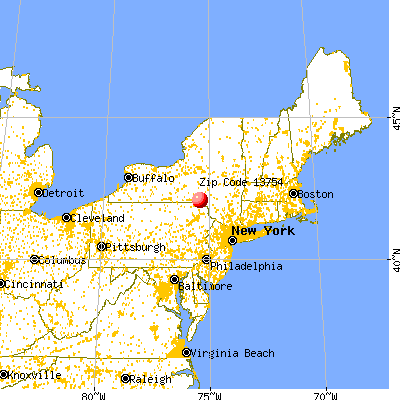


 Nearest zip codes: 13813, 13804, 13730, 13865, 18462, 13847.