Estimated zip code population in 2022: 9,531 Zip code population in 2010: 9,392 Zip code population in 2000: 8,769
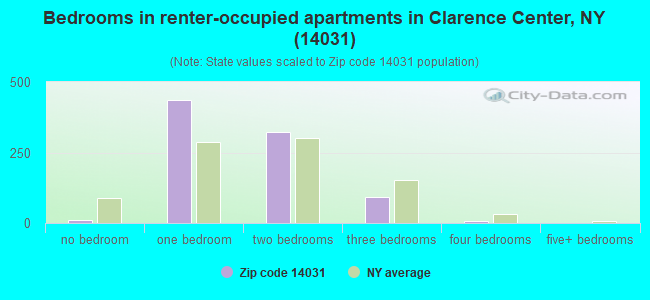
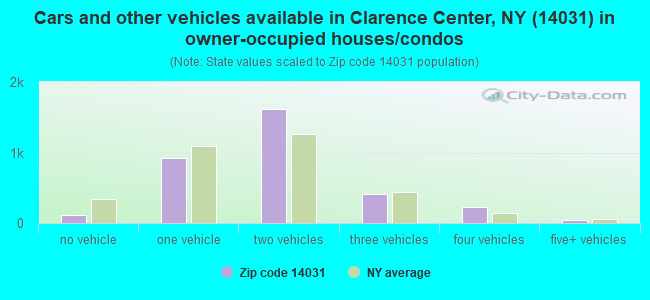
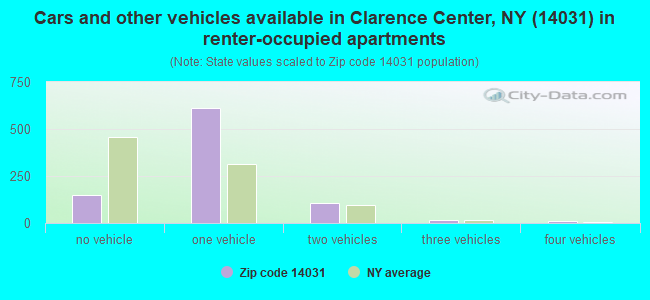
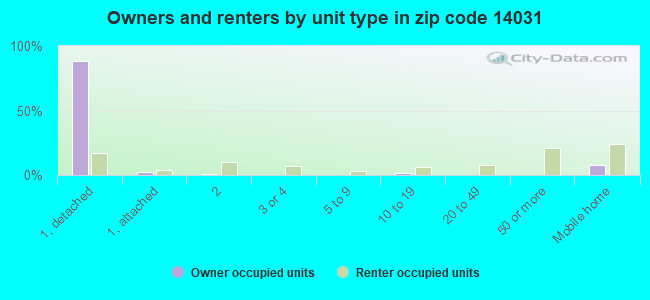
Houses and condos: 4,564 Renter-occupied apartments: 878
% of renters here:
21%
State:
46%
March 2022 cost of living index in zip code 14031: 101.6 (near average, U.S. average is 100)
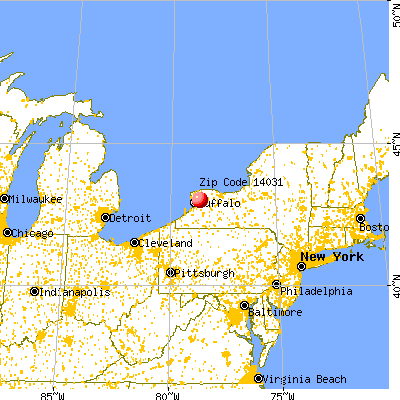
Land area: 18.7 sq. mi. Water area: 0.2 sq. mi.
Population density: 509 people per square mile
(low).
OSM Map
General Map
Google Map
MSN Map
OSM Map
General Map
Google Map
MSN Map
OSM Map
General Map
Google Map
MSN Map
OSM Map
General Map
Google Map
MSN Map
Please wait while loading the map...
Real estate property taxes paid for housing units in 2022:
This zip code:
1.8% ($5,737)
New York:
1.5% ($6,180)
Median real estate property taxes paid for housing units with mortgages in 2022: $6,002 (1.7%) Median real estate property taxes paid for housing units with no mortgage in 2022: $5,149 (1.8%)
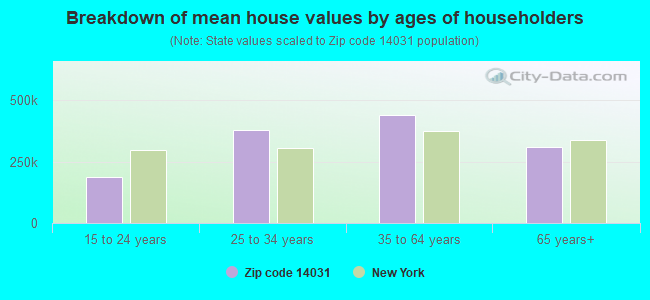
Estimated median house/condo value in 2022: $314,607
14031:
$314,607
New York:
$400,400
According to our research of New York and other state lists, there were 4 registered sex offenders living in 14031 zip code as of April 27, 2024. The ratio of all residents to sex offenders in zip code 14031 is 2,553 to 1. The ratio of registered sex offenders to all residents in this zip code is much lower than the state average.
Median resident age:
This zip code:
51.8 years
New York median age:
40.0 years
Average household size:
This zip code:
2.2 people
New York:
2.5 people
Averages for the 2020 tax year for zip code 14031, filed in 2021:
Average Adjusted Gross Income (AGI) in 2020: $134,293 (Individual Income Tax Returns)
Here:
$134,293
State:
$90,930
Salary/wage: $94,373 (reported on 75.0% of returns)
Here:
$94,373
State:
$72,104
(% of AGI for various income ranges: 993.6% for AGIs below $25k, 3144.9% for AGIs $25k-50k, 5572.0% for AGIs $50k-75k, 8048.4% for AGIs $75k-100k, 16953.9% for AGIs $100k-200k, 100051.1% for AGIs over 200k)
Taxable interest for individuals: $3,675 (reported on 52.5% of returns)
This zip code:
$3,675
New York:
$3,075
(% of AGI for various income ranges: 31.6% for AGIs below $25k, 48.8% for AGIs $25k-50k, 99.1% for AGIs $50k-75k, 120.6% for AGIs $75k-100k, 187.3% for AGIs $100k-200k, 3981.6% for AGIs over 200k)
Ordinary dividends: $12,321 (reported on 38.0% of returns)
Here:
$12,321
State:
$11,095
(% of AGI for various income ranges: 91.5% for AGIs below $25k, 97.2% for AGIs $25k-50k, 221.1% for AGIs $50k-75k, 363.8% for AGIs $75k-100k, 402.5% for AGIs $100k-200k, 9756.3% for AGIs over 200k)
Net capital gain/loss in AGI: +$40,571 (reported on 33.8% of returns)
Here:
+$40,571
State:
+$44,925
(% of AGI for various income ranges: 40.2% for AGIs below $25k, 52.6% for AGIs $25k-50k, 167.3% for AGIs $50k-75k, 443.1% for AGIs $75k-100k, 766.1% for AGIs $100k-200k, 33902.6% for AGIs over 200k)
Profit/loss from business: +$34,876 (reported on 16.2% of returns)
Here:
+$34,876
State:
+$14,940
(% of AGI for various income ranges: 81.6% for AGIs below $25k, 130.9% for AGIs $25k-50k, 197.1% for AGIs $50k-75k, 421.3% for AGIs $75k-100k, 678.1% for AGIs $100k-200k, 11482.6% for AGIs over 200k)
Taxable individual retirement arrangement distribution: $21,069 (reported on 16.4% of returns)
14031:
$21,069
New York:
$19,609
(% of AGI for various income ranges: 130.9% for AGIs below $25k, 202.6% for AGIs $25k-50k, 571.1% for AGIs $50k-75k, 778.4% for AGIs $75k-100k, 952.4% for AGIs $100k-200k, 2597.4% for AGIs over 200k)
Self-employed (Keogh) retirement plans: $29,500 (reported on 2.1% of returns)
14031:
$29,500
New York:
$32,497
(% of AGI for various income ranges: 57.1% for AGIs $100k-200k, 1530.5% for AGIs over 200k)
Total itemized deductions: $43,892 (reported on 12.6% of returns)
Here:
$43,892
State:
$39,326
(% of AGI for various income ranges: 142.0% for AGIs below $25k, 182.6% for AGIs $25k-50k, 368.0% for AGIs $50k-75k, 577.2% for AGIs $75k-100k, 1004.9% for AGIs $100k-200k, 8986.3% for AGIs over 200k)
Charity contributions: $16,028 (reported on 11.1% of returns)
Here:
$16,028
State:
$15,420
(% of AGI for various income ranges: 11.5% for AGIs below $25k, 18.2% for AGIs $25k-50k, 61.8% for AGIs $50k-75k, 101.9% for AGIs $75k-100k, 212.4% for AGIs $100k-200k, 3797.9% for AGIs over 200k)
Taxes paid: $8,732 (reported on 12.4% of returns)
14031:
$8,732
State:
$9,183
(% of AGI for various income ranges: 20.9% for AGIs below $25k, 25.4% for AGIs $25k-50k, 85.8% for AGIs $50k-75k, 180.0% for AGIs $75k-100k, 284.7% for AGIs $100k-200k, 1411.1% for AGIs over 200k)
Earned income credit: $1,648 (reported on 5.5% of returns)
Here:
$1,648
State:
$2,138
(% of AGI for various income ranges: 34.0% for AGIs below $25k, 27.4% for AGIs $25k-50k)
Percentage of individuals using paid preparers for their 2020 taxes: 95.6%
Here:
96%
State:
95%
(% for various income ranges: 94.3% for AGIs below $25k, 96.8% for AGIs $25k-50k, 94.2% for AGIs $50k-75k, 96.2% for AGIs $75k-100k, 96.2% for AGIs $100k-200k, 97.0% for AGIs over 200k)
Averages for the 2012 tax year for zip code 14031, filed in 2013:
Average Adjusted Gross Income (AGI) in 2012: $132,797 (Individual Income Tax Returns)
Here:
$132,797
State:
$77,088
Salary/wage: $73,463 (reported on 79.0% of returns)
Here:
$73,463
State:
$60,593
(% of AGI for various income ranges: 68.3% for AGIs below $25k, 66.0% for AGIs $25k-50k, 64.1% for AGIs $50k-75k, 67.1% for AGIs $75k-100k, 71.4% for AGIs $100k-200k, 29.9% for AGIs over 200k)
Taxable interest for individuals: $4,562 (reported on 54.4% of returns)
This zip code:
$4,562
New York:
$3,125
(% of AGI for various income ranges: 1.6% for AGIs below $25k, 1.3% for AGIs $25k-50k, 1.0% for AGIs $50k-75k, 1.0% for AGIs $75k-100k, 1.0% for AGIs $100k-200k, 2.3% for AGIs over 200k)
Ordinary dividends: $11,934 (reported on 37.1% of returns)
Here:
$11,934
State:
$10,299
(% of AGI for various income ranges: 3.3% for AGIs below $25k, 1.8% for AGIs $25k-50k, 2.7% for AGIs $50k-75k, 2.4% for AGIs $75k-100k, 2.3% for AGIs $100k-200k, 3.9% for AGIs over 200k)
Net capital gain/loss in AGI: +$48,613 (reported on 28.5% of returns)
Here:
+$48,613
State:
+$42,474
(% of AGI for various income ranges: 1.1% for AGIs $25k-50k, 0.3% for AGIs $50k-75k, 1.5% for AGIs $75k-100k, 1.8% for AGIs $100k-200k, 15.5% for AGIs over 200k)
Profit/loss from business: +$45,232 (reported on 16.1% of returns)
Here:
+$45,232
State:
+$16,168
(% of AGI for various income ranges: 5.4% for AGIs below $25k, 5.4% for AGIs $25k-50k, 3.3% for AGIs $50k-75k, 3.3% for AGIs $75k-100k, 4.8% for AGIs $100k-200k, 6.1% for AGIs over 200k)
Taxable individual retirement arrangement distribution: $14,507 (reported on 15.5% of returns)
14031:
$14,507
New York:
$17,621
(% of AGI for various income ranges: 4.6% for AGIs below $25k, 4.0% for AGIs $25k-50k, 4.5% for AGIs $50k-75k, 4.0% for AGIs $75k-100k, 3.2% for AGIs $100k-200k, 0.5% for AGIs over 200k)
Self-employment retirement plans: $30,008 (reported on 2.5% of returns)
14031:
$30,008
New York:
$27,330
(% of AGI for various income ranges: 1.5% for AGIs below $25k, 0.5% for AGIs $100k-200k, 0.7% for AGIs over 200k)
Total itemized deductions: $39,750 (14% of AGI, reported on 42.1% of returns)
Here:
$39,750
State:
$34,985
Here:
14.5% of AGI
State:
21.3% of AGI
(% of AGI for various income ranges: 9.7% for AGIs below $25k, 10.7% for AGIs $25k-50k, 14.3% for AGIs $50k-75k, 15.8% for AGIs $75k-100k, 16.5% for AGIs $100k-200k, 11.4% for AGIs over 200k)
Charity contributions: $5,546 (reported on 37.9% of returns)
Here:
$5,546
State:
$5,572
(% of AGI for various income ranges: 0.8% for AGIs below $25k, 1.6% for AGIs $25k-50k, 2.0% for AGIs $50k-75k, 1.9% for AGIs $75k-100k, 2.2% for AGIs $100k-200k, 1.4% for AGIs over 200k)
Taxes paid: $24,122 (reported on 41.9% of returns)
14031:
$24,122
State:
$18,656
(% of AGI for various income ranges: 2.4% for AGIs below $25k, 3.8% for AGIs $25k-50k, 5.9% for AGIs $50k-75k, 7.0% for AGIs $75k-100k, 8.9% for AGIs $100k-200k, 8.0% for AGIs over 200k)
Earned income credit: $1,610 (reported on 6.4% of returns)
Here:
$1,610
State:
$2,230
(% of AGI for various income ranges: 2.0% for AGIs below $25k, 0.4% for AGIs $25k-50k)
Percentage of individuals using paid preparers for their 2012 taxes: 61.6%
Here:
62%
State:
66%
(% for various income ranges: 52.0% for AGIs below $25k, 56.8% for AGIs $25k-50k, 63.9% for AGIs $50k-75k, 69.4% for AGIs $75k-100k, 68.9% for AGIs $100k-200k, 85.7% for AGIs over 200k)
Averages for the 2004 tax year for zip code 14031, filed in 2005:
Average Adjusted Gross Income (AGI) in 2004: $105,574 (Individual Income Tax Returns)
Here:
$105,574
State:
$59,519
Salary/wage: $60,523 (reported on 79.7% of returns)
Here:
$60,523
State:
$50,673
(% of AGI for various income ranges: 105.3% for AGIs below $10k, 64.9% for AGIs $10k-25k, 70.8% for AGIs $25k-50k, 71.5% for AGIs $50k-75k, 74.5% for AGIs $75k-100k, 36.4% for AGIs over 100k)
Taxable interest for individuals: $3,536 (reported on 66.5% of returns)
This zip code:
$3,536
New York:
$2,377
(% of AGI for various income ranges: 8.5% for AGIs below $10k, 3.8% for AGIs $10k-25k, 2.1% for AGIs $25k-50k, 2.1% for AGIs $50k-75k, 1.9% for AGIs $75k-100k, 2.2% for AGIs over 100k)
Taxable dividends: $7,128 (reported on 43.8% of returns)
Here:
$7,128
State:
$5,394
(% of AGI for various income ranges: 7.6% for AGIs below $10k, 2.9% for AGIs $10k-25k, 2.2% for AGIs $25k-50k, 1.9% for AGIs $50k-75k, 1.6% for AGIs $75k-100k, 3.2% for AGIs over 100k)
Net capital gain/loss: +$33,737 (reported on 34.8% of returns)
Here:
+$33,737
State:
+$23,581
(% of AGI for various income ranges: 1.7% for AGIs below $10k, 0.6% for AGIs $10k-25k, 0.8% for AGIs $25k-50k, 0.8% for AGIs $50k-75k, 1.6% for AGIs $75k-100k, 14.6% for AGIs over 100k)
Profit/loss from business: +$29,572 (reported on 15.9% of returns)
Here:
+$29,572
State:
+$13,809
(% of AGI for various income ranges: 0.6% for AGIs below $10k, 5.4% for AGIs $10k-25k, 4.6% for AGIs $25k-50k, 3.4% for AGIs $50k-75k, 3.8% for AGIs $75k-100k, 4.6% for AGIs over 100k)
IRA payment deduction: $3,264 (reported on 4.3% of returns)
14031:
$3,264
New York:
$3,115
(% of AGI for various income ranges: 0.5% for AGIs $10k-25k, 0.7% for AGIs $25k-50k, 0.3% for AGIs $50k-75k, 0.2% for AGIs $75k-100k, 0.0% for AGIs over 100k)
Self-employed pension: $18,650 (reported on 2.6% of returns)
Here:
$18,650
New York:
$19,016
(% of AGI for various income ranges: 0.3% for AGIs $50k-75k, 0.3% for AGIs $75k-100k, 0.6% for AGIs over 100k)
Total itemized deductions: $28,581 (14% of AGI, reported on 43.5% of returns)
Here:
$28,581
State:
$25,864
Here:
13.6% of AGI
State:
21.9% of AGI
(% of AGI for various income ranges: 11.0% for AGIs below $10k, 10.9% for AGIs $10k-25k, 13.7% for AGIs $25k-50k, 16.2% for AGIs $50k-75k, 18.0% for AGIs $75k-100k, 10.5% for AGIs over 100k)
Charity contributions deductions: $5,826 (3% of AGI, reported on 41.5% of returns)
Here:
$5,826
State:
$4,439
Here:
2.7% of AGI
State:
3.6% of AGI
(% of AGI for various income ranges: 0.5% for AGIs below $10k, 1.6% for AGIs $10k-25k, 2.3% for AGIs $25k-50k, 2.6% for AGIs $50k-75k, 2.9% for AGIs $75k-100k, 2.2% for AGIs over 100k)
Total tax: $23,141 (reported on 77.8% of returns)
14031:
$23,141
State:
$11,730
(% of AGI for various income ranges: 3.1% for AGIs below $10k, 4.4% for AGIs $10k-25k, 7.4% for AGIs $25k-50k, 8.7% for AGIs $50k-75k, 10.0% for AGIs $75k-100k, 20.2% for AGIs over 100k)
Earned income credit: $1,351 (reported on 5.8% of returns)
Here:
$1,351
State:
$1,757
Percentage of individuals using paid preparers for their 2004 taxes: 63.2%
Here:
63%
State:
67%
(% for various income ranges: 50.7% for AGIs below $10k, 57.2% for AGIs $10k-25k, 65.5% for AGIs $25k-50k, 68.0% for AGIs $50k-75k, 67.6% for AGIs $75k-100k, 76.8% for AGIs over 100k)
Likely homosexual households (counted as self-reported same-sex unmarried-partner households)
Lesbian couples: 0.0% of all households
Gay men: 0.3% of all households
Household received Food Stamps/SNAP in the past 12 months: 308 Household did not receive Food Stamps/SNAP in the past 12 months: 3,877
Women who had a birth in the past 12 months: 19 (19 now married, 0 unmarried) Women who did not have a birth in the past 12 months: 1,620 (673 now married, 943 unmarried)
Housing units in zip code 14031 with a mortgage: 1,849 (213 second mortgage, 16 home equity loan, 188 both second mortgage and home equity loan) Houses without a mortgage: 238
Median monthly owner costs for units with a mortgage: $1,867 Median monthly owner costs for units without a mortgage: $722
Residents with income below the poverty level in 2022:
This zip code:
8.0%
Whole state:
14.3%
Residents with income below 50% of the poverty level in 2022:
This zip code:
6.4%
Whole state:
6.8%
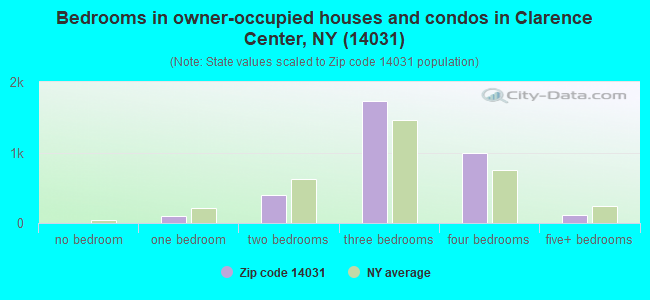
Median number of rooms in houses and condos:
Here:
7.2
State:
6.3
Median number of rooms in apartments:
Here:
3.8
State:
3.8
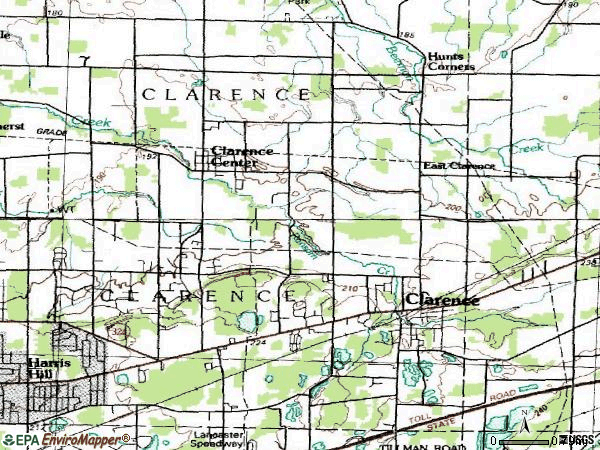
Notable locations in this zip code not listed on our city pages
Notable locations in zip code 14031: Saint Ignatius Retreat Home (A), Pine Meadows Greens (B), Anchor Farms (C), Thunderbird Camp (D), Sacred Heart Home (E), Clarence Fire District 1 (F), Clarence Public Library (G), Clarence Town Hall (H). Display/hide their locations on the map
Churches in zip code 14031 include: Holy Cross Lutheran Church (A), Clarence Church of Christ (B), Clarence First Presbyterian Church (C), Clarence United Methodist Church (D), Buffalo Clarence Community of Christ (E), Emmanuel Baptist Church (F), Faith Fellowship Church (G), New Hope Presbyterian Church (H), Our Lady of Peace Roman Catholic Church (I). Display/hide their locations on the map
In group quarters: 280 (-1 institutionalized population)
Size of family households: 1,295 2-persons, 671 3-persons, 409 4-persons, 178 5-persons, 13 6-persons, 29 7-or-more-persons
Size of nonfamily households: 1,358 1-person, 196 2-persons, 79 3-persons
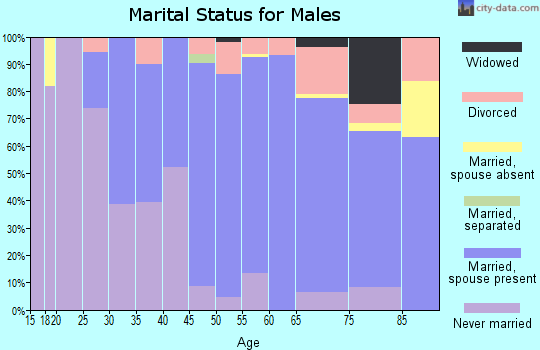
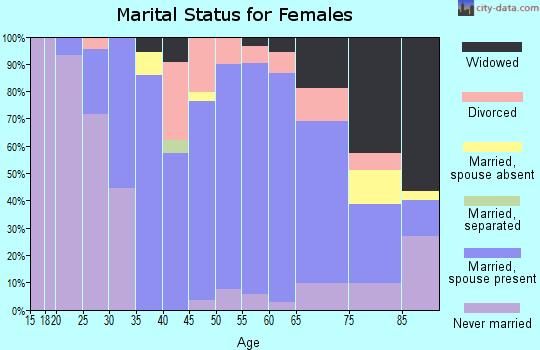
1,141 married couples with children.
205 single-parent households (29 men, 176 women).
97.2% of residents of 14031 zip code speak English at home.
1.3% of residents speak Spanish at home (97% very well, 3% well).
1.7% of residents speak other Indo-European language at home (90% very well, 10% well).
0.1% of residents speak Asian or Pacific Island language at home (100% well).
0.1% of residents speak other language at home (100% very well).
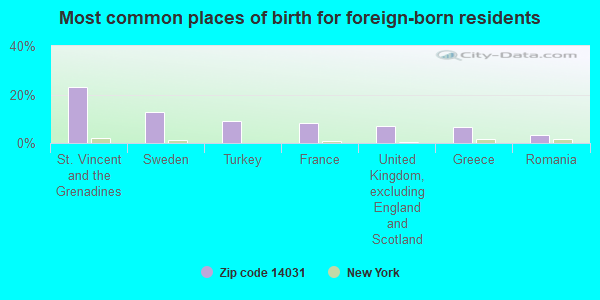
Foreign born population: 432 (4.5%) (78.3% of them are naturalized citizens)
This zip code:
4.5%
Whole state:
22.7%
23%St. Vincent and the Grenadines
13%Sweden
9%Turkey
8%France
7%United Kingdom, excluding England and Scotland
7%Greece
4%Romania
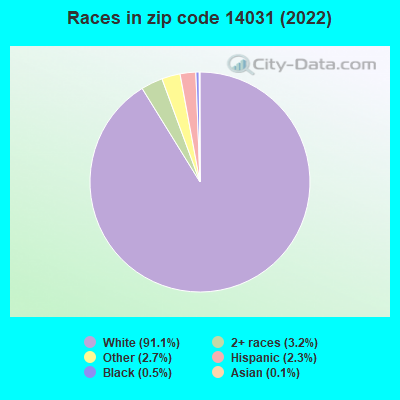
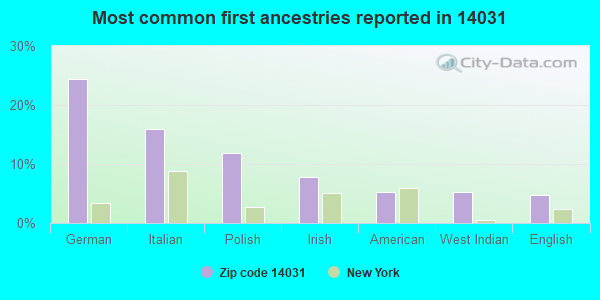
24%German
16%Italian
12%Polish
8%Irish
5%American
5%West Indian
5%English
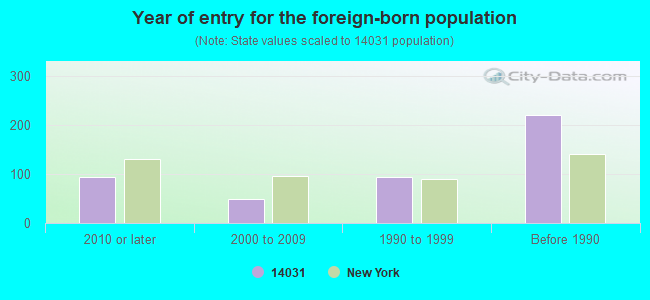
Year of entry for the foreign-born population
942010 or later
492000 to 2009
951990 to 1999
221Before 1990
Facilities with environmental interests located in this zip code:
CLARENCE SR HIGH SCHOOL (9625 MAIN ST in CLARENCE, NY)
STATE MASTER (New York facility tracking) - SECTION 404 PERMITTING, 401 CERTIFICATION, HAZARDOUS WASTE PROGRAM COMPLIANCE ACTIVITY (Tracking inspections of insecticide, fungicide, and rodenticide, and toxic substances) National Pollutant Discharge Elimination System NON-MAJOR (Tracking pollutant discharge elimination systems) - permit HAZARDOUS WASTE BIENNIAL REPORTER (Resource Conservation and Recovery Act (tracking hazardous waste)) Large Quantity Generators, more that 1000 kg of hazardous waste/month (Resource Conservation and Recovery Act (tracking hazardous waste)) - notification Business SIC classification: SEWERAGE SYSTEMS Organizations: CLARENCE CENTRAL SCHOOL DIST (CONTACT/OWNER)
, CLARENCE CTL SCH DIST (LEGALLY RESPONSIBLE PARTY)
Alternative names: CLARENCE CENTRAL SCHOOLS, CLARENCE CENTRAL SCHOOL DISTRICT, CLARENCE CENTRAL SCHOOL-SENIOR H S, CLARENCE CNTR, CLARENCE T
ARTHUR S EXECUTIVE CLEANERS & COFFE SHOP (9450 MAIN STREET in CLARENCE, NY)
AIR MINOR (AIRS/AFS) STATE MASTER (New York facility tracking) - AIR PROGRAM Small Quantity Generators, between 100 kg and 1000 kg of hazardous waste/month (Resource Conservation and Recovery Act (tracking hazardous waste)) - notification Business SIC classification: DRYCLEANING PLANTS, EXCEPT RUG CLEANING Business NAICS classification: DRYCLEANING AND LAUNDRY SERVICES (EXCEPT COIN-OPERATED). Organizations: KING CONSULTING ENGINEER & LAND SURVEYING PC, ARTHUR M FUERST (CONTACT/OWNER)
, LAUNDRY KING OF ERIE COUNTY INC (LEGALLY RESPONSIBLE PARTY)
Alternative names: EXECUTIVE CLEANERS
10123 MAIN STREET INC (10123 MAIN STREET in CLARENCE, NY)
STATE MASTER (New York facility tracking) - HAZARDOUS WASTE PROGRAM National Pollutant Discharge Elimination System NON-MAJOR (Tracking pollutant discharge elimination systems) - permit Business SIC classification: SERVICES Organizations: 10123 MAIN STREET, INC (CONTACT/OWNER)
, MENNEN-GREATBATCH ELEC INC (LEGALLY RESPONSIBLE PARTY)
Alternative names: MENNEN MEDICAL INC
CLASSIC CLEANERS (8925 SHERIDAN DR in CLARENCE, NY)
AIR MINOR (AIRS/AFS) STATE MASTER (New York facility tracking) - National Pollutant Discharge Elimination System Permit, AIR PROGRAM, Small Quantity Generators, between 100 kg and 1000 kg of hazardous waste/month (Resource Conservation and Recovery Act (tracking hazardous waste)) - notification Business SIC classification: DRYCLEANING PLANTS, EXCEPT RUG CLEANING Business NAICS classification: DRYCLEANING AND LAUNDRY SERVICES (EXCEPT COIN-OPERATED). Organizations: LAURENCE & KATHLEEM HEBELER (CONTACT/OWNER)
, LAURENCE E HEBELER INC (LEGALLY RESPONSIBLE PARTY)
INNOVATIVE CONCEPTS IN ENTERTAINMENT INC (ICE) (10123 MAIN ST in CLARENCE, NY)
STATE MASTER (New York facility tracking) - AIR PROGRAM Small Quantity Generators, between 100 kg and 1000 kg of hazardous waste/month (Resource Conservation and Recovery Act (tracking hazardous waste)) Business SIC classification: MANUFACTURING INDUSTRIES Organizations: INNOVATIVE CONCEPTS IN ENTERA (CONTACT/OWNER)
CLARENCE MS ( in CLARENCE, NY)
(National Center for Education Statistics) - STATE ID-140801060008 Organizations: CLARENCE CSD (SCHOOL DISTRICT)
CLARENCE SHS ( in CLARENCE, NY)
(National Center for Education Statistics) - STATE ID-140801060006 Organizations: CLARENCE CSD (SCHOOL DISTRICT)
7 - ELEVEN 16393 (10000 MAIN ST in CLARENCE, NY)
(Resource Conservation and Recovery Act (tracking hazardous waste))
CLARENCE TOWN OF PARKS DEPT (10405 MAIN ST in CLARENCE, NY)
(Resource Conservation and Recovery Act (tracking hazardous waste))
INFINITEX (10100 MAIN ST in CLARENCE, NY)
Conditionally Exempt Small Quantity Generators, less than 100 kg/month of hazardous waste (Resource Conservation and Recovery Act (tracking hazardous waste)) - notification Organizations: WILLIAM H THALMANN (CONTACT/OWNER)
Housing units lacking complete plumbing facilities: 1.0% Housing units lacking complete kitchen facilities: 3.6%
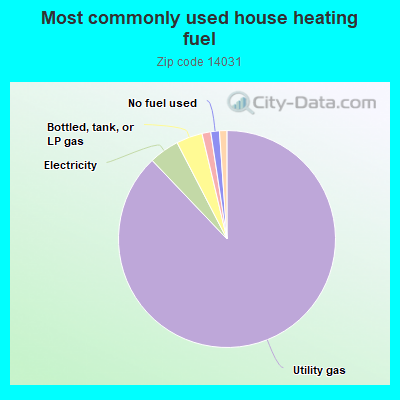
87.9%Utility gas
4.5%Electricity
3.9%Bottled, tank, or LP gas
1.3%Fuel oil, kerosene, etc.
1.3%No fuel used
1.1%Wood
Population in 1990: 7,712. Population change in the 1990s: +1,057 (+13.7%).
Place of birth for U.S.-born residents:
This state: 8,075
Northeast: 365
Midwest: 390
South: 185
West: 20
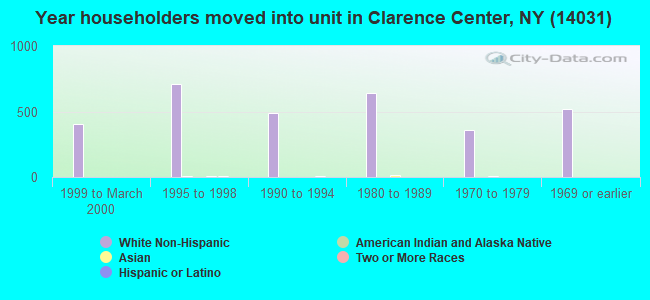
66% of the 14031 zip code residents lived in the same house 5 years ago. Out of people who lived in different houses, 78% lived in this county. Out of people who lived in different counties, 50% lived in New York.
93% of the 14031 zip code residents lived in the same house 1 year ago. Out of people who lived in different houses, 88% moved from this county. Out of people who lived in different houses, 7% moved from different county within same state. Out of people who lived in different houses, 1% moved from abroad.
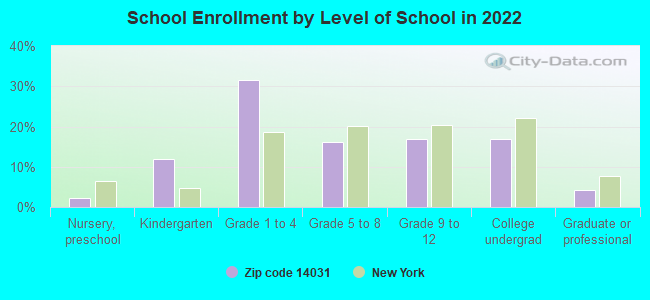
Private vs. public school enrollment:
Students in private schools in grades 1 to 8 (elementary and middle school): 61
Here:
7.2%
New York:
15.6%
Students in private schools in grades 9 to 12 (high school): 1
Here:
0.6%
New York:
15.0%
Students in private undergraduate colleges: 121
Here:
40.2%
New York:
39.2%
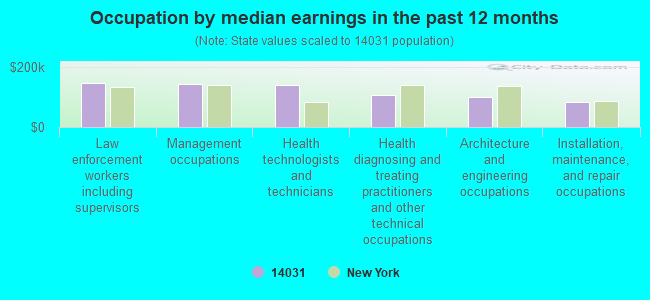
Occupation by median earnings in the past 12 months ($)
146,733Law enforcement workers including supervisors
142,955Management occupations
139,611Health technologists and technicians
106,661Health diagnosing and treating practitioners and other technical occupations
100,314Architecture and engineering occupations
83,721Installation, maintenance, and repair occupations
Companies with federal contracts located in this zip code (CLARENCE, NY):
CERAMIC & MATERIAL PROCESSING, (4921 PINELEDGE DR; small business) : $1,521,624 in 8 contractsfrom 2000 to 2006
Contracts for Ammunition -- Applied Research and Exploratory Development (R&D), Other Research and Development -- Applied Research and Exploratory Development (R&D), Ammunition -- Basic Research (R&D) by Navy Signed by year:2000: $369,900; 2001: $303,417; 2002: $248,408; 2003: $0; 2004: $0; 2005: $0; 2006: $599,899.
Biggest contracts:
$599,899 with Navy for Ammunition -- Applied Research and Exploratory Development (R&D). Signed on 2006-05-25. Completion date: 2008-05-25.
$300,000 with Navy for Other Research and Development -- Applied Research and Exploratory Development (R&D). Signed on 2000-04-03. Completion date: 2001-04-03.
$171,507, same as above.Signed on 2001-03-22. Completion date: 2001-12-31.
$148,820, same as above.Signed on 2002-07-22. Completion date: 2003-07-21.
DYNABRADE INC (8989 SHERIDAN DR; small business) : $111,590 in 2 contractsin 2005
$108,650 with Air Force for Office Furniture. Taking place in FL. Signed on 2005-02-24. Completion date: 2005-07-22.
$2,940 with Air Force for Disks and Stones, Abrasive. Signed on 2005-06-08. Completion date: 2005-06-15.
KELLER INDUSTRIAL PRODUCTS INC (9132 MAIN ST; small business) : $30,026 in 3 contractsin 2005
$30,026 with Defense Logistics Agency for Miscellaneous Machine Tools. Signed on 2005-05-03. Completion date: 2005-07-07.
$4,697 with Army for Machine Tool Accessories. Signed on 2005-12-13. Completion date: 2006-01-26.
-$4,697, same as above.Signed on 2005-12-19. Completion date: 2006-01-26.
FITZSIMMONS HYDRAULICS, INC (4400 SHISLER RD STE 1; small business)
$3,578 with Army for Maintenance, Repair and Rebuilding of Equipment -- Instruments and Laboratory Equipment. Signed on 2006-03-14. Completion date: 2006-03-20.
Top industries in this zip code by the number of employees in 2005:
Health Care and Social Assistance: Nursing Care Facilities (250-499 employees: 1 establishment)
2002 - 2018 National Fire Incident Reporting System (NFIRS) incidents
Based on the data from the years 2002 - 2018 the average number of fire incidents per year is 20. The highest number of fire incidents - 43 took place in 2009, and the least - 10 in 2003. The data has a rising trend.
When looking into fire subcategories, the most reports belonged to: Structure Fires (51.6%), and Outside Fires (30.9%).
Fire incident types reported to NFIRS in Zip Code 14031


 Nearest zip codes: 14032, 14086, 14026, 14051, 14221, 14001.


 Based on the data from the years 2002 - 2018 the average number of fire incidents per year is 20. The highest number of fire incidents - 43 took place in 2009, and the least - 10 in 2003. The data has a rising trend.
 When looking into fire subcategories, the most reports belonged to: Structure Fires (51.6%), and Outside Fires (30.9%).