Estimated zip code population in 2022: 34,563 Zip code population in 2010: 31,847 Zip code population in 2000: 28,516
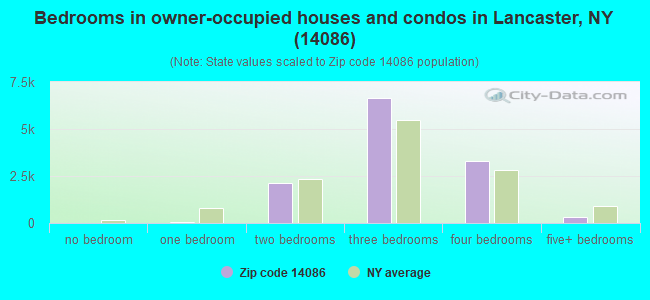
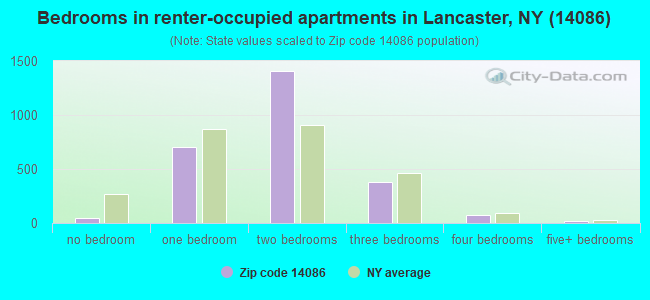
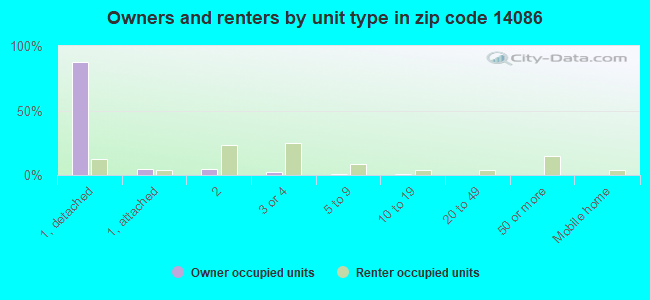
Houses and condos: 15,405 Renter-occupied apartments: 2,657
% of renters here:
18%
State:
46%
March 2022 cost of living index in zip code 14086: 100.9 (near average, U.S. average is 100)
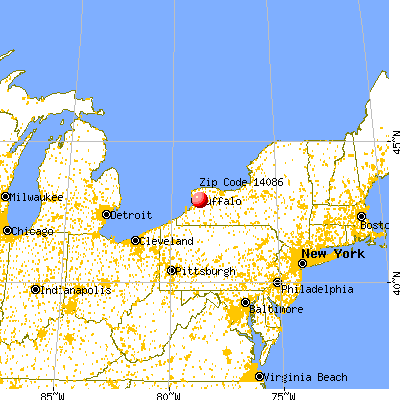
Land area: 33.9 sq. mi. Water area: 0.2 sq. mi.
Population density: 1,020 people per square mile
(low).
OSM Map
General Map
Google Map
MSN Map
OSM Map
General Map
Google Map
MSN Map
OSM Map
General Map
Google Map
MSN Map
OSM Map
General Map
Google Map
MSN Map
Please wait while loading the map...
Real estate property taxes paid for housing units in 2022:
This zip code:
2.2% ($5,546)
New York:
1.5% ($6,180)
Median real estate property taxes paid for housing units with mortgages in 2022: $5,764 (2.2%) Median real estate property taxes paid for housing units with no mortgage in 2022: $5,209 (2.1%)
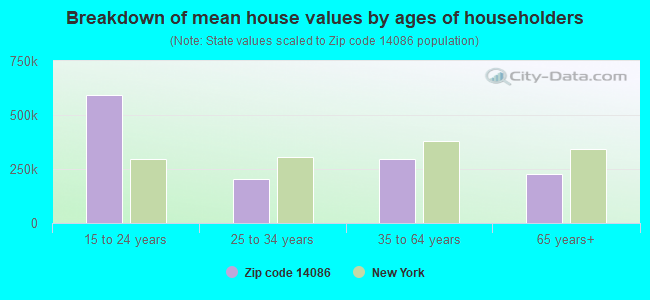
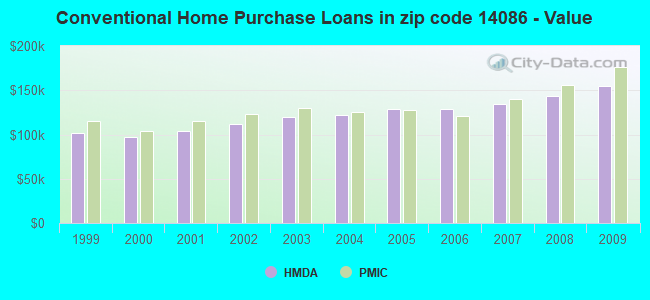
Estimated median house/condo value in 2022: $256,544
14086:
$256,544
New York:
$400,400
According to our research of New York and other state lists, there were 12 registered sex offenders living in 14086 zip code as of April 26, 2024. The ratio of all residents to sex offenders in zip code 14086 is 2,779 to 1. The ratio of registered sex offenders to all residents in this zip code is much lower than the state average.
Median resident age:
This zip code:
46.5 years
New York median age:
40.0 years
Average household size:
This zip code:
2.2 people
New York:
2.5 people
Averages for the 2020 tax year for zip code 14086, filed in 2021:
Average Adjusted Gross Income (AGI) in 2020: $78,862 (Individual Income Tax Returns)
Here:
$78,862
State:
$90,930
Salary/wage: $70,000 (reported on 82.3% of returns)
Here:
$70,000
State:
$72,104
(% of AGI for various income ranges: 1090.1% for AGIs below $25k, 3343.9% for AGIs $25k-50k, 5901.3% for AGIs $50k-75k, 8642.4% for AGIs $75k-100k, 17111.7% for AGIs $100k-200k, 58942.8% for AGIs over 200k)
Taxable interest for individuals: $944 (reported on 47.6% of returns)
This zip code:
$944
New York:
$3,075
(% of AGI for various income ranges: 18.5% for AGIs below $25k, 26.5% for AGIs $25k-50k, 47.9% for AGIs $50k-75k, 72.6% for AGIs $75k-100k, 92.2% for AGIs $100k-200k, 633.6% for AGIs over 200k)
Ordinary dividends: $2,710 (reported on 28.1% of returns)
Here:
$2,710
State:
$11,095
(% of AGI for various income ranges: 29.5% for AGIs below $25k, 40.6% for AGIs $25k-50k, 77.2% for AGIs $50k-75k, 125.5% for AGIs $75k-100k, 155.4% for AGIs $100k-200k, 1134.1% for AGIs over 200k)
Net capital gain/loss in AGI: +$8,587 (reported on 22.1% of returns)
Here:
+$8,587
State:
+$44,925
(% of AGI for various income ranges: 14.7% for AGIs below $25k, 29.1% for AGIs $25k-50k, 62.2% for AGIs $50k-75k, 146.5% for AGIs $75k-100k, 318.6% for AGIs $100k-200k, 5681.0% for AGIs over 200k)
Profit/loss from business: +$18,022 (reported on 10.7% of returns)
Here:
+$18,022
State:
+$14,940
(% of AGI for various income ranges: 52.5% for AGIs below $25k, 73.0% for AGIs $25k-50k, 113.9% for AGIs $50k-75k, 197.8% for AGIs $75k-100k, 422.6% for AGIs $100k-200k, 3997.4% for AGIs over 200k)
Taxable individual retirement arrangement distribution: $14,565 (reported on 12.4% of returns)
14086:
$14,565
New York:
$19,609
(% of AGI for various income ranges: 82.8% for AGIs below $25k, 139.0% for AGIs $25k-50k, 284.0% for AGIs $50k-75k, 350.4% for AGIs $75k-100k, 485.8% for AGIs $100k-200k, 707.2% for AGIs over 200k)
Self-employed (Keogh) retirement plans: $27,269 (reported on 0.7% of returns)
14086:
$27,269
New York:
$32,497
(% of AGI for various income ranges: 9.5% for AGIs $25k-50k, 22.4% for AGIs $100k-200k, 679.7% for AGIs over 200k)
Total itemized deductions: $25,308 (reported on 7.2% of returns)
Here:
$25,308
State:
$39,326
(% of AGI for various income ranges: 46.7% for AGIs below $25k, 77.9% for AGIs $25k-50k, 273.5% for AGIs $50k-75k, 363.4% for AGIs $75k-100k, 435.1% for AGIs $100k-200k, 1920.0% for AGIs over 200k)
Charity contributions: $5,278 (reported on 5.8% of returns)
Here:
$5,278
State:
$15,420
(% of AGI for various income ranges: 2.2% for AGIs below $25k, 9.1% for AGIs $25k-50k, 28.6% for AGIs $50k-75k, 41.9% for AGIs $75k-100k, 76.3% for AGIs $100k-200k, 544.4% for AGIs over 200k)
Taxes paid: $8,725 (reported on 7.2% of returns)
14086:
$8,725
State:
$9,183
(% of AGI for various income ranges: 7.5% for AGIs below $25k, 25.2% for AGIs $25k-50k, 105.2% for AGIs $50k-75k, 149.8% for AGIs $75k-100k, 158.5% for AGIs $100k-200k, 533.1% for AGIs over 200k)
Earned income credit: $1,745 (reported on 5.7% of returns)
Here:
$1,745
State:
$2,138
(% of AGI for various income ranges: 31.8% for AGIs below $25k, 28.5% for AGIs $25k-50k)
Percentage of individuals using paid preparers for their 2020 taxes: 96.2%
Here:
96%
State:
95%
(% for various income ranges: 94.9% for AGIs below $25k, 96.6% for AGIs $25k-50k, 96.7% for AGIs $50k-75k, 96.3% for AGIs $75k-100k, 96.7% for AGIs $100k-200k, 97.1% for AGIs over 200k)
Averages for the 2012 tax year for zip code 14086, filed in 2013:
Average Adjusted Gross Income (AGI) in 2012: $63,519 (Individual Income Tax Returns)
Here:
$63,519
State:
$77,088
Salary/wage: $57,170 (reported on 85.9% of returns)
Here:
$57,170
State:
$60,593
(% of AGI for various income ranges: 72.1% for AGIs below $25k, 74.9% for AGIs $25k-50k, 74.7% for AGIs $50k-75k, 80.0% for AGIs $75k-100k, 84.1% for AGIs $100k-200k, 61.7% for AGIs over 200k)
Taxable interest for individuals: $782 (reported on 53.8% of returns)
This zip code:
$782
New York:
$3,125
(% of AGI for various income ranges: 1.4% for AGIs below $25k, 0.8% for AGIs $25k-50k, 0.7% for AGIs $50k-75k, 0.4% for AGIs $75k-100k, 0.5% for AGIs $100k-200k, 0.9% for AGIs over 200k)
Ordinary dividends: $2,106 (reported on 29.5% of returns)
Here:
$2,106
State:
$10,299
(% of AGI for various income ranges: 2.0% for AGIs below $25k, 1.0% for AGIs $25k-50k, 1.1% for AGIs $50k-75k, 0.6% for AGIs $75k-100k, 0.7% for AGIs $100k-200k, 1.7% for AGIs over 200k)
Net capital gain/loss in AGI: +$6,694 (reported on 19.4% of returns)
Here:
+$6,694
State:
+$42,474
(% of AGI for various income ranges: 0.1% for AGIs $25k-50k, 0.5% for AGIs $50k-75k, 0.5% for AGIs $75k-100k, 0.7% for AGIs $100k-200k, 11.7% for AGIs over 200k)
Profit/loss from business: +$14,318 (reported on 10.7% of returns)
Here:
+$14,318
State:
+$16,168
(% of AGI for various income ranges: 3.0% for AGIs below $25k, 2.4% for AGIs $25k-50k, 1.9% for AGIs $50k-75k, 1.4% for AGIs $75k-100k, 2.6% for AGIs $100k-200k, 3.3% for AGIs over 200k)
Taxable individual retirement arrangement distribution: $10,520 (reported on 11.2% of returns)
14086:
$10,520
New York:
$17,621
(% of AGI for various income ranges: 4.3% for AGIs below $25k, 2.8% for AGIs $25k-50k, 2.2% for AGIs $50k-75k, 1.9% for AGIs $75k-100k, 1.4% for AGIs $100k-200k, 0.8% for AGIs over 200k)
Self-employment retirement plans: $16,718 (reported on 0.7% of returns)
14086:
$16,718
New York:
$27,330
(% of AGI for various income ranges: 0.1% for AGIs $50k-75k, 0.2% for AGIs $100k-200k, 0.6% for AGIs over 200k)
Total itemized deductions: $20,697 (19% of AGI, reported on 43.1% of returns)
Here:
$20,697
State:
$34,985
Here:
19.4% of AGI
State:
21.3% of AGI
(% of AGI for various income ranges: 8.3% for AGIs below $25k, 10.1% for AGIs $25k-50k, 13.5% for AGIs $50k-75k, 14.8% for AGIs $75k-100k, 15.9% for AGIs $100k-200k, 14.1% for AGIs over 200k)
Charity contributions: $2,211 (reported on 38.4% of returns)
Here:
$2,211
State:
$5,572
(% of AGI for various income ranges: 0.6% for AGIs below $25k, 0.8% for AGIs $25k-50k, 1.3% for AGIs $50k-75k, 1.4% for AGIs $75k-100k, 1.6% for AGIs $100k-200k, 1.4% for AGIs over 200k)
Taxes paid: $11,315 (reported on 43.0% of returns)
14086:
$11,315
State:
$18,656
(% of AGI for various income ranges: 2.8% for AGIs below $25k, 4.2% for AGIs $25k-50k, 6.5% for AGIs $50k-75k, 7.7% for AGIs $75k-100k, 9.3% for AGIs $100k-200k, 9.1% for AGIs over 200k)
Earned income credit: $1,694 (reported on 7.5% of returns)
Here:
$1,694
State:
$2,230
(% of AGI for various income ranges: 2.4% for AGIs below $25k, 0.6% for AGIs $25k-50k)
Percentage of individuals using paid preparers for their 2012 taxes: 60.5%
Here:
60%
State:
66%
(% for various income ranges: 53.0% for AGIs below $25k, 58.8% for AGIs $25k-50k, 66.5% for AGIs $50k-75k, 65.0% for AGIs $75k-100k, 65.4% for AGIs $100k-200k, 77.3% for AGIs over 200k)
Averages for the 2004 tax year for zip code 14086, filed in 2005:
Average Adjusted Gross Income (AGI) in 2004: $50,478 (Individual Income Tax Returns)
Here:
$50,478
State:
$59,519
Salary/wage: $48,174 (reported on 86.8% of returns)
Here:
$48,174
State:
$50,673
(% of AGI for various income ranges: 94.9% for AGIs below $10k, 69.2% for AGIs $10k-25k, 79.3% for AGIs $25k-50k, 83.8% for AGIs $50k-75k, 88.1% for AGIs $75k-100k, 82.0% for AGIs over 100k)
Taxable interest for individuals: $900 (reported on 68.2% of returns)
This zip code:
$900
New York:
$2,377
(% of AGI for various income ranges: 4.3% for AGIs below $10k, 2.7% for AGIs $10k-25k, 1.5% for AGIs $25k-50k, 1.0% for AGIs $50k-75k, 0.7% for AGIs $75k-100k, 1.2% for AGIs over 100k)
Taxable dividends: $1,139 (reported on 35.1% of returns)
Here:
$1,139
State:
$5,394
(% of AGI for various income ranges: 3.3% for AGIs below $10k, 1.7% for AGIs $10k-25k, 0.9% for AGIs $25k-50k, 0.6% for AGIs $50k-75k, 0.5% for AGIs $75k-100k, 0.8% for AGIs over 100k)
Net capital gain/loss: +$2,345 (reported on 24.4% of returns)
Here:
+$2,345
State:
+$23,581
(% of AGI for various income ranges: -2.8% for AGIs below $10k, 0.3% for AGIs $10k-25k, 0.2% for AGIs $25k-50k, 0.3% for AGIs $50k-75k, 0.6% for AGIs $75k-100k, 2.8% for AGIs over 100k)
Profit/loss from business: +$10,206 (reported on 10.8% of returns)
Here:
+$10,206
State:
+$13,809
(% of AGI for various income ranges: 1.1% for AGIs below $10k, 2.4% for AGIs $10k-25k, 2.1% for AGIs $25k-50k, 1.9% for AGIs $50k-75k, 1.5% for AGIs $75k-100k, 2.9% for AGIs over 100k)
IRA payment deduction: $3,029 (reported on 4.0% of returns)
14086:
$3,029
New York:
$3,115
(% of AGI for various income ranges: 0.3% for AGIs $10k-25k, 0.5% for AGIs $25k-50k, 0.3% for AGIs $50k-75k, 0.2% for AGIs $75k-100k, 0.1% for AGIs over 100k)
Self-employed pension: $10,545 (reported on 0.8% of returns)
Here:
$10,545
New York:
$19,016
(% of AGI for various income ranges: 0.1% for AGIs $25k-50k, 0.1% for AGIs $50k-75k, 0.1% for AGIs $75k-100k, 0.3% for AGIs over 100k)
Total itemized deductions: $16,645 (20% of AGI, reported on 45.8% of returns)
Here:
$16,645
State:
$25,864
Here:
20.4% of AGI
State:
21.9% of AGI
(% of AGI for various income ranges: 10.2% for AGIs below $10k, 9.0% for AGIs $10k-25k, 12.2% for AGIs $25k-50k, 16.0% for AGIs $50k-75k, 17.4% for AGIs $75k-100k, 15.6% for AGIs over 100k)
Charity contributions deductions: $2,030 (2% of AGI, reported on 43.8% of returns)
Here:
$2,030
State:
$4,439
Here:
2.4% of AGI
State:
3.6% of AGI
(% of AGI for various income ranges: 0.5% for AGIs below $10k, 1.0% for AGIs $10k-25k, 1.3% for AGIs $25k-50k, 1.8% for AGIs $50k-75k, 2.1% for AGIs $75k-100k, 1.9% for AGIs over 100k)
Total tax: $6,441 (reported on 81.1% of returns)
14086:
$6,441
State:
$11,730
(% of AGI for various income ranges: 2.2% for AGIs below $10k, 4.3% for AGIs $10k-25k, 7.2% for AGIs $25k-50k, 8.2% for AGIs $50k-75k, 9.4% for AGIs $75k-100k, 15.3% for AGIs over 100k)
Earned income credit: $1,380 (reported on 6.3% of returns)
Here:
$1,380
State:
$1,757
Percentage of individuals using paid preparers for their 2004 taxes: 60.3%
Here:
60%
State:
67%
(% for various income ranges: 49.0% for AGIs below $10k, 57.5% for AGIs $10k-25k, 62.6% for AGIs $25k-50k, 66.9% for AGIs $50k-75k, 63.0% for AGIs $75k-100k, 66.3% for AGIs over 100k)
Likely homosexual households (counted as self-reported same-sex unmarried-partner households)
Lesbian couples: 0.1% of all households
Gay men: 0.1% of all households
Household received Food Stamps/SNAP in the past 12 months: 807 Household did not receive Food Stamps/SNAP in the past 12 months: 14,181
Women who had a birth in the past 12 months: 464 (319 now married, 145 unmarried) Women who did not have a birth in the past 12 months: 6,636 (3,167 now married, 3,432 unmarried)
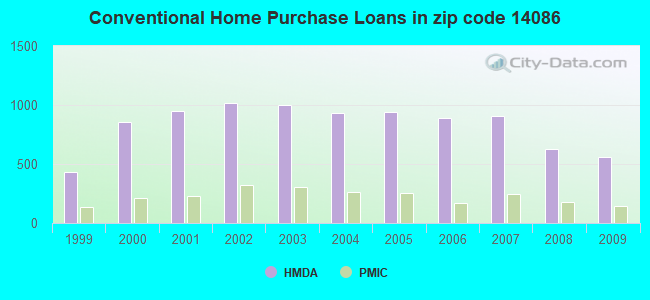
Housing units in zip code 14086 with a mortgage: 7,759 (1,003 second mortgage, 977 both second mortgage and home equity loan) Houses without a mortgage: 769
Median monthly owner costs for units with a mortgage: $1,609 Median monthly owner costs for units without a mortgage: $739
Residents with income below the poverty level in 2022:
This zip code:
3.6%
Whole state:
14.3%
Residents with income below 50% of the poverty level in 2022:
This zip code:
2.1%
Whole state:
6.8%
Median number of rooms in houses and condos:
Here:
6.7
State:
6.3
Median number of rooms in apartments:
Here:
4.4
State:
3.8
Notable locations in this zip code not listed on our city pages
Notable locations in zip code 14086: Fox Valley Club (A), Clarence Rest Area (B), Buffalo Tournament Club (C), Lancaster Speedway (D), Lancaster Golf and Country Club (E), Town Line Volunteer Fire Department (F), Lancaster Fire Department Station 1 (G), Twin District Fire Company (H), Lancaster Fire Department Station 2 (I), Lancaster Public Library (J), Lancaster Town Hall (K), Greenfield Court Assisted Living Facility (L), Greenfield Health and Rehabilitation Center (M). Display/hide their locations on the map
Churches in zip code 14086 include: Hillview Church (A), Bible Tabernacle (B), Calvary Chapel of the Niagara (C), Faith United Methodist Church (D), Holy Mother of the Rosary Cathedral (E), Lancaster Community Baptist Church (F), Lancaster Presbyterian Church (G), Love Joy Gospel Church (H), Saint John's Lutheran Church (I). Display/hide their locations on the map
Cemeteries: John Wolf Cemetery (1), Saint Augustines Cemetery (2), Powers Cemetery (3), Saint Adalbert's Cemetery (4). Display/hide their locations on the map
In group quarters: 412 (-1 institutionalized population)
Size of family households: 4,552 2-persons, 2,044 3-persons, 1,979 4-persons, 830 5-persons, 176 6-persons, 47 7-or-more-persons
Size of nonfamily households: 4,765 1-person, 784 2-persons
5,219 married couples with children.
1,017 single-parent households (417 men, 600 women).
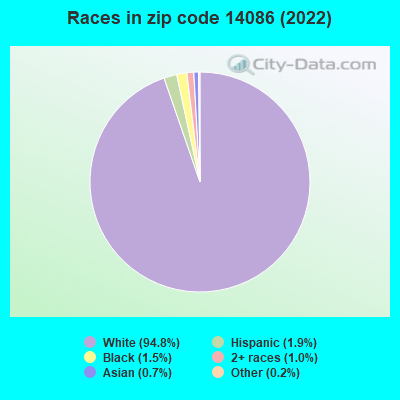
96.0% of residents of 14086 zip code speak English at home.
0.6% of residents speak Spanish at home (53% very well, 47% well).
2.6% of residents speak other Indo-European language at home (81% very well, 16% well, 3% not well).
0.2% of residents speak Asian or Pacific Island language at home (71% very well, 1% well, 28% not well).
0.6% of residents speak other language at home (64% very well, 24% well, 12% not well).
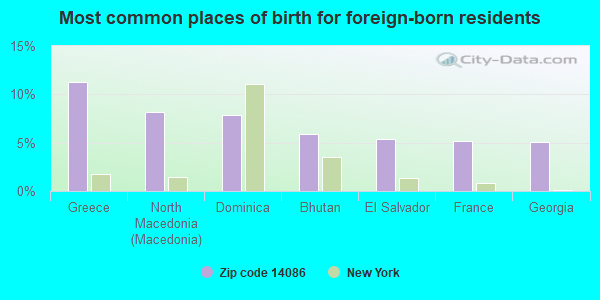
Foreign born population: 1,253 (3.6%) (60.3% of them are naturalized citizens)
This zip code:
3.6%
Whole state:
22.7%
11%Greece
8%North Macedonia (Macedonia)
8%Dominica
6%Bhutan
5%El Salvador
5%France
5%Georgia
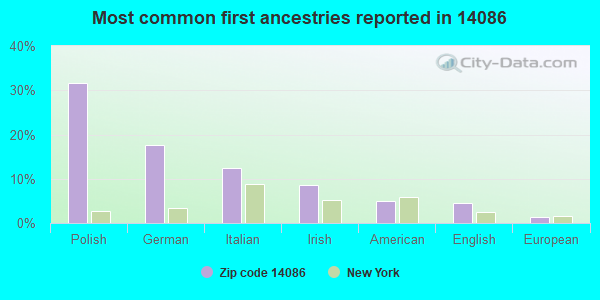
32%Polish
18%German
13%Italian
9%Irish
5%American
5%English
1%European
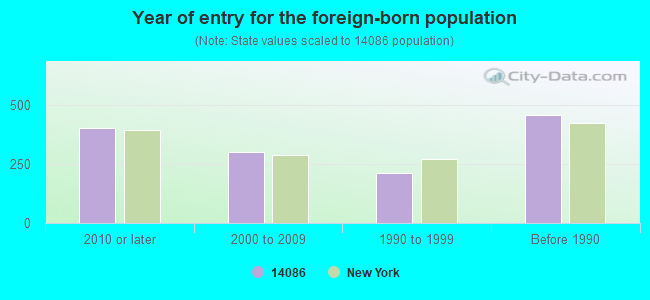
Year of entry for the foreign-born population
4032010 or later
3032000 to 2009
2141990 to 1999
458Before 1990
Major facilities with environmental interests located in this zip code:
CINTAS CORP (5740 GENESEE ST in LANCASTER, NY)
STATE MASTER (New York facility tracking) - National Pollutant Discharge Elimination System Permit (Integrated Compliance Information System) - ICIS-02-2003-4001, FORMAL ENFORCEMENT ACTION Large Quantity Generators, more that 1000 kg of hazardous waste/month (Resource Conservation and Recovery Act (tracking hazardous waste)) - notification Organizations: CINTAS CORP NO 2 (LEGALLY RESPONSIBLE PARTY)
ASC A DIVISION OF ECOLOGY & ENVIRONMENT INC (4493 WALDEN AVENUE in LANCASTER, NY)
COMPLIANCE ACTIVITY (Tracking inspections of insecticide, fungicide, and rodenticide, and toxic substances) STATE MASTER (New Jersey environmental info) - NJEMS-NY792, LABORATORY CERTIFICATION HAZARDOUS WASTE BIENNIAL REPORTER (Resource Conservation and Recovery Act (tracking hazardous waste)) Large Quantity Generators, more that 1000 kg of hazardous waste/month (Resource Conservation and Recovery Act (tracking hazardous waste)) - notification Business SIC classification: TESTING LABORATORIES Organizations: ASC A DIV OF ECOLOGY & ENVIRONMENT INC, ECOLOGY AND ENVIRONMENT, INC. (CONTACT/OPERATOR)
Alternative names: ECOLOGY & ENVIRONEMENT INCORPORATED
J B A METAL FAB CO INC (41 WARD RD in LANCASTER, NY)
STATE MASTER (New York facility tracking) - AIR PROGRAM (Resource Conservation and Recovery Act (tracking hazardous waste)) Business SIC classification: FABRICATED METAL PRODUCTS Organizations: JOHN A ZUROWSKI (CONTACT/OWNER)
Alternative names: J B A METAL FABRICATING CO INC
AIRTEK (4087 WALDEN AVE in LANCASTER, NY)
STATE MASTER (New York facility tracking) - AIR PROGRAM, National Pollutant Discharge Elimination System Permit (Resource Conservation and Recovery Act (tracking hazardous waste)) Business SIC classification: GENERAL INDUSTRIAL MACHINERY AND EQUIPMENT Organizations: RAYCO ENTERPRISES (LEGALLY RESPONSIBLE PARTY)
AMERICAN SALES CO (4201 WALDEN AVE in LANCASTER, NY)
STATE MASTER (New Jersey environmental info) - NJEMS-003625, PESTICIDES - MANUFACTURE (Resource Conservation and Recovery Act (tracking hazardous waste)) Organizations: QUALIS INC
ALCO PLASTICS INC (35 WARD ROAD in LANCASTER, NY)
STATE MASTER (New York facility tracking) - AIR PROGRAM Small Quantity Generators, between 100 kg and 1000 kg of hazardous waste/month (Resource Conservation and Recovery Act (tracking hazardous waste)) - notification Business SIC classification: COMMERCIAL PRINTING Organizations: RAYMOND J MAZURCZYK (CONTACT/OWNER)
H C BRILL (HENRY & HENRY) (3765 WALDEN AVE in LANCASTER, NY)
COMPLIANCE ACTIVITY (Tracking inspections of insecticide, fungicide, and rodenticide, and toxic substances) TRI REPORTER (Tracking of toxic chemicals releasing facilities) - ICIS-02-2005-4210, ENFORCEMENT/COMPLIANCE ACTIVITY Business SIC classification: FLAVORING EXTRACTS AND FLAVORING SYRUPS Alternative names: HENRY & HENRY, INC, DBA H.C. BRILL CO.
HILLVIEW ES ( in LANCASTER, NY)
(National Center for Education Statistics) - STATE ID-141901060006 Organizations: LANCASTER CSD (SCHOOL DISTRICT)
CT STREET ES ( in LANCASTER, NY)
(National Center for Education Statistics) - STATE ID-141901060005 Organizations: LANCASTER CSD (SCHOOL DISTRICT)
COMO PARK ES ( in LANCASTER, NY)
(National Center for Education Statistics) - STATE ID-141901060004 Organizations: LANCASTER CSD (SCHOOL DISTRICT)
AMERICAN SUPERCONDUCTOR CORP (101 W DRULLARD AVE in LANCASTER, NY)
Large Quantity Generators, more that 1000 kg of hazardous waste/month (Resource Conservation and Recovery Act (tracking hazardous waste)) - notification Organizations: HARPER INTERNATIONAL (CONTACT/OWNER)
J & L PERFORMANCE (3861 WALDEN AVE in LANCASTER, NY)
(Resource Conservation and Recovery Act (tracking hazardous waste))
J & M SCHAEFER INC - LANCASTER (4391 WALDEN AVE in LANCASTER, NY)
(Resource Conservation and Recovery Act (tracking hazardous waste))
Housing units lacking complete kitchen facilities: 0.7%
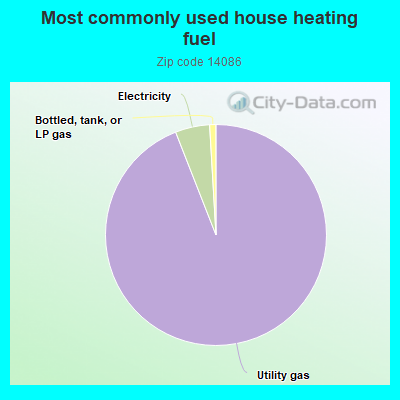
93.3%Utility gas
5.0%Electricity
0.9%Bottled, tank, or LP gas
Population in 1990: 24,540. Population change in the 1990s: +3,976 (+16.2%).
Place of birth for U.S.-born residents:
This state: 30,902
Northeast: 673
Midwest: 410
South: 855
West: 209
69% of the 14086 zip code residents lived in the same house 5 years ago. Out of people who lived in different houses, 89% lived in this county. Out of people who lived in different counties, 50% lived in New York.
93% of the 14086 zip code residents lived in the same house 1 year ago. Out of people who lived in different houses, 74% moved from this county. Out of people who lived in different houses, 13% moved from different county within same state. Out of people who lived in different houses, 10% moved from different state.
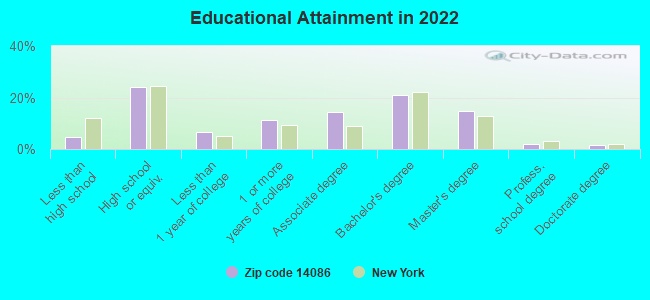
Private vs. public school enrollment:
Students in private schools in grades 1 to 8 (elementary and middle school): 271
Here:
10.0%
New York:
15.6%
Students in private schools in grades 9 to 12 (high school): 165
Here:
9.0%
New York:
15.0%
Students in private undergraduate colleges: 335
Here:
26.5%
New York:
39.2%
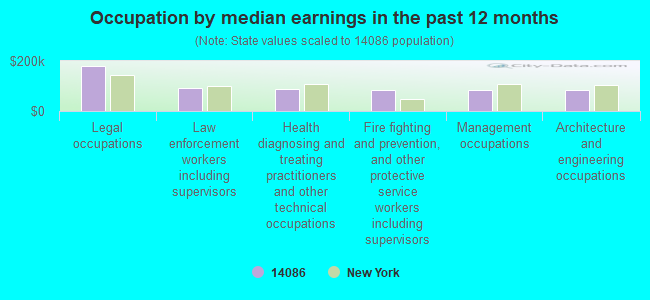
Occupation by median earnings in the past 12 months ($)
180,931Legal occupations
90,738Law enforcement workers including supervisors
89,037Health diagnosing and treating practitioners and other technical occupations
84,371Fire fighting and prevention, and other protective service workers including supervisors
83,874Management occupations
83,423Architecture and engineering occupations
Companies with biggest federal contracts located in this zip code (LANCASTER, NY):
AVOX SYSTEMS INC (225 ERIE STREET) : $57,108,228 in 322 contractsfrom 1999 to 2006
Contracts for Textiles, Clothing and Equipage -- Operational Systems Development (R&D), Aircraft Air Conditioning, Heating, and Pressurizing Equipment, Individual Equipment, Specialized Flight Clothing and Accessories, and moreby Air Force, Defense Logistics Agency, Navy, United States Coast Guard (disused code: now 7008), and others Signed by year:2000: $9,929,560; 2001: $6,289,160; 2002: $4,457,245; 2003: $15,144,856; 2004: $9,014,318; 2005: $7,588,834; 2006: $3,112,913.
Biggest contracts:
$6,166,753 with Air Force for Textiles, Clothing and Equipage -- Operational Systems Development (R&D). Signed on 2003-02-25. Completion date: 2006-12-31.
$5,401,000, same as above.Signed on 2003-12-30. Completion date: 2006-12-31.
$3,739,770, same as above.Signed on 2004-12-21. Completion date: 2007-02-28.
$3,188,053 with Defense Logistics Agency for Aircraft Air Conditioning, Heating, and Pressurizing Equipment. Signed on 2001-11-30. Completion date: 2003-09-21.
AVOX SYSTEMS, INC (225 ERIE ST; small business) : $2,778,069 in 80 contractsfrom 2004 to 2006
Contracts for Aircraft Air Conditioning, Heating, and Pressurizing Equipment, Switches, Specialized Flight Clothing and Accessories, Miscellaneous Electric Power and Distribution Equipment, and moreby Defense Logistics Agency, Air Force, U.S. Coast Guard, NASA, and others Signed by year:2000: $0; 2001: $0; 2002: $0; 2003: $0; 2004: $16,374; 2005: $1,253,479; 2006: $1,508,216.
Biggest contracts:
$334,036 with Defense Logistics Agency for Aircraft Air Conditioning, Heating, and Pressurizing Equipment. Signed on 2005-09-15. Completion date: 2006-05-13.
$192,395, same as above.Signed on 2005-02-09. Completion date: 2006-01-05.
$181,350 with Air Force for Aircraft Air Conditioning, Heating, and Pressurizing Equipment. Signed on 2005-03-30. Completion date: 2006-03-31.
$148,351 with Defense Logistics Agency for Aircraft Air Conditioning, Heating, and Pressurizing Equipment. Signed on 2006-05-10. Completion date: 2007-02-14.
THE ELECTROSYNTHESIS CO INC (72 WARD RD; small business)
$99,000 with Army for Other Defense -- Applied Research and Exploratory Development (R&D). Signed on 2000-10-27. Completion date: 2001-06-30.
RYAN, WILLIAM (4391 WALDEN AVE; small business)
$60,171 with Air Force for Valves, Nonpowered. Signed on 2004-08-27. Completion date: 2004-09-30.
APPLE RUBBER PRODUCTS INC (310 ERIE ST; small business) : $46,060 in 2 contractsin 2005
$33,700 with Army for Packing and Gasket Materials. Signed on 2005-03-26. Completion date: 2005-06-24.
$12,360 with Navy for Miscellaneous Electric Power and Distribution Equipment. Taking place in WI. Signed on 2005-09-12. Completion date: 2005-12-30.
STANTEC CONSULTING SERVICES IN (140 ROTECH DR; small business) : $32,992 in 2 contractsfrom 2001 to 2005
$33,000 with U.S. Army Corps of Engineers - civil program financing only for Marine and Oceanographic -- Basic Research (R&D). Signed on 2001-05-31. Completion date: 2001-09-30.
-$8 with Army for Other Research and Development -- Applied Research and Exploratory Development (R&D). Taking place in MS. Signed on 2005-08-25. Completion date: 2000-10-06.
PLANET INSTRUMENTS INC (17 MATTHEWS DR; small business) : $18,370 in 2 contractsfrom 2004 to 2005
$13,420 with Army for Physical Properties Testing and Inspection. Signed on 2005-04-05. Completion date: 2005-05-20.
$4,950 with Army for Electronic Modules. Taking place in PA. Signed on 2004-02-27. Completion date: 2004-03-12.
SIMREX CORPORATION (5490 BROADWAY; small business)
$4,924 with Army for Radio and Television Communication Equipment, Except Airborne. Taking place in AZ. Signed on 2002-03-28. Completion date: 2002-04-30.
ENGINEERED LIFTING TECHNOLOGIE (100 W DRULLARD AVE; small business)
$4,516 with Air Force for Industrial Assembly Machines. Taking place in MO. Signed on 2006-01-12. Completion date: 2006-02-09.
LANCASTER STEEL SERVICE, INC (3915 WALDEN AVE; small business)
$3,789 with Army for Pipe, Tube and Rigid Tubing. Signed on 2004-04-19. Completion date: 2004-04-28.
Top industries in this zip code by the number of employees in 2005:
2002 - 2018 National Fire Incident Reporting System (NFIRS) incidents
Based on the data from the years 2002 - 2018 the average number of fire incidents per year is 50. The highest number of fire incidents - 108 took place in 2004, and the least - 15 in 2011. The data has a declining trend.
When looking into fire subcategories, the most incidents belonged to: Structure Fires (50.0%), and Outside Fires (32.0%).
Fire incident types reported to NFIRS in Zip Code 14086


 Nearest zip codes: 14026, 14043, 14031, 14059, 14102, 14227.


 Based on the data from the years 2002 - 2018 the average number of fire incidents per year is 50. The highest number of fire incidents - 108 took place in 2004, and the least - 15 in 2011. The data has a declining trend.
 When looking into fire subcategories, the most incidents belonged to: Structure Fires (50.0%), and Outside Fires (32.0%).