Estimated zip code population in 2022: 10,216 Zip code population in 2010: 9,105 Zip code population in 2000: 8,738
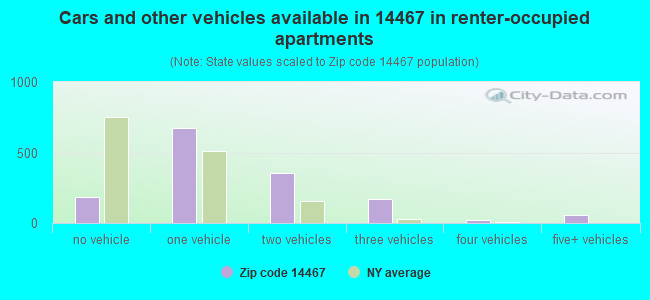
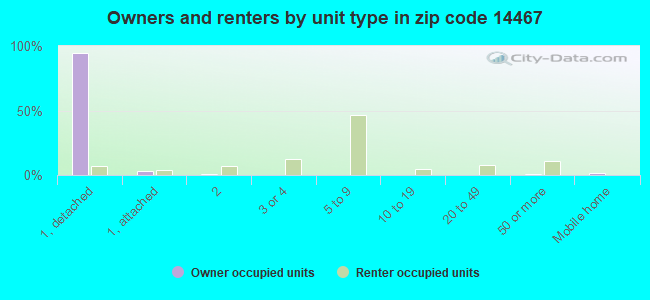
Houses and condos: 4,569 Renter-occupied apartments: 1,472
% of renters here:
33%
State:
46%
March 2022 cost of living index in zip code 14467: 102.3 (near average, U.S. average is 100)
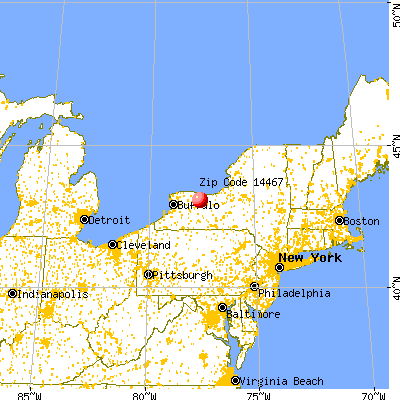
Land area: 10.8 sq. mi. Water area: 0.3 sq. mi.
Population density: 948 people per square mile
(low).
OSM Map
General Map
Google Map
MSN Map
OSM Map
General Map
Google Map
MSN Map
OSM Map
General Map
Google Map
MSN Map
OSM Map
General Map
Google Map
MSN Map
Please wait while loading the map...
Real estate property taxes paid for housing units in 2022:
This zip code:
2.1% ($4,417)
New York:
1.5% ($6,180)
Median real estate property taxes paid for housing units with mortgages in 2022: $4,451 (2.1%) Median real estate property taxes paid for housing units with no mortgage in 2022: $4,378 (2.2%)
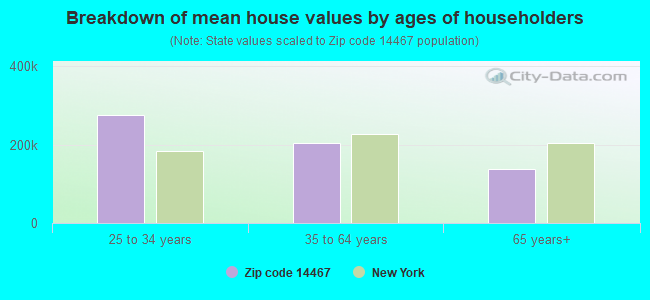
Estimated median house/condo value in 2022: $206,924
14467:
$206,924
New York:
$400,400
According to our research of New York and other state lists, there were 5 registered sex offenders living in 14467 zip code as of April 27, 2024. The ratio of all residents to sex offenders in zip code 14467 is 2,187 to 1. The ratio of registered sex offenders to all residents in this zip code is lower than the state average.
Median resident age:
This zip code:
45.4 years
New York median age:
40.0 years
Average household size:
This zip code:
2.2 people
New York:
2.5 people
Averages for the 2020 tax year for zip code 14467, filed in 2021:
Average Adjusted Gross Income (AGI) in 2020: $61,779 (Individual Income Tax Returns)
Here:
$61,779
State:
$90,930
Salary/wage: $53,978 (reported on 79.7% of returns)
Here:
$53,978
State:
$72,104
(% of AGI for various income ranges: 1028.5% for AGIs below $25k, 3329.4% for AGIs $25k-50k, 5840.2% for AGIs $50k-75k, 8621.0% for AGIs $75k-100k, 17344.3% for AGIs $100k-200k, 59735.0% for AGIs over 200k)
Taxable interest for individuals: $836 (reported on 46.2% of returns)
This zip code:
$836
New York:
$3,075
(% of AGI for various income ranges: 16.9% for AGIs below $25k, 32.9% for AGIs $25k-50k, 35.7% for AGIs $50k-75k, 74.2% for AGIs $75k-100k, 118.4% for AGIs $100k-200k, 970.0% for AGIs over 200k)
Ordinary dividends: $3,498 (reported on 24.1% of returns)
Here:
$3,498
State:
$11,095
(% of AGI for various income ranges: 39.0% for AGIs below $25k, 45.7% for AGIs $25k-50k, 74.3% for AGIs $50k-75k, 152.2% for AGIs $75k-100k, 307.5% for AGIs $100k-200k, 2325.0% for AGIs over 200k)
Net capital gain/loss in AGI: +$6,248 (reported on 19.7% of returns)
Here:
+$6,248
State:
+$44,925
(% of AGI for various income ranges: 11.6% for AGIs below $25k, 34.5% for AGIs $25k-50k, 79.8% for AGIs $50k-75k, 163.5% for AGIs $75k-100k, 429.5% for AGIs $100k-200k, 6672.5% for AGIs over 200k)
Profit/loss from business: +$12,130 (reported on 12.2% of returns)
Here:
+$12,130
State:
+$14,940
(% of AGI for various income ranges: 60.3% for AGIs below $25k, 120.6% for AGIs $25k-50k, 145.6% for AGIs $50k-75k, 197.2% for AGIs $75k-100k, 391.8% for AGIs $100k-200k, 5295.0% for AGIs over 200k)
Taxable individual retirement arrangement distribution: $18,578 (reported on 13.5% of returns)
14467:
$18,578
New York:
$19,609
(% of AGI for various income ranges: 105.6% for AGIs below $25k, 162.5% for AGIs $25k-50k, 375.4% for AGIs $50k-75k, 490.0% for AGIs $75k-100k, 926.4% for AGIs $100k-200k, 3705.0% for AGIs over 200k)
Total itemized deductions: $24,596 (reported on 5.0% of returns)
Here:
$24,596
State:
$39,326
(% of AGI for various income ranges: 65.1% for AGIs $25k-50k, 236.3% for AGIs $50k-75k, 327.0% for AGIs $75k-100k, 428.2% for AGIs $100k-200k, 2025.0% for AGIs over 200k)
Charity contributions: $7,947 (reported on 3.8% of returns)
Here:
$7,947
State:
$15,420
(% of AGI for various income ranges: 8.9% for AGIs below $25k, 31.9% for AGIs $50k-75k, 64.2% for AGIs $75k-100k, 134.5% for AGIs $100k-200k, 917.5% for AGIs over 200k)
Taxes paid: $8,288 (reported on 4.8% of returns)
14467:
$8,288
State:
$9,183
(% of AGI for various income ranges: 17.0% for AGIs $25k-50k, 64.4% for AGIs $50k-75k, 138.2% for AGIs $75k-100k, 137.5% for AGIs $100k-200k, 632.5% for AGIs over 200k)
Earned income credit: $2,298 (reported on 11.8% of returns)
Here:
$2,298
State:
$2,138
(% of AGI for various income ranges: 72.1% for AGIs below $25k, 59.3% for AGIs $25k-50k)
Percentage of individuals using paid preparers for their 2020 taxes: 95.2%
Here:
95%
State:
95%
(% for various income ranges: 94.4% for AGIs below $25k, 95.3% for AGIs $25k-50k, 95.3% for AGIs $50k-75k, 96.5% for AGIs $75k-100k, 96.1% for AGIs $100k-200k, 92.3% for AGIs over 200k)
Averages for the 2012 tax year for zip code 14467, filed in 2013:
Average Adjusted Gross Income (AGI) in 2012: $53,039 (Individual Income Tax Returns)
Here:
$53,039
State:
$77,088
Salary/wage: $46,574 (reported on 84.4% of returns)
Here:
$46,574
State:
$60,593
(% of AGI for various income ranges: 73.0% for AGIs below $25k, 76.5% for AGIs $25k-50k, 77.6% for AGIs $50k-75k, 76.6% for AGIs $75k-100k, 77.5% for AGIs $100k-200k, 54.5% for AGIs over 200k)
Taxable interest for individuals: $619 (reported on 47.5% of returns)
This zip code:
$619
New York:
$3,125
(% of AGI for various income ranges: 0.9% for AGIs below $25k, 0.5% for AGIs $25k-50k, 0.5% for AGIs $50k-75k, 0.4% for AGIs $75k-100k, 0.5% for AGIs $100k-200k, 0.6% for AGIs over 200k)
Ordinary dividends: $2,470 (reported on 24.6% of returns)
Here:
$2,470
State:
$10,299
(% of AGI for various income ranges: 1.5% for AGIs below $25k, 1.2% for AGIs $25k-50k, 0.7% for AGIs $50k-75k, 1.0% for AGIs $75k-100k, 1.1% for AGIs $100k-200k, 1.7% for AGIs over 200k)
Net capital gain/loss in AGI: +$3,678 (reported on 16.5% of returns)
Here:
+$3,678
State:
+$42,474
(% of AGI for various income ranges: 0.3% for AGIs $25k-50k, 0.6% for AGIs $50k-75k, 0.6% for AGIs $75k-100k, 1.1% for AGIs $100k-200k, 4.8% for AGIs over 200k)
Profit/loss from business: +$8,172 (reported on 11.0% of returns)
Here:
+$8,172
State:
+$16,168
(% of AGI for various income ranges: 3.8% for AGIs below $25k, 2.1% for AGIs $25k-50k, 1.2% for AGIs $50k-75k, 1.6% for AGIs $75k-100k, 2.0% for AGIs $100k-200k)
Taxable individual retirement arrangement distribution: $12,741 (reported on 14.4% of returns)
14467:
$12,741
New York:
$17,621
(% of AGI for various income ranges: 4.9% for AGIs below $25k, 3.7% for AGIs $25k-50k, 3.5% for AGIs $50k-75k, 3.7% for AGIs $75k-100k, 4.2% for AGIs $100k-200k)
Self-employment retirement plans: $11,000 (reported on 0.6% of returns)
14467:
$11,000
New York:
$27,330
Total itemized deductions: $19,248 (20% of AGI, reported on 34.0% of returns)
Here:
$19,248
State:
$34,985
Here:
20.4% of AGI
State:
21.3% of AGI
(% of AGI for various income ranges: 8.7% for AGIs below $25k, 8.8% for AGIs $25k-50k, 11.8% for AGIs $50k-75k, 13.1% for AGIs $75k-100k, 13.6% for AGIs $100k-200k, 16.1% for AGIs over 200k)
Charity contributions: $2,799 (reported on 28.7% of returns)
Here:
$2,799
State:
$5,572
(% of AGI for various income ranges: 0.6% for AGIs below $25k, 1.0% for AGIs $25k-50k, 1.4% for AGIs $50k-75k, 1.6% for AGIs $75k-100k, 1.7% for AGIs $100k-200k, 2.3% for AGIs over 200k)
Taxes paid: $9,233 (reported on 33.8% of returns)
14467:
$9,233
State:
$18,656
(% of AGI for various income ranges: 1.8% for AGIs below $25k, 3.1% for AGIs $25k-50k, 5.3% for AGIs $50k-75k, 6.1% for AGIs $75k-100k, 7.6% for AGIs $100k-200k, 8.8% for AGIs over 200k)
Earned income credit: $2,077 (reported on 13.3% of returns)
Here:
$2,077
State:
$2,230
(% of AGI for various income ranges: 4.7% for AGIs below $25k, 0.8% for AGIs $25k-50k)
Percentage of individuals using paid preparers for their 2012 taxes: 47.3%
Here:
47%
State:
66%
(% for various income ranges: 40.9% for AGIs below $25k, 46.9% for AGIs $25k-50k, 52.0% for AGIs $50k-75k, 51.9% for AGIs $75k-100k, 53.6% for AGIs $100k-200k, 75.0% for AGIs over 200k)
Averages for the 2004 tax year for zip code 14467, filed in 2005:
Average Adjusted Gross Income (AGI) in 2004: $45,186 (Individual Income Tax Returns)
Here:
$45,186
State:
$59,519
Salary/wage: $41,652 (reported on 86.8% of returns)
Here:
$41,652
State:
$50,673
(% of AGI for various income ranges: 86.5% for AGIs below $10k, 70.0% for AGIs $10k-25k, 81.2% for AGIs $25k-50k, 82.3% for AGIs $50k-75k, 83.2% for AGIs $75k-100k, 76.9% for AGIs over 100k)
Taxable interest for individuals: $618 (reported on 60.7% of returns)
This zip code:
$618
New York:
$2,377
(% of AGI for various income ranges: 2.6% for AGIs below $10k, 1.5% for AGIs $10k-25k, 1.0% for AGIs $25k-50k, 0.5% for AGIs $50k-75k, 0.7% for AGIs $75k-100k, 0.7% for AGIs over 100k)
Taxable dividends: $1,289 (reported on 31.1% of returns)
Here:
$1,289
State:
$5,394
(% of AGI for various income ranges: 3.3% for AGIs below $10k, 1.4% for AGIs $10k-25k, 0.7% for AGIs $25k-50k, 0.6% for AGIs $50k-75k, 0.8% for AGIs $75k-100k, 1.0% for AGIs over 100k)
Net capital gain/loss: +$2,225 (reported on 20.5% of returns)
Here:
+$2,225
State:
+$23,581
(% of AGI for various income ranges: -1.3% for AGIs below $10k, -0.2% for AGIs $10k-25k, 0.6% for AGIs $25k-50k, 0.3% for AGIs $50k-75k, 1.1% for AGIs $75k-100k, 2.4% for AGIs over 100k)
Profit/loss from business: +$6,855 (reported on 12.1% of returns)
Here:
+$6,855
State:
+$13,809
(% of AGI for various income ranges: 3.0% for AGIs below $10k, 5.4% for AGIs $10k-25k, 2.4% for AGIs $25k-50k, 1.5% for AGIs $50k-75k, 1.4% for AGIs $75k-100k, 0.9% for AGIs over 100k)
IRA payment deduction: $2,817 (reported on 2.5% of returns)
14467:
$2,817
New York:
$3,115
(% of AGI for various income ranges: 0.3% for AGIs $10k-25k, 0.3% for AGIs $25k-50k, 0.2% for AGIs $50k-75k, 0.1% for AGIs $75k-100k, 0.1% for AGIs over 100k)
Self-employed pension: $9,500 (reported on 0.7% of returns)
Here:
$9,500
New York:
$19,016
Total itemized deductions: $15,910 (21% of AGI, reported on 40.0% of returns)
Here:
$15,910
State:
$25,864
Here:
21.1% of AGI
State:
21.9% of AGI
(% of AGI for various income ranges: 6.6% for AGIs below $10k, 8.7% for AGIs $10k-25k, 11.2% for AGIs $25k-50k, 14.8% for AGIs $50k-75k, 15.8% for AGIs $75k-100k, 16.3% for AGIs over 100k)
Charity contributions deductions: $2,796 (4% of AGI, reported on 37.3% of returns)
Here:
$2,796
State:
$4,439
Here:
3.6% of AGI
State:
3.6% of AGI
(% of AGI for various income ranges: 0.6% for AGIs below $10k, 1.1% for AGIs $10k-25k, 1.6% for AGIs $25k-50k, 2.0% for AGIs $50k-75k, 2.4% for AGIs $75k-100k, 3.5% for AGIs over 100k)
Total tax: $5,755 (reported on 78.6% of returns)
14467:
$5,755
State:
$11,730
(% of AGI for various income ranges: 1.8% for AGIs below $10k, 4.1% for AGIs $10k-25k, 7.2% for AGIs $25k-50k, 9.0% for AGIs $50k-75k, 10.0% for AGIs $75k-100k, 15.4% for AGIs over 100k)
Earned income credit: $1,579 (reported on 10.9% of returns)
Here:
$1,579
State:
$1,757
Percentage of individuals using paid preparers for their 2004 taxes: 53.5%
Here:
53%
State:
67%
(% for various income ranges: 42.8% for AGIs below $10k, 54.1% for AGIs $10k-25k, 56.4% for AGIs $25k-50k, 55.8% for AGIs $50k-75k, 60.8% for AGIs $75k-100k, 53.8% for AGIs over 100k)
Likely homosexual households (counted as self-reported same-sex unmarried-partner households)
Lesbian couples: 0.3% of all households
Gay men: 0.5% of all households
Household received Food Stamps/SNAP in the past 12 months: 480 Household did not receive Food Stamps/SNAP in the past 12 months: 3,991
Women who had a birth in the past 12 months: 126 (124 now married, 0 unmarried) Women who did not have a birth in the past 12 months: 2,034 (928 now married, 1,096 unmarried)
Housing units in zip code 14467 with a mortgage: 1,728 (162 second mortgage, 148 both second mortgage and home equity loan) Houses without a mortgage: 146
Median monthly owner costs for units with a mortgage: $1,495 Median monthly owner costs for units without a mortgage: $641
Residents with income below the poverty level in 2022:
This zip code:
6.0%
Whole state:
14.3%
Residents with income below 50% of the poverty level in 2022:
This zip code:
3.8%
Whole state:
6.8%
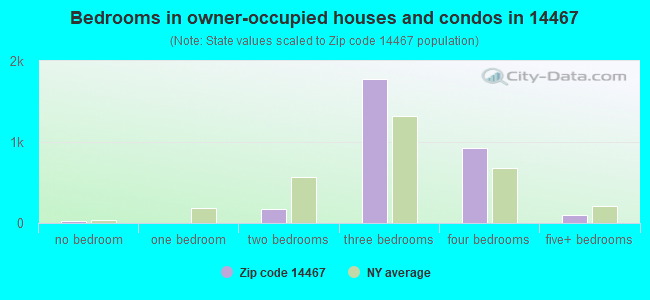
Median number of rooms in houses and condos:
Here:
6.9
State:
6.3
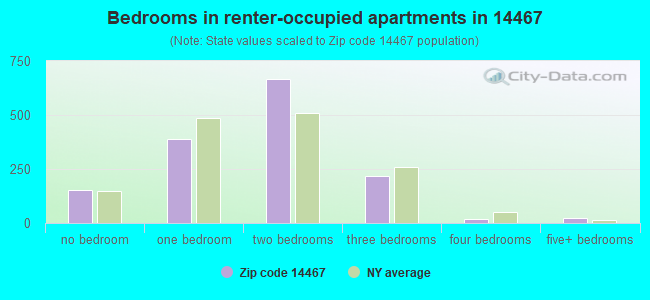
Median number of rooms in apartments:
Here:
3.8
State:
3.8
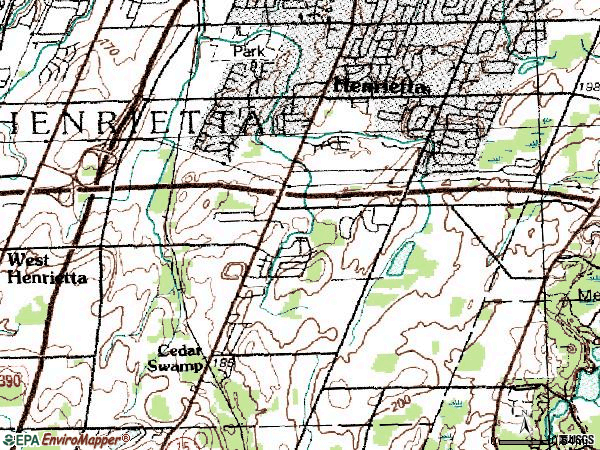
Notable locations in this zip code not listed on our city pages
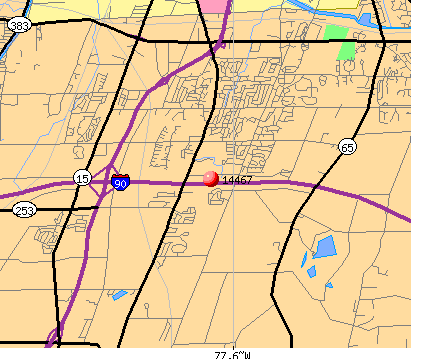
Notable locations in zip code 14467: Henrietta Station (A), Executive South Family Golf Center (B), Matthews Farms (C), Barker Farms (D), Henrietta Toll Plaza (E), Summit Point Business Centre (F), Brentland Woods Adult Care Facility (G), Henrietta Senior Center (H), Henrietta Public Library (I), Henrietta Town Hall (J). Display/hide their locations on the map
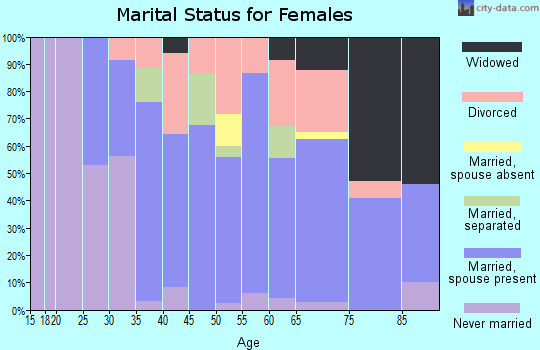
1,349 married couples with children.
598 single-parent households (285 men, 313 women).
88.5% of residents of 14467 zip code speak English at home.
0.8% of residents speak Spanish at home (71% very well, 29% well).
5.5% of residents speak other Indo-European language at home (74% very well, 13% well, 12% not well).
3.2% of residents speak Asian or Pacific Island language at home (59% very well, 20% well, 21% not well).
2.1% of residents speak other language at home (77% very well, 23% well).
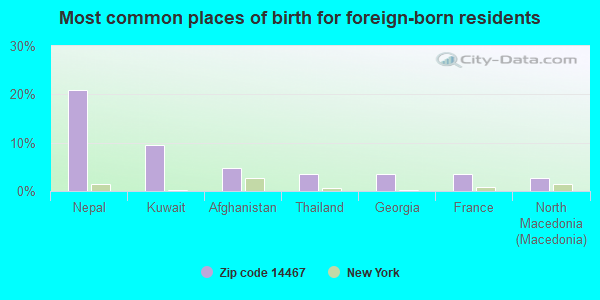
Foreign born population: 1,139 (11.2%) (87.5% of them are naturalized citizens)
This zip code:
11.2%
Whole state:
22.7%
21%Nepal
10%Kuwait
5%Afghanistan
4%Thailand
4%Georgia
3%France
3%North Macedonia (Macedonia)
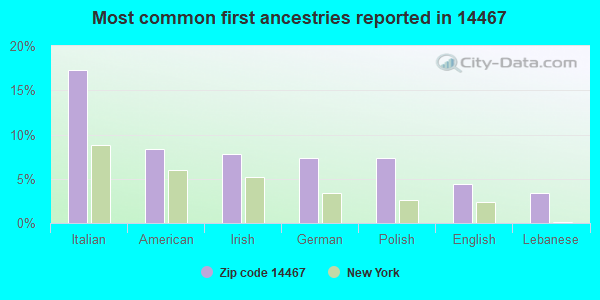
17%Italian
8%American
8%Irish
7%German
7%Polish
4%English
3%Lebanese
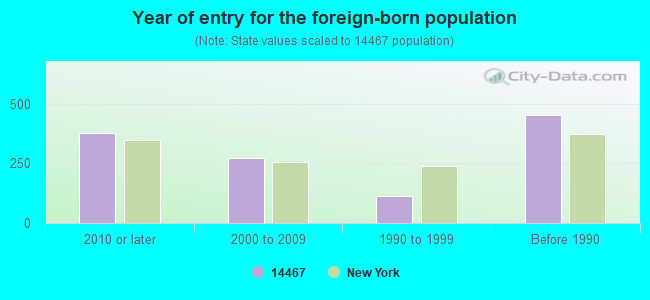
Year of entry for the foreign-born population
3782010 or later
2722000 to 2009
1141990 to 1999
453Before 1990
Major facilities with environmental interests located in this zip code:
ANGIOTECH BIOCOATINGS CORPORATION (336 SUMMIT POINT DR in HENRIETTA, NY)
STATE MASTER (New York facility tracking) - AIR PROGRAM, HAZARDOUS WASTE PROGRAM Small Quantity Generators, between 100 kg and 1000 kg of hazardous waste/month (Resource Conservation and Recovery Act (tracking hazardous waste)) - notification Business SIC classification: MEDICAL LABORATORIES Organizations: GALLNA DEVELOPMENT CORP (CONTACT/OWNER)
, STS DUOTEK INC (LEGALLY RESPONSIBLE PARTY)
, STS BIOPOLYMERS INC (LEGALLY RESPONSIBLE PARTY)
Alternative names: S T S BIOPOLYMERS INC
HENRIETTA GENERAL SERVICE GARAGE (475 CALKINS RD in HENRIETTA, NY)
(Integrated Compliance Information System) - ICIS-02-1999-7915, FORMAL ENFORCEMENT ACTION (Resource Conservation and Recovery Act (tracking hazardous waste)) Business SIC classification: FIXED FACILITIES AND INSPECTION AND WEIGHING SERVICES FOR MOTOR VEHICLE TRANSPORTATION
7-ELEVEN 24809 (3995 W HENRIETTA RD in HENRIETTA, NY)
(Resource Conservation and Recovery Act (tracking hazardous waste))
GYPSUM SERVICES (1229 LEHIGH STATION RD in HENRIETTA, NY)
(Resource Conservation and Recovery Act (tracking hazardous waste))
HENRIETTA FIRE DISTRICT (230 PINNACLE RD in HENRIETTA, NY)
(Resource Conservation and Recovery Act (tracking hazardous waste))
HENRIETTA FIRE DISTRICT (50 COMMERCE DR in HENRIETTA, NY)
(Resource Conservation and Recovery Act (tracking hazardous waste))
HOME DEPOT USA INC HD1246 (770 JEFFERSON RD in HENRIETTA, NY)
Conditionally Exempt Small Quantity Generators, less than 100 kg/month of hazardous waste (Resource Conservation and Recovery Act (tracking hazardous waste)) - notification Alternative names: HOME DEPOT THE 1246
HYDROACOUSTICS INC (999 LEHIGH STATION RD in HENRIETTA, NY)
(Resource Conservation and Recovery Act (tracking hazardous waste))
CONIFER RIVERTON ASSOCIATES (W HENRIETTA SCOTTSVILLE RD in HENRIETTA, NY)
(Resource Conservation and Recovery Act (tracking hazardous waste))
COPY WORLD OF ROCHESTER (395 SUMMITT POINT DR #5C in HENRIETTA, NY)
(Resource Conservation and Recovery Act (tracking hazardous waste))
BESTWAY ENVIRONMENTAL SERVICE (1233 LEHIGH STATION RD in HENRIETTA, NY)
(Resource Conservation and Recovery Act (tracking hazardous waste))
GRAND EAGLE SERVICES (370 SUMMIT POINT DR SUITE 1B in HENRIETTA, NY)
Conditionally Exempt Small Quantity Generators, less than 100 kg/month of hazardous waste (Resource Conservation and Recovery Act (tracking hazardous waste)) - notification Organizations: UNKNOWN (CONTACT/OWNER)
CHURCH OF THE GOOD SHEPHERD (3318 E HENRIETTA RD in HENRIETTA, NY)
Conditionally Exempt Small Quantity Generators, less than 100 kg/month of hazardous waste (Resource Conservation and Recovery Act (tracking hazardous waste)) - notification
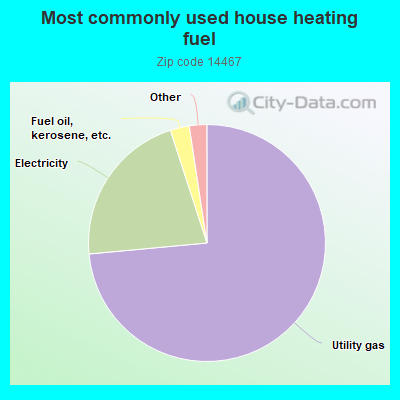
73.6%Utility gas
21.5%Electricity
2.6%Fuel oil, kerosene, etc.
0.8%Bottled, tank, or LP gas
0.7%Other fuel
0.5%No fuel used
Population in 1990: 8,450. Population change in the 1990s: +288 (+3.4%).
Place of birth for U.S.-born residents:
This state: 7,560
Northeast: 485
Midwest: 338
South: 332
West: 288
66% of the 14467 zip code residents lived in the same house 5 years ago. Out of people who lived in different houses, 74% lived in this county. Out of people who lived in different counties, 50% lived in New York.
93% of the 14467 zip code residents lived in the same house 1 year ago. Out of people who lived in different houses, 52% moved from this county. Out of people who lived in different houses, 16% moved from different county within same state. Out of people who lived in different houses, 25% moved from different state. Out of people who lived in different houses, 8% moved from abroad.
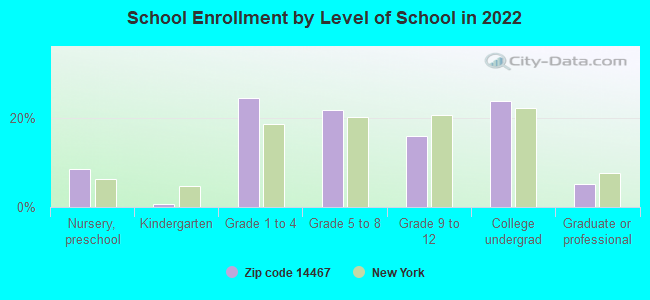
Private vs. public school enrollment:
Students in private schools in grades 1 to 8 (elementary and middle school): 79
Here:
7.9%
New York:
15.6%
Students in private schools in grades 9 to 12 (high school):
Here:
0.0%
New York:
15.0%
Students in private undergraduate colleges: 143
Here:
28.2%
New York:
39.2%
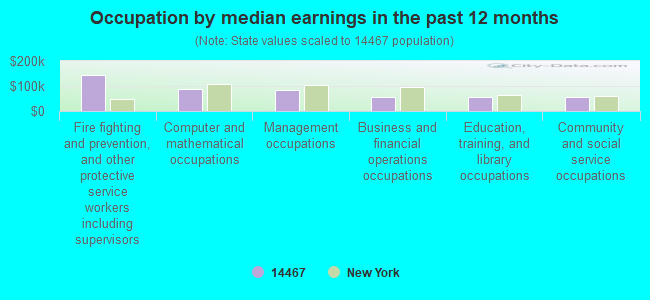
Occupation by median earnings in the past 12 months ($)
144,171Fire fighting and prevention, and other protective service workers including supervisors
86,483Computer and mathematical occupations
85,043Management occupations
56,997Business and financial operations occupations
56,155Education, training, and library occupations
56,054Community and social service occupations
Companies with federal contracts located in this zip code:
HYDROACOUSTICS INC (999 LEHIGH STATION RD in HENRIETTA, NY; small business) : $9,686,728 in 47 contractsfrom 1999 to 2006
Contracts for Other Defense -- Advanced Development (R&D), Cable, Cord, and Wire Assemblies: Communications Equipment, Miscellaneous Communication Equipment, Miscellaneous Electrical and Electronic Components, and moreby Navy Signed by year:2000: $228,871; 2001: $2,662,818; 2002: $1,250,997; 2003: $644,518; 2004: $2,674,942; 2005: $1,964,694; 2006: $201,574.
Biggest contracts:
$1,500,000 with Navy for Other Defense -- Advanced Development (R&D). Signed on 2001-07-30. Completion date: 2002-09-30.
$1,041,161 with Navy for Cable, Cord, and Wire Assemblies: Communications Equipment. Signed on 2004-09-07. Completion date: 2005-08-07.
$959,223 with Navy for Other Defense -- Advanced Development (R&D). Signed on 2004-01-13. Completion date: 2004-01-15.
$854,000, same as above.Signed on 2001-09-26. Completion date: 2002-09-30.
DECSOURCE INC (235 MIDDLE ROAD in HENRIETTA, NY; small business) : $292,700 in 4 contractsfrom 1999 to 2003
$149,120 with Department of Defense for ADPE System Configuration. Signed on 2002-06-27. Completion date: 2002-07-12.
$105,460 with Department of Defense for Mini and Micro Computer Control Devices. Taking place in IN. Signed on 2003-08-04. Completion date: 2003-08-08.
$32,000 with U.S. Secret Service (disused code: now 7009) for ADP Components. Signed on 1999-12-15. Completion date: 2000-01-15.
$6,120 with Navy for ADPE System Configuration. Taking place in CA. Signed on 2002-11-15. Completion date: 2002-12-15.
THYSSENKRUPP ELEVATOR CORPORAT (245 SUMMIT POINT DRIVE in HENRIETTA, NY; small business) : $10,068 in 3 contractsfrom 2004 to 2005
$3,684 with U.S. Army Corps of Engineers - civil program financing only for Maintenance, Repair and Rebuilding of Equipment -- Special Industry Machinery. Taking place in PA. Signed on 2004-12-03. Completion date: 2005-09-30.
$3,684 with Army for Maintenance, Repair and Rebuilding of Equipment -- Special Industry Machinery. Taking place in PA. Signed on 2004-12-03. Completion date: 2005-09-30.
$2,700 with Army for Maintenance, Repair and Rebuilding of Equipment -- Mechanical Power Transmission Equipment. Taking place in PA. Signed on 2005-11-09. Completion date: 2006-09-30.
Top industries in this zip code by the number of employees in 2005:
Administrative and Support and Waste Management and Remediation Services: Telemarketing Bureaus (500-999 employees: 1 establishment)
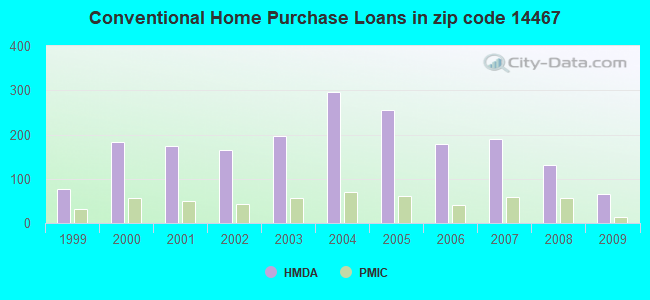
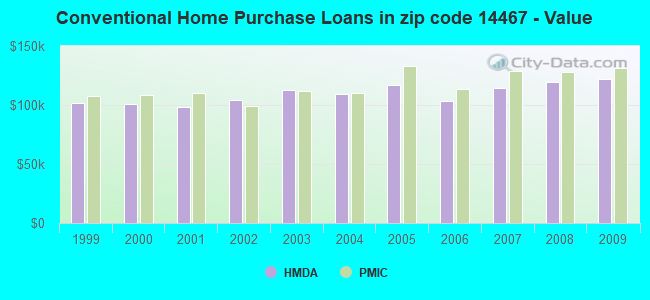
Detailed PMIC statistics for the following Tracts:0132.03
, 0132.04
2005 - 2018 National Fire Incident Reporting System (NFIRS) incidents
Based on the data from the years 2005 - 2018 the average number of fires per year is 23. The highest number of fires - 45 took place in 2016, and the least - 0 in 2009. The data has an increasing trend.
When looking into fire subcategories, the most incidents belonged to: Structure Fires (32.8%), and Outside Fires (29.1%).
Fire incident types reported to NFIRS in Zip Code 14467


 Nearest zip codes: 14623, 14586, 14472, 14543, 14620, 14534.


 Based on the data from the years 2005 - 2018 the average number of fires per year is 23. The highest number of fires - 45 took place in 2016, and the least - 0 in 2009. The data has an increasing trend.
 When looking into fire subcategories, the most incidents belonged to: Structure Fires (32.8%), and Outside Fires (29.1%).