Estimated zip code population in 2022: 33,375 Zip code population in 2010: 31,426 Zip code population in 2000: 30,270
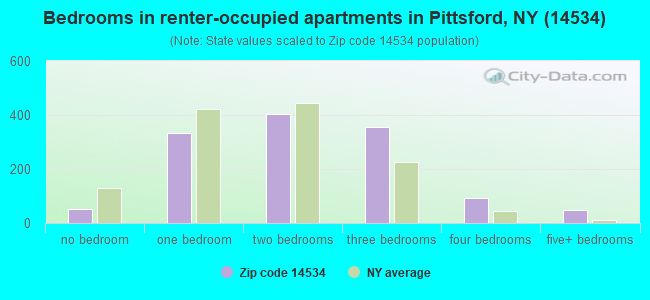
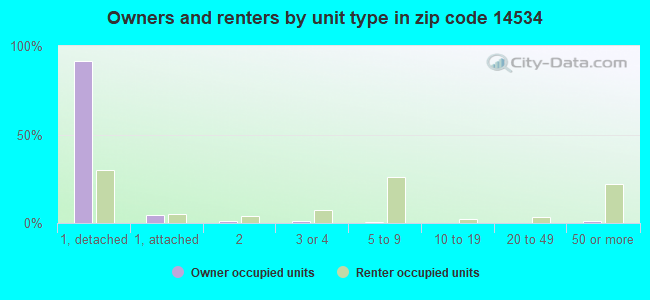
Houses and condos: 12,918 Renter-occupied apartments: 1,295
% of renters here:
10%
State:
46%
March 2022 cost of living index in zip code 14534: 103.7 (near average, U.S. average is 100)
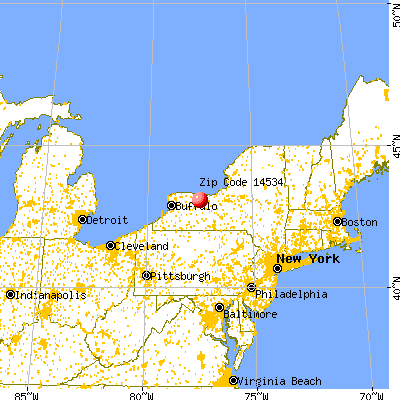
Land area: 32.3 sq. mi. Water area: 0.3 sq. mi.
Population density: 1,032 people per square mile
(low).
OSM Map
General Map
Google Map
MSN Map
OSM Map
General Map
Google Map
MSN Map
OSM Map
General Map
Google Map
MSN Map
OSM Map
General Map
Google Map
MSN Map
Please wait while loading the map...
Real estate property taxes paid for housing units in 2022:
This zip code:
2.6% ($8,325)
New York:
1.5% ($6,180)
Median real estate property taxes paid for housing units with mortgages in 2022: $8,609 (2.5%) Median real estate property taxes paid for housing units with no mortgage in 2022: $7,999 (2.6%)
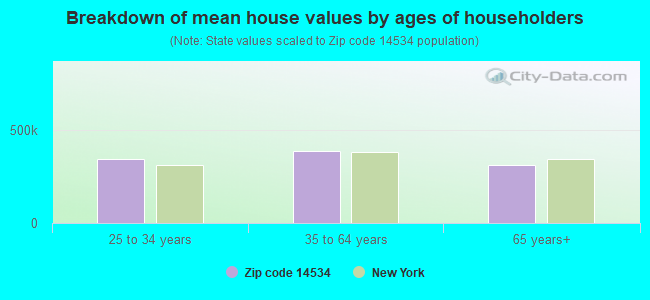
Estimated median house/condo value in 2022: $322,426
14534:
$322,426
New York:
$400,400
According to our research of New York and other state lists, there were 3 registered sex offenders living in 14534 zip code as of April 27, 2024. The ratio of all residents to sex offenders in zip code 14534 is 10,885 to 1. The ratio of registered sex offenders to all residents in this zip code is much lower than the state average.
Median resident age:
This zip code:
47.6 years
New York median age:
40.0 years
Average household size:
This zip code:
2.6 people
New York:
2.5 people
Averages for the 2020 tax year for zip code 14534, filed in 2021:
Average Adjusted Gross Income (AGI) in 2020: $164,301 (Individual Income Tax Returns)
Here:
$164,301
State:
$90,930
Salary/wage: $128,424 (reported on 75.5% of returns)
Here:
$128,424
State:
$72,104
(% of AGI for various income ranges: 1072.7% for AGIs below $25k, 3223.4% for AGIs $25k-50k, 5670.2% for AGIs $50k-75k, 8373.6% for AGIs $75k-100k, 18051.7% for AGIs $100k-200k, 101506.6% for AGIs over 200k)
Taxable interest for individuals: $2,522 (reported on 67.0% of returns)
This zip code:
$2,522
New York:
$3,075
(% of AGI for various income ranges: 31.8% for AGIs below $25k, 65.8% for AGIs $25k-50k, 104.1% for AGIs $50k-75k, 170.0% for AGIs $75k-100k, 267.5% for AGIs $100k-200k, 1799.1% for AGIs over 200k)
Ordinary dividends: $13,661 (reported on 50.3% of returns)
Here:
$13,661
State:
$11,095
(% of AGI for various income ranges: 117.4% for AGIs below $25k, 222.9% for AGIs $25k-50k, 362.7% for AGIs $50k-75k, 584.1% for AGIs $75k-100k, 1107.8% for AGIs $100k-200k, 7523.8% for AGIs over 200k)
Net capital gain/loss in AGI: +$35,516 (reported on 45.3% of returns)
Here:
+$35,516
State:
+$44,925
(% of AGI for various income ranges: 49.2% for AGIs below $25k, 180.3% for AGIs $25k-50k, 342.8% for AGIs $50k-75k, 475.2% for AGIs $75k-100k, 1227.5% for AGIs $100k-200k, 22825.6% for AGIs over 200k)
Profit/loss from business: +$35,302 (reported on 18.6% of returns)
Here:
+$35,302
State:
+$14,940
(% of AGI for various income ranges: 83.9% for AGIs below $25k, 271.9% for AGIs $25k-50k, 300.1% for AGIs $50k-75k, 451.1% for AGIs $75k-100k, 926.6% for AGIs $100k-200k, 7595.9% for AGIs over 200k)
Taxable individual retirement arrangement distribution: $31,269 (reported on 19.2% of returns)
14534:
$31,269
New York:
$19,609
(% of AGI for various income ranges: 111.0% for AGIs below $25k, 362.8% for AGIs $25k-50k, 669.5% for AGIs $50k-75k, 1109.5% for AGIs $75k-100k, 1889.7% for AGIs $100k-200k, 3425.7% for AGIs over 200k)
Self-employed (Keogh) retirement plans: $32,807 (reported on 3.7% of returns)
14534:
$32,807
New York:
$32,497
(% of AGI for various income ranges: 12.3% for AGIs below $25k, 28.1% for AGIs $50k-75k, 37.1% for AGIs $75k-100k, 113.2% for AGIs $100k-200k, 1673.0% for AGIs over 200k)
Total itemized deductions: $41,137 (reported on 15.6% of returns)
Here:
$41,137
State:
$39,326
(% of AGI for various income ranges: 135.3% for AGIs below $25k, 282.0% for AGIs $25k-50k, 569.0% for AGIs $50k-75k, 777.5% for AGIs $75k-100k, 1092.2% for AGIs $100k-200k, 6260.1% for AGIs over 200k)
Charity contributions: $17,945 (reported on 13.5% of returns)
Here:
$17,945
State:
$15,420
(% of AGI for various income ranges: 8.3% for AGIs below $25k, 26.8% for AGIs $25k-50k, 75.5% for AGIs $50k-75k, 115.7% for AGIs $75k-100k, 261.2% for AGIs $100k-200k, 3210.1% for AGIs over 200k)
Taxes paid: $9,276 (reported on 15.5% of returns)
14534:
$9,276
State:
$9,183
(% of AGI for various income ranges: 34.3% for AGIs below $25k, 84.5% for AGIs $25k-50k, 183.5% for AGIs $50k-75k, 270.9% for AGIs $75k-100k, 306.2% for AGIs $100k-200k, 1090.7% for AGIs over 200k)
Earned income credit: $1,600 (reported on 3.8% of returns)
Here:
$1,600
State:
$2,138
(% of AGI for various income ranges: 26.7% for AGIs below $25k, 30.6% for AGIs $25k-50k)
Percentage of individuals using paid preparers for their 2020 taxes: 95.3%
Here:
95%
State:
95%
(% for various income ranges: 93.1% for AGIs below $25k, 94.6% for AGIs $25k-50k, 94.9% for AGIs $50k-75k, 95.5% for AGIs $75k-100k, 95.9% for AGIs $100k-200k, 97.6% for AGIs over 200k)
Averages for the 2012 tax year for zip code 14534, filed in 2013:
Average Adjusted Gross Income (AGI) in 2012: $142,859 (Individual Income Tax Returns)
Here:
$142,859
State:
$77,088
Salary/wage: $104,239 (reported on 77.6% of returns)
Here:
$104,239
State:
$60,593
(% of AGI for various income ranges: 65.4% for AGIs below $25k, 62.1% for AGIs $25k-50k, 56.5% for AGIs $50k-75k, 60.9% for AGIs $75k-100k, 66.7% for AGIs $100k-200k, 51.9% for AGIs over 200k)
Taxable interest for individuals: $2,834 (reported on 68.3% of returns)
This zip code:
$2,834
New York:
$3,125
(% of AGI for various income ranges: 2.5% for AGIs below $25k, 1.8% for AGIs $25k-50k, 1.5% for AGIs $50k-75k, 1.3% for AGIs $75k-100k, 0.8% for AGIs $100k-200k, 1.5% for AGIs over 200k)
Ordinary dividends: $11,223 (reported on 51.6% of returns)
Here:
$11,223
State:
$10,299
(% of AGI for various income ranges: 7.2% for AGIs below $25k, 4.5% for AGIs $25k-50k, 4.5% for AGIs $50k-75k, 3.9% for AGIs $75k-100k, 3.4% for AGIs $100k-200k, 4.2% for AGIs over 200k)
Net capital gain/loss in AGI: +$25,202 (reported on 44.2% of returns)
Here:
+$25,202
State:
+$42,474
(% of AGI for various income ranges: 1.1% for AGIs below $25k, 1.6% for AGIs $25k-50k, 1.8% for AGIs $50k-75k, 1.5% for AGIs $75k-100k, 2.4% for AGIs $100k-200k, 11.5% for AGIs over 200k)
Profit/loss from business: +$32,659 (reported on 18.9% of returns)
Here:
+$32,659
State:
+$16,168
(% of AGI for various income ranges: 5.6% for AGIs below $25k, 4.7% for AGIs $25k-50k, 3.0% for AGIs $50k-75k, 4.1% for AGIs $75k-100k, 4.8% for AGIs $100k-200k, 4.2% for AGIs over 200k)
Taxable individual retirement arrangement distribution: $26,655 (reported on 20.8% of returns)
14534:
$26,655
New York:
$17,621
(% of AGI for various income ranges: 6.4% for AGIs below $25k, 7.3% for AGIs $25k-50k, 7.4% for AGIs $50k-75k, 7.2% for AGIs $75k-100k, 5.8% for AGIs $100k-200k, 2.3% for AGIs over 200k)
Self-employment retirement plans: $26,435 (reported on 3.9% of returns)
14534:
$26,435
New York:
$27,330
(% of AGI for various income ranges: 0.6% for AGIs $25k-50k, 0.3% for AGIs $75k-100k, 0.6% for AGIs $100k-200k, 0.9% for AGIs over 200k)
Total itemized deductions: $38,511 (18% of AGI, reported on 61.3% of returns)
Here:
$38,511
State:
$34,985
Here:
17.9% of AGI
State:
21.3% of AGI
(% of AGI for various income ranges: 22.8% for AGIs below $25k, 20.2% for AGIs $25k-50k, 19.7% for AGIs $50k-75k, 19.2% for AGIs $75k-100k, 18.2% for AGIs $100k-200k, 15.0% for AGIs over 200k)
Charity contributions: $7,131 (reported on 55.6% of returns)
Here:
$7,131
State:
$5,572
(% of AGI for various income ranges: 1.3% for AGIs below $25k, 1.9% for AGIs $25k-50k, 2.2% for AGIs $50k-75k, 2.2% for AGIs $75k-100k, 2.2% for AGIs $100k-200k, 3.2% for AGIs over 200k)
Taxes paid: $22,197 (reported on 61.1% of returns)
14534:
$22,197
State:
$18,656
(% of AGI for various income ranges: 7.2% for AGIs below $25k, 7.6% for AGIs $25k-50k, 9.1% for AGIs $50k-75k, 9.8% for AGIs $75k-100k, 10.5% for AGIs $100k-200k, 9.3% for AGIs over 200k)
Earned income credit: $1,429 (reported on 3.9% of returns)
Here:
$1,429
State:
$2,230
(% of AGI for various income ranges: 1.7% for AGIs below $25k, 0.3% for AGIs $25k-50k)
Percentage of individuals using paid preparers for their 2012 taxes: 61.1%
Here:
61%
State:
66%
(% for various income ranges: 51.0% for AGIs below $25k, 57.5% for AGIs $25k-50k, 63.3% for AGIs $50k-75k, 59.5% for AGIs $75k-100k, 61.5% for AGIs $100k-200k, 79.4% for AGIs over 200k)
Averages for the 2004 tax year for zip code 14534, filed in 2005:
Average Adjusted Gross Income (AGI) in 2004: $101,778 (Individual Income Tax Returns)
Here:
$101,778
State:
$59,519
Salary/wage: $84,893 (reported on 76.2% of returns)
Here:
$84,893
State:
$50,673
(% of AGI for various income ranges: 57.6% for AGIs $10k-25k, 58.1% for AGIs $25k-50k, 60.9% for AGIs $50k-75k, 68.6% for AGIs $75k-100k, 62.0% for AGIs over 100k)
Taxable interest for individuals: $2,592 (reported on 80.2% of returns)
This zip code:
$2,592
New York:
$2,377
(% of AGI for various income ranges: 6.1% for AGIs $10k-25k, 3.5% for AGIs $25k-50k, 2.8% for AGIs $50k-75k, 1.7% for AGIs $75k-100k, 1.6% for AGIs over 100k)
Taxable dividends: $8,352 (reported on 62.5% of returns)
Here:
$8,352
State:
$5,394
(% of AGI for various income ranges: 7.1% for AGIs $10k-25k, 5.0% for AGIs $25k-50k, 3.9% for AGIs $50k-75k, 2.9% for AGIs $75k-100k, 5.2% for AGIs over 100k)
Net capital gain/loss: +$15,436 (reported on 52.8% of returns)
Here:
+$15,436
State:
+$23,581
(% of AGI for various income ranges: 2.0% for AGIs $10k-25k, 2.3% for AGIs $25k-50k, 2.0% for AGIs $50k-75k, 2.3% for AGIs $75k-100k, 9.7% for AGIs over 100k)
Profit/loss from business: +$23,507 (reported on 18.7% of returns)
Here:
+$23,507
State:
+$13,809
(% of AGI for various income ranges: 6.6% for AGIs $10k-25k, 4.9% for AGIs $25k-50k, 4.3% for AGIs $50k-75k, 4.4% for AGIs $75k-100k, 4.1% for AGIs over 100k)
IRA payment deduction: $3,504 (reported on 3.8% of returns)
14534:
$3,504
New York:
$3,115
(% of AGI for various income ranges: 0.5% for AGIs $10k-25k, 0.5% for AGIs $25k-50k, 0.3% for AGIs $50k-75k, 0.2% for AGIs $75k-100k, 0.1% for AGIs over 100k)
Self-employed pension: $18,497 (reported on 4.6% of returns)
Here:
$18,497
New York:
$19,016
(% of AGI for various income ranges: 0.4% for AGIs $10k-25k, 0.4% for AGIs $25k-50k, 0.3% for AGIs $50k-75k, 0.5% for AGIs $75k-100k, 1.0% for AGIs over 100k)
Total itemized deductions: $30,149 (19% of AGI, reported on 60.8% of returns)
Here:
$30,149
State:
$25,864
Here:
19.2% of AGI
State:
21.9% of AGI
(% of AGI for various income ranges: 25.9% for AGIs $10k-25k, 20.9% for AGIs $25k-50k, 22.3% for AGIs $50k-75k, 21.1% for AGIs $75k-100k, 16.4% for AGIs over 100k)
Charity contributions deductions: $5,586 (3% of AGI, reported on 57.9% of returns)
Here:
$5,586
State:
$4,439
Here:
3.5% of AGI
State:
3.6% of AGI
(% of AGI for various income ranges: 2.2% for AGIs $10k-25k, 2.6% for AGIs $25k-50k, 3.1% for AGIs $50k-75k, 3.1% for AGIs $75k-100k, 3.2% for AGIs over 100k)
Total tax: $22,008 (reported on 81.7% of returns)
14534:
$22,008
State:
$11,730
(% of AGI for various income ranges: 4.7% for AGIs $10k-25k, 7.4% for AGIs $25k-50k, 8.8% for AGIs $50k-75k, 9.9% for AGIs $75k-100k, 20.2% for AGIs over 100k)
Earned income credit: $1,239 (reported on 2.6% of returns)
Here:
$1,239
State:
$1,757
Percentage of individuals using paid preparers for their 2004 taxes: 62.2%
Here:
62%
State:
67%
(% for various income ranges: 53.3% for AGIs below $10k, 57.9% for AGIs $10k-25k, 62.6% for AGIs $25k-50k, 65.0% for AGIs $50k-75k, 59.3% for AGIs $75k-100k, 69.6% for AGIs over 100k)
Likely homosexual households (counted as self-reported same-sex unmarried-partner households)
Lesbian couples: 0.2% of all households
Gay men: 0.2% of all households
Household received Food Stamps/SNAP in the past 12 months: 273 Household did not receive Food Stamps/SNAP in the past 12 months: 12,307
Women who had a birth in the past 12 months: 295 (278 now married, 13 unmarried) Women who did not have a birth in the past 12 months: 5,982 (3,361 now married, 2,563 unmarried)
Housing units in zip code 14534 with a mortgage: 6,466 (989 second mortgage, 44 home equity loan, 934 both second mortgage and home equity loan) Houses without a mortgage: 309
Median monthly owner costs for units with a mortgage: $2,234 Median monthly owner costs for units without a mortgage: $1,041
Residents with income below the poverty level in 2022:
This zip code:
2.2%
Whole state:
14.3%
Residents with income below 50% of the poverty level in 2022:
This zip code:
0.9%
Whole state:
6.8%
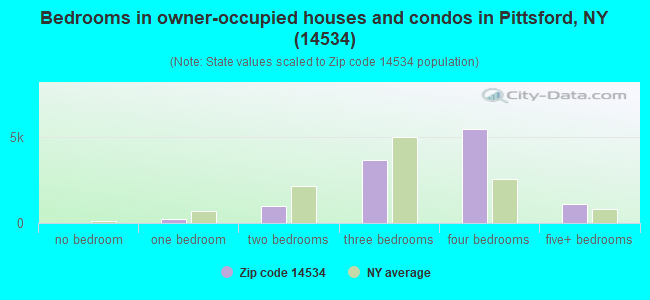
Median number of rooms in houses and condos:
Here:
7.8
State:
6.3
Median number of rooms in apartments:
Here:
4.3
State:
3.8
Notable locations in this zip code not listed on our city pages
Notable locations in zip code 14534: Cartersville Guard Gate (A), Hopkins Farm (B), Willard Farms (C), Knickerbocker Farms (D), Silco Farms (E), Pittsford Farms (F), Railroad Mills (G), Tobey Village Office Park (H), Powder Mill Office Park (I), Pittsford Village Green (J), Corporate Crossings Office Campus (K), Basin Park (L), Monroe Golf Club (M), Pittsford Town Hall (N), Pittsford Fire Department (O), Pittsford Community Library (P), Clare Bridge of Perinton (Q), Glenmere at Cloverwood (R), Heather Heights of Pittsford (S), Highlands Living Center (T). Display/hide their locations on the map
Churches in zip code 14534 include: Carmelite Monastery (A), Christ Clarion Church (B), Christ View Church (C), Saint Paul's Evangelical Lutheran Church (D), Christ Episcopal Church (E), Southside Church (F), Pinnacle Lutheran Church (G), United Church of Pittsford (H). Display/hide their locations on the map
Cemeteries: East Street Cemetery (1), Old Burying Ground (2), Pittsford Cemetery (3), White Haven Memorial Park (4), Pioneer Burying Ground (5). Display/hide their locations on the map
In group quarters: 414 (-1 institutionalized population)
Size of family households: 4,404 2-persons, 2,285 3-persons, 1,732 4-persons, 869 5-persons, 287 6-persons, 93 7-or-more-persons
Size of nonfamily households: 2,517 1-person, 459 2-persons, 46 3-persons
6,732 married couples with children.
892 single-parent households (165 men, 727 women).
87.5% of residents of 14534 zip code speak English at home.
2.2% of residents speak Spanish at home (96% very well, 4% well).
5.8% of residents speak other Indo-European language at home (84% very well, 8% well, 7% not well, 1% not at all).
3.7% of residents speak Asian or Pacific Island language at home (71% very well, 18% well, 9% not well, 3% not at all).
1.1% of residents speak other language at home (71% very well, 25% well, 3% not well, 1% not at all).
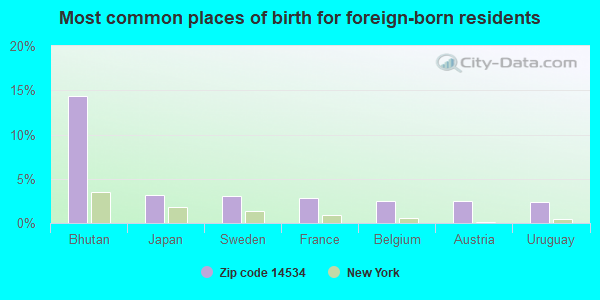
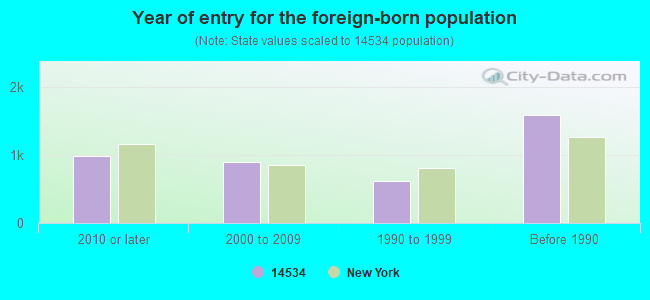
Foreign born population: 3,848 (11.5%) (75.6% of them are naturalized citizens)
Facilities with environmental interests located in this zip code:
GOLDEN HORSESHOE TRAILER PARK (2142 JEHIGH STATION RD in PITTSFORD, NY)
(Integrated Compliance Information System) - ICIS-02-2001-8285, FORMAL ENFORCEMENT ACTION, ICIS-02-2000-8261, Business SIC classification: WATER SUPPLY
HEIRLOOM DESIGN (3800 MONROE AVE DOOR 27 in PITTSFORD, NY)
(Resource Conservation and Recovery Act (tracking hazardous waste)) Business NAICS classification: ALL OTHER MISCELLANEOUS MANUFACTURING.; ALL OTHER MISCELLANEOUS STORE RETAILERS (EXCEPT TOBACCO STORES). Organizations: JAMES M SCHAEFER (CONTACT/OWNER)
Alternative names: J & M SCHAEFER INC
HEIRLOOM DESIGNS (1 MENDON CENTER in PITTSFORD, NY)
(Resource Conservation and Recovery Act (tracking hazardous waste))
3750 MONROE AVENUE ASSOCIATES (3750 MONROE AVENUE in PITTSFORD, NY)
(Resource Conservation and Recovery Act (tracking hazardous waste))
CLARKLIFT OF ROCHESTER INC (1200 PITTSFORD VICTOR RD in PITTSFORD, NY)
Conditionally Exempt Small Quantity Generators, less than 100 kg/month of hazardous waste (Resource Conservation and Recovery Act (tracking hazardous waste))
Housing units lacking complete plumbing facilities: 0.2% Housing units lacking complete kitchen facilities: 0.8%
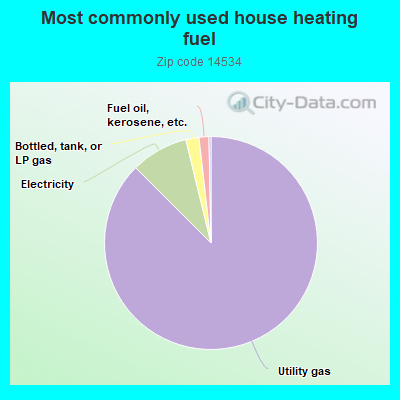
87.5%Utility gas
8.7%Electricity
2.0%Bottled, tank, or LP gas
1.5%Fuel oil, kerosene, etc.
Population in 1990: 27,413. Population change in the 1990s: +2,857 (+10.4%).
Place of birth for U.S.-born residents:
This state: 22,134
Northeast: 2,677
Midwest: 1,944
South: 1,413
West: 1,148
65% of the 14534 zip code residents lived in the same house 5 years ago. Out of people who lived in different houses, 69% lived in this county. Out of people who lived in different counties, 50% lived in New York.
91% of the 14534 zip code residents lived in the same house 1 year ago. Out of people who lived in different houses, 52% moved from this county. Out of people who lived in different houses, 19% moved from different county within same state. Out of people who lived in different houses, 27% moved from different state. Out of people who lived in different houses, 3% moved from abroad.
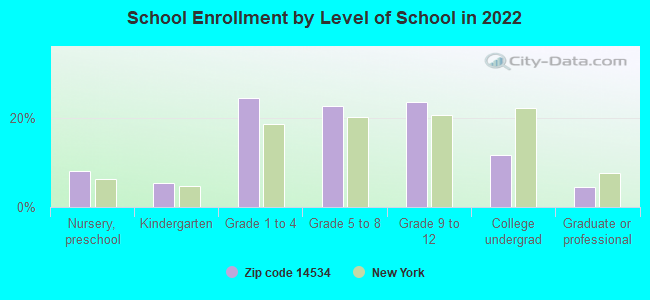
Private vs. public school enrollment:
Students in private schools in grades 1 to 8 (elementary and middle school): 448
Here:
11.9%
New York:
15.6%
Students in private schools in grades 9 to 12 (high school): 174
Here:
9.2%
New York:
15.0%
Students in private undergraduate colleges: 520
Here:
54.9%
New York:
39.2%
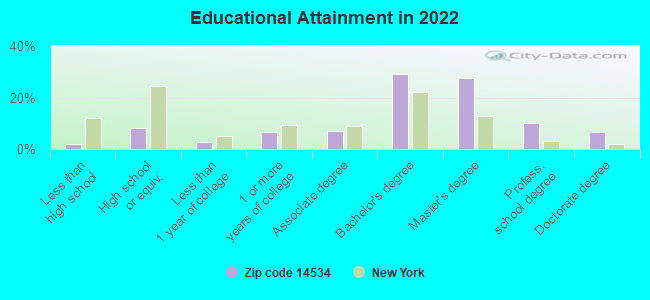
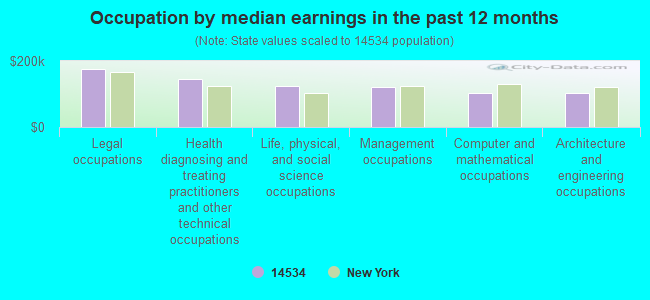
Occupation by median earnings in the past 12 months ($)
176,269Legal occupations
144,494Health diagnosing and treating practitioners and other technical occupations
122,827Life, physical, and social science occupations
122,519Management occupations
104,395Computer and mathematical occupations
102,335Architecture and engineering occupations
Companies with federal contracts located in this zip code (PITTSFORD, NY):
GHIOCEL PREDICTIVE TECHNOLOGIE (6 SOUTH MAIN STREET, 2ND; small business) : $949,418 in 5 contractsfrom 2003 to 2005
Contracts for Defense Tank - Automotive -- Basic Research (R&D), Defense Aircraft -- Management and Support (R&D), Defense Tank - Automotive -- Applied Research and Exploratory Development (R&D) by Army, Air Force Signed by year:2000: $0; 2001: $0; 2002: $0; 2003: $70,000; 2004: $411,812; 2005: $467,606; 2006: $0.
Biggest contracts:
$367,737 with Army for Defense Tank - Automotive -- Basic Research (R&D). Signed on 2005-09-21. Completion date: 2006-10-15.
$361,812, same as above.Signed on 2004-10-15. Completion date: 2006-10-15.
$99,869 with Air Force for Defense Aircraft -- Management and Support (R&D). Signed on 2005-03-22. Completion date: 2005-12-22.
$70,000 with Army for Defense Tank - Automotive -- Applied Research and Exploratory Development (R&D). Signed on 2003-12-12. Completion date: 2004-06-06.
LENEL SYSTEMS INTERNATIONAL IN (1212 PITTSFORD-VICTOR ROAD) : $634,230 in 11 contractsfrom 2000 to 2006
Contracts for Security Studies (Physical and Personal), ADP Software, Miscellaneous Alarm, Signal and Security Detection Systems, Other Education and Training Services, and moreby Navy, SOCIAL SECURITY ADMINISTRATION Signed by year:2000: $96,139; 2001: $50,523; 2002: $151,230; 2003: $89,765; 2004: $90,485; 2005: $106,970; 2006: $49,118.
Biggest contracts:
$96,139 with Navy for Security Studies (Physical and Personal). Taking place in OH. Signed on 2000-05-25. Completion date: 2000-05-25.
$90,485 with Navy for ADP Software. Signed on 2005-10-01. Completion date: 2006-09-30.
$90,485 with Navy for ADP Software. Taking place in VA. Signed on 2004-11-10. Completion date: 2005-09-30.
$89,765, same as above.Signed on 2003-10-01. Completion date: 2004-09-30.
VERAMARK TECHNOLOGIES, INC (3750 MONROE AVE; small business) : $280,961 in 30 contractsfrom 2001 to 2006
Contracts for ADP Central Processing Unit (CPU, Computer), Digital, ADP Software, Other Professional Services, ADPE System Configuration, and moreby Army, Employment Standards Administration, Department of Veterans Affairs, Federal Technology Service, and others Signed by year:2000: $0; 2001: $58,000; 2002: $0; 2003: $118,434; 2004: $71,237; 2005: $21,840; 2006: $11,450.
Biggest contracts:
$63,140 with Army for ADP Central Processing Unit (CPU, Computer), Digital. Signed on 2003-09-23. Completion date: 2003-12-31.
$58,000 with Employment Standards Administration for ADP Software. Taking place in DC. Signed on 2001-05-15. Completion date: 2001-05-15.
$39,034 with Employment Standards Administration for Other Professional Services. Signed on 2004-09-10. Completion date: 2004-09-30.
$25,815 with Department of Veterans Affairs for ADP Software. Signed on 2003-04-15. Completion date: 2003-06-15.
JOYNT PACKAGING INTERNATIONAL (184 W BLOOMFIELD RD; small business)
$74,148 with Navy for Decontaminating and Impregnating Equipment. Signed on 2003-03-27. Completion date: 2003-06-03.
PREDICTIVE TECHNOLOGIES INC (50 SUNSET BLVD; small business) : $37,197 in 2 contractsfrom 2004 to 2005
$19,598 with Army for Other Quality Control, Testing and Inspection Services -- Plumbing, Heating, and Waste Disposal Equipment. Signed on 2004-08-18. Completion date: 2004-10-18.
$17,599, same as above.Signed on 2005-06-13. Completion date: 2005-07-05.
ADVANCED MOTION SYSTEMS INC (3800 MONROE AVENUE; small business)
$29,931 with Army for Maintenance, Repair and Rebuilding of Equipment -- Instruments and Laboratory Equipment. Signed on 2000-07-14. Completion date: 2000-08-21.
DE MOCKER JOHN C MD PC INC (100 THORNELL RD; small business)
$15,000 with Navy for Radiology Services. Taking place in VA. Signed on 2004-09-20. Completion date: 2005-09-19.
UNIVERSAL CONNECTING POINT COR (640 KREAG RD; small business) : $10,888 in 2 contractsfrom 2002 to 2003
$10,168 with Army for ADPE System Configuration. Signed on 2002-04-09. Completion date: 2002-05-06.
$720 with Army for ADP Software. Taking place in VA. Signed on 2003-02-19. Completion date: 2004-03-20.
L-TRON CORP (1169 PITTSFORD VICTOR RD; small business)
$6,107 with Air Force for ADP Components. Signed on 2005-08-11. Completion date: 2005-09-09.
Top industries in this zip code by the number of employees in 2005:
2002 - 2018 National Fire Incident Reporting System (NFIRS) incidents
Based on the data from the years 2002 - 2018 the average number of fire incidents per year is 36. The highest number of fires - 51 took place in 2016, and the least - 15 in 2005. The data has a declining trend.
When looking into fire subcategories, the most incidents belonged to: Structure Fires (47.8%), and Outside Fires (28.5%).
Fire incident types reported to NFIRS in Zip Code 14534


 Nearest zip codes: 14506, 14445, 14618, 14610, 14467, 14625.
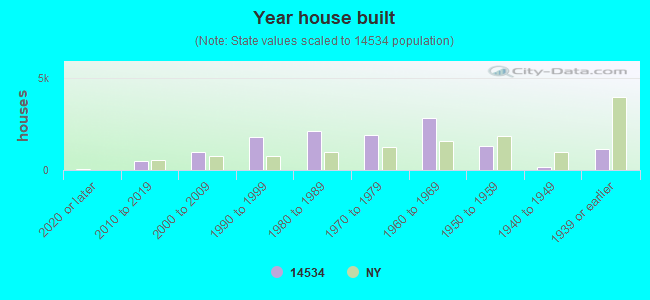


 Based on the data from the years 2002 - 2018 the average number of fire incidents per year is 36. The highest number of fires - 51 took place in 2016, and the least - 15 in 2005. The data has a declining trend.
 When looking into fire subcategories, the most incidents belonged to: Structure Fires (47.8%), and Outside Fires (28.5%).