Estimated zip code population in 2022: 2,114 Zip code population in 2010: 2,269 Zip code population in 2000: 2,302
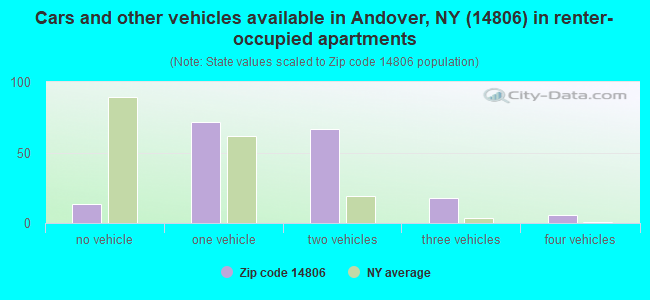
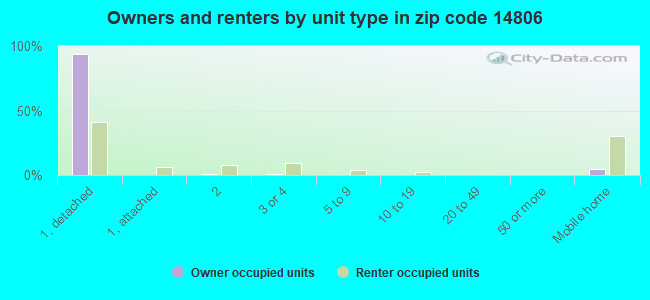
Houses and condos: 1,010 Renter-occupied apartments: 175
% of renters here:
22%
State:
46%
March 2022 cost of living index in zip code 14806: 92.9 (less than average, U.S. average is 100)
Land area: 68.7 sq. mi. Water area: 0.2 sq. mi.
Population density: 31 people per square mile
(very low).
OSM Map
General Map
Google Map
MSN Map
OSM Map
General Map
Google Map
MSN Map
OSM Map
General Map
Google Map
MSN Map
OSM Map
General Map
Google Map
MSN Map
Please wait while loading the map...
Real estate property taxes paid for housing units in 2022:
This zip code:
3.1% ($2,712)
New York:
1.5% ($6,180)
Median real estate property taxes paid for housing units with mortgages in 2022: $2,935 (3.6%) Median real estate property taxes paid for housing units with no mortgage in 2022: $2,535 (2.8%)
Business Search- 14 Million verified businesses
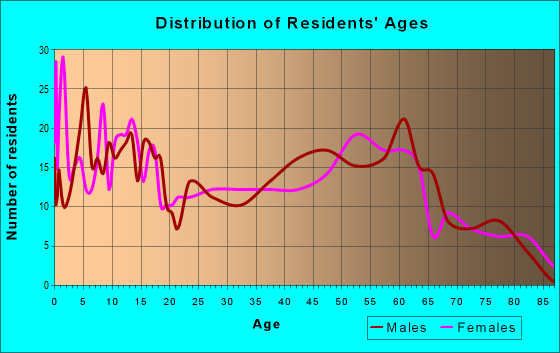
Males: 1,124
(53.2%)
Females: 990
(46.8%)
For population 25 years and over in 14806:
High school or higher: 93.7%
Bachelor's degree or higher: 22.2%
Graduate or professional degree: 5.6%
Unemployed: 7.1%
Mean travel time to work (commute): 23.1 minutes
For population 15 years and over in 14806:
Never married: 31.4%
Now married: 51.6%
Separated: 1.7%
Widowed: 6.5%
Divorced: 8.7%
Zip code 14806 compared to state average:
Median house value significantly below state average.
Black race population percentage significantly below state average.
Hispanic race population percentage significantly below state average.
Median age above state average.
Foreign-born population percentage significantly below state average.
Renting percentage below state average.
Length of stay since moving in significantly above state average.
Number of rooms per house above state average.
Number of college students below state average.
Percentage of population with a bachelor's degree or higher below state average.
Averages for the 2020 tax year for zip code 14806, filed in 2021:
Average Adjusted Gross Income (AGI) in 2020: $57,062 (Individual Income Tax Returns)
Here:
$57,062
State:
$90,930
Salary/wage: $47,896 (reported on 80.6% of returns)
Here:
$47,896
State:
$72,104
(% of AGI for various income ranges: 1109.0% for AGIs below $25k, 3253.8% for AGIs $25k-50k, 5487.5% for AGIs $50k-75k, 8592.9% for AGIs $75k-100k, 14102.5% for AGIs $100k-200k)
Taxable interest for individuals: $406 (reported on 32.7% of returns)
This zip code:
$406
New York:
$3,075
(% of AGI for various income ranges: 8.6% for AGIs below $25k, 7.1% for AGIs $25k-50k, 18.3% for AGIs $50k-75k, 30.0% for AGIs $75k-100k, 65.0% for AGIs $100k-200k)
Ordinary dividends: $2,900 (reported on 15.3% of returns)
Here:
$2,900
State:
$11,095
(% of AGI for various income ranges: 34.8% for AGIs below $25k, 16.7% for AGIs $25k-50k, 27.5% for AGIs $50k-75k, 227.1% for AGIs $75k-100k, 162.5% for AGIs $100k-200k)
Net capital gain/loss in AGI: +$4,273 (reported on 11.2% of returns)
Here:
+$4,273
State:
+$44,925
(% of AGI for various income ranges: 31.4% for AGIs below $25k, 54.2% for AGIs $50k-75k, 423.8% for AGIs $100k-200k)
Profit/loss from business: +$9,050 (reported on 12.2% of returns)
Here:
+$9,050
State:
+$14,940
(% of AGI for various income ranges: 71.9% for AGIs below $25k, 50.4% for AGIs $25k-50k, 275.8% for AGIs $50k-75k, 603.8% for AGIs $100k-200k)
Taxable individual retirement arrangement distribution: $19,238 (reported on 8.2% of returns)
14806:
$19,238
New York:
$19,609
(% of AGI for various income ranges: 131.0% for AGIs below $25k, 439.2% for AGIs $50k-75k, 921.2% for AGIs $100k-200k)
Earned income credit: $2,281 (reported on 16.3% of returns)
Here:
$2,281
State:
$2,138
(% of AGI for various income ranges: 89.5% for AGIs below $25k, 73.8% for AGIs $25k-50k)
Percentage of individuals using paid preparers for their 2020 taxes: 94.9%
Here:
95%
State:
95%
(% for various income ranges: 96.6% for AGIs below $25k, 96.6% for AGIs $25k-50k, 93.8% for AGIs $50k-75k, 90.0% for AGIs $75k-100k, 91.7% for AGIs $100k-200k, 100.0% for AGIs over 200k)
Averages for the 2012 tax year for zip code 14806, filed in 2013:
Average Adjusted Gross Income (AGI) in 2012: $43,764 (Individual Income Tax Returns)
Here:
$43,764
State:
$77,088
Salary/wage: $40,723 (reported on 82.7% of returns)
Here:
$40,723
State:
$60,593
(% of AGI for various income ranges: 74.4% for AGIs below $25k, 78.5% for AGIs $25k-50k, 78.6% for AGIs $50k-75k, 74.3% for AGIs $75k-100k, 77.2% for AGIs $100k-200k)
Taxable interest for individuals: $427 (reported on 30.6% of returns)
This zip code:
$427
New York:
$3,125
(% of AGI for various income ranges: 0.6% for AGIs below $25k, 0.3% for AGIs $25k-50k, 0.3% for AGIs $50k-75k, 0.4% for AGIs $100k-200k)
Ordinary dividends: $1,913 (reported on 15.3% of returns)
Here:
$1,913
State:
$10,299
(% of AGI for various income ranges: 0.8% for AGIs below $25k, 0.3% for AGIs $25k-50k, 1.0% for AGIs $50k-75k, 0.8% for AGIs $75k-100k, 0.5% for AGIs $100k-200k)
Net capital gain/loss in AGI: +$1,950 (reported on 10.2% of returns)
Here:
+$1,950
State:
+$42,474
(% of AGI for various income ranges: 1.1% for AGIs below $25k, 0.5% for AGIs $50k-75k, 0.9% for AGIs $100k-200k)
Profit/loss from business: +$7,260 (reported on 15.3% of returns)
Here:
+$7,260
State:
+$16,168
(% of AGI for various income ranges: 3.8% for AGIs below $25k, 1.7% for AGIs $25k-50k, 3.3% for AGIs $50k-75k, 4.0% for AGIs $100k-200k)
Taxable individual retirement arrangement distribution: $10,775 (reported on 8.2% of returns)
14806:
$10,775
New York:
$17,621
(% of AGI for various income ranges: 2.0% for AGIs below $25k, 4.3% for AGIs $25k-50k, 4.7% for AGIs $75k-100k)
Total itemized deductions: $17,974 (23% of AGI, reported on 19.4% of returns)
Here:
$17,974
State:
$34,985
Here:
22.6% of AGI
State:
21.3% of AGI
(% of AGI for various income ranges: 9.1% for AGIs $25k-50k, 7.2% for AGIs $50k-75k, 6.4% for AGIs $75k-100k, 12.6% for AGIs $100k-200k)
Charity contributions: $2,625 (reported on 12.2% of returns)
Here:
$2,625
State:
$5,572
(% of AGI for various income ranges: 0.8% for AGIs $25k-50k, 1.0% for AGIs $50k-75k, 0.5% for AGIs $75k-100k, 0.9% for AGIs $100k-200k)
Taxes paid: $7,416 (reported on 19.4% of returns)
14806:
$7,416
State:
$18,656
(% of AGI for various income ranges: 2.8% for AGIs $25k-50k, 2.7% for AGIs $50k-75k, 2.5% for AGIs $75k-100k, 6.3% for AGIs $100k-200k)
Earned income credit: $2,095 (reported on 19.4% of returns)
Here:
$2,095
State:
$2,230
(% of AGI for various income ranges: 6.0% for AGIs below $25k, 1.4% for AGIs $25k-50k)
Percentage of individuals using paid preparers for their 2012 taxes: 57.1%
Here:
57%
State:
66%
(% for various income ranges: 47.5% for AGIs below $25k, 60.9% for AGIs $25k-50k, 58.8% for AGIs $50k-75k, 70.0% for AGIs $75k-100k, 75.0% for AGIs $100k-200k)
Averages for the 2004 tax year for zip code 14806, filed in 2005:
Average Adjusted Gross Income (AGI) in 2004: $34,795 (Individual Income Tax Returns)
Here:
$34,795
State:
$59,519
Salary/wage: $32,802 (reported on 83.7% of returns)
Here:
$32,802
State:
$50,673
(% of AGI for various income ranges: 97.9% for AGIs below $10k, 75.6% for AGIs $10k-25k, 80.2% for AGIs $25k-50k, 83.0% for AGIs $50k-75k, 80.9% for AGIs $75k-100k, 65.9% for AGIs over 100k)
Taxable interest for individuals: $861 (reported on 42.3% of returns)
This zip code:
$861
New York:
$2,377
(% of AGI for various income ranges: 4.0% for AGIs below $10k, 1.7% for AGIs $10k-25k, 1.1% for AGIs $25k-50k, 0.3% for AGIs $50k-75k, 0.5% for AGIs $75k-100k, 1.8% for AGIs over 100k)
Taxable dividends: $2,400 (reported on 18.6% of returns)
Here:
$2,400
State:
$5,394
(% of AGI for various income ranges: 1.2% for AGIs below $10k, 1.6% for AGIs $10k-25k, 0.5% for AGIs $25k-50k, 1.3% for AGIs $50k-75k, 0.5% for AGIs $75k-100k, 3.4% for AGIs over 100k)
Net capital gain/loss: +$1,077 (reported on 12.1% of returns)
Here:
+$1,077
State:
+$23,581
(% of AGI for various income ranges: 0.0% for AGIs below $10k, 0.5% for AGIs $10k-25k, 0.4% for AGIs $25k-50k, 0.4% for AGIs $50k-75k, 0.5% for AGIs over 100k)
Profit/loss from business: +$2,057 (reported on 14.5% of returns)
Here:
+$2,057
State:
+$13,809
(% of AGI for various income ranges: 3.8% for AGIs below $10k, 0.3% for AGIs $10k-25k, 0.9% for AGIs $25k-50k, 1.4% for AGIs $50k-75k, 0.7% for AGIs $75k-100k)
IRA payment deduction: $2,417 (reported on 1.2% of returns)
14806:
$2,417
New York:
$3,115
Total itemized deductions: $15,179 (21% of AGI, reported on 16.7% of returns)
Here:
$15,179
State:
$25,864
Here:
20.7% of AGI
State:
21.9% of AGI
(% of AGI for various income ranges: 6.7% for AGIs $25k-50k, 8.3% for AGIs $50k-75k, 10.7% for AGIs $75k-100k, 11.5% for AGIs over 100k)
Charity contributions deductions: $2,225 (3% of AGI, reported on 13.3% of returns)
Here:
$2,225
State:
$4,439
Here:
2.8% of AGI
State:
3.6% of AGI
(% of AGI for various income ranges: 0.5% for AGIs $25k-50k, 0.9% for AGIs $50k-75k, 1.4% for AGIs $75k-100k, 1.9% for AGIs over 100k)
Total tax: $3,977 (reported on 71.5% of returns)
14806:
$3,977
State:
$11,730
(% of AGI for various income ranges: 2.2% for AGIs below $10k, 3.9% for AGIs $10k-25k, 5.5% for AGIs $25k-50k, 8.1% for AGIs $50k-75k, 10.4% for AGIs $75k-100k, 17.1% for AGIs over 100k)
Earned income credit: $1,554 (reported on 16.2% of returns)
Here:
$1,554
State:
$1,757
Percentage of individuals using paid preparers for their 2004 taxes: 60.0%
Here:
60%
State:
67%
(% for various income ranges: 50.0% for AGIs below $10k, 61.7% for AGIs $10k-25k, 62.9% for AGIs $25k-50k, 59.2% for AGIs $50k-75k, 72.0% for AGIs $75k-100k, 70.0% for AGIs over 100k)
Household received Food Stamps/SNAP in the past 12 months: 113 Household did not receive Food Stamps/SNAP in the past 12 months: 688
Women who had a birth in the past 12 months: 25 (13 now married, 12 unmarried) Women who did not have a birth in the past 12 months: 337 (153 now married, 182 unmarried)
Housing units in zip code 14806 with a mortgage: 275 (26 second mortgage, 26 both second mortgage and home equity loan) Houses without a mortgage: 65
Median monthly owner costs for units with a mortgage: $908 Median monthly owner costs for units without a mortgage: $577
Residents with income below the poverty level in 2022:
This zip code:
19.6%
Whole state:
14.3%
Residents with income below 50% of the poverty level in 2022:
This zip code:
9.3%
Whole state:
6.8%
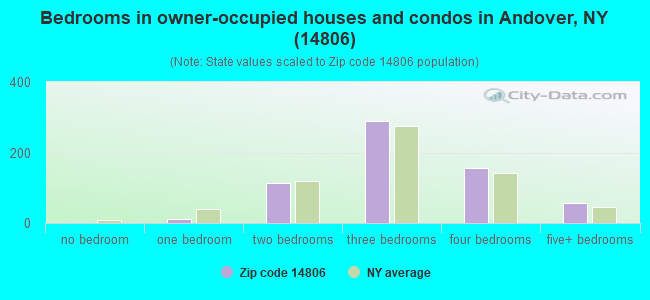
Median number of rooms in houses and condos:
Here:
7.4
State:
6.3
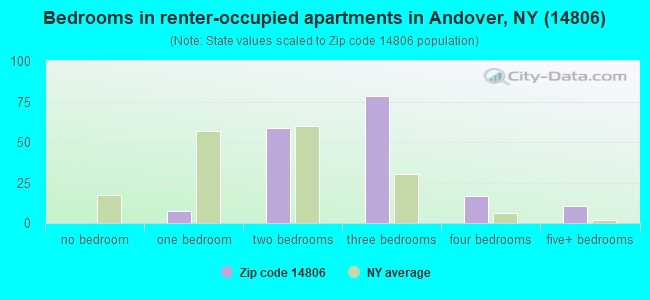
Median number of rooms in apartments:
Here:
6.2
State:
3.8
Notable locations in this zip code not listed on our city pages
Churches in zip code 14806 include: Andover First Baptist Church (A), Andover United Methodist Church (B), Blessed Sacrament Catholic Church (C), Chenunda Creek Fellowship (D). Display/hide their locations on the map
Cemeteries: Saint Johns Cemetery (1), Gate of Heaven Cemetery (2), Fulmer Valley Cemetery (3), Independence Cemetery (4), Brewster Cemetery (5), West Union Cemetery (6), Valley Brook Cemetery (7). Display/hide their locations on the map
Size of family households: 268 2-persons, 145 3-persons, 102 4-persons, 30 5-persons, 2 6-persons, 10 7-or-more-persons
Size of nonfamily households: 177 1-person, 29 2-persons, 31 3-persons
207 married couples with children.
227 single-parent households (16 men, 211 women).
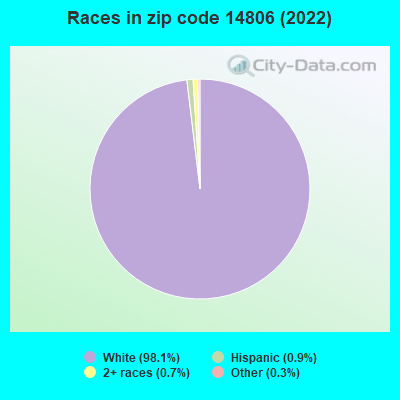
99.3% of residents of 14806 zip code speak English at home.
0.5% of residents speak Spanish at home (100% very well).
0.3% of residents speak other language at home (100% very well).
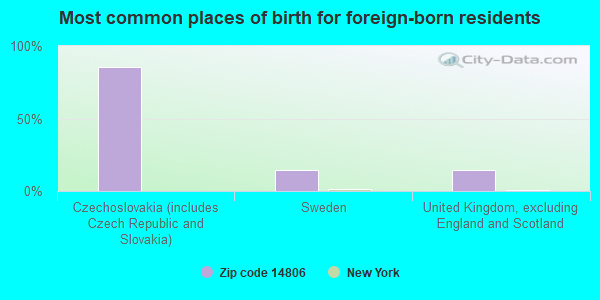
Foreign born population: 8 (0.4%) (100.0% of them are naturalized citizens)
This zip code:
0.4%
Whole state:
22.7%
86%Czechoslovakia (includes Czech Republic and Slovakia)
14%Sweden
14%United Kingdom, excluding England and Scotland
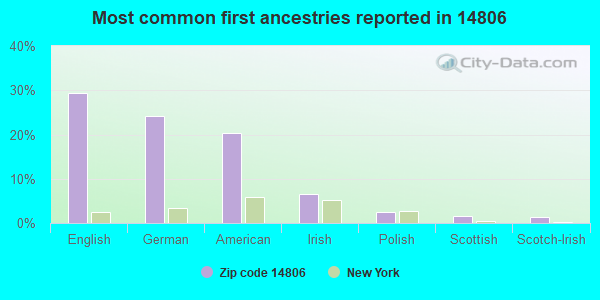
29%English
24%German
20%American
7%Irish
2%Polish
2%Scottish
1%Scotch-Irish
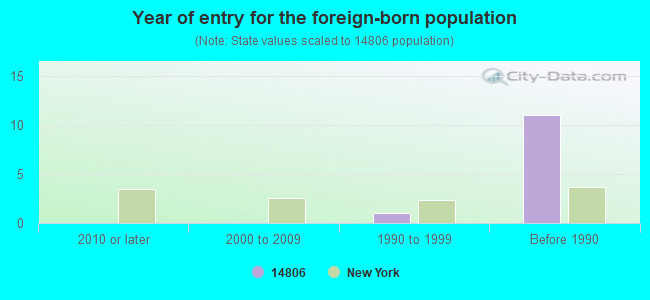
Year of entry for the foreign-born population
02010 or later
02000 to 2009
11990 to 1999
11Before 1990
Facilities with environmental interests located in this zip code:
ANDOVER VILLAGE PUBLIC WATER (VILLAGE HALL, MAIN ST in ANDOVER, NY)
(Integrated Compliance Information System) - ICIS-02-2000-8105, FORMAL ENFORCEMENT ACTION COMMUNITY WATER SYSTEM (SDWIS) - SDWIS-NY0200311 12761, WATER TREATMENT PLANT Business SIC classification: WATER SUPPLY
ANDOVER WATER & LIGHT CO (4 MAIN ST in ANDOVER, NY)
(Integrated Compliance Information System) - ICIS-02-1989-0187, FORMAL ENFORCEMENT ACTION COMPLIANCE ACTIVITY (Tracking inspections of insecticide, fungicide, and rodenticide, and toxic substances)
ANDOVER SCHOOL ( in ANDOVER, NY)
(National Center for Education Statistics) - STATE ID-020601040001 Organizations: ANDOVER CSD (SCHOOL DISTRICT)
INDEPENDENCE STATION (RD #2 in ANDOVER, NY)
AIR MAJOR (AIRS/AFS) CRITERIA AND HAZARDOUS AIR POLLUTANT INVENTORY (Inventory of air pollution sources) Conditionally Exempt Small Quantity Generators, less than 100 kg/month of hazardous waste (Resource Conservation and Recovery Act (tracking hazardous waste)) HAZARDOUS WASTE BIENNIAL REPORTER (Resource Conservation and Recovery Act (tracking hazardous waste)) Business SIC classification: NATURAL GAS TRANSMISSION Business NAICS classification: PIPELINE TRANSPORTATION OF NATURAL GAS. Organizations: NATIONAL FUEL GAS (CONTACT/OPERATOR)
Alternative names: PENN YORK INDEPENDENCE STA
ANDOVER VILLAGE OF ELECTRIC DEPT (MAPLE ST in ANDOVER, NY)
(Resource Conservation and Recovery Act (tracking hazardous waste))
ANDOVER WATER & LIGHT CO (WEST GREEN WOOD AVE in ANDOVER, NY)
COMPLIANCE ACTIVITY (Tracking inspections of insecticide, fungicide, and rodenticide, and toxic substances)
ANDOVER WATER & LIGHT CO (#5 EAST AVE in ANDOVER, NY)
COMPLIANCE ACTIVITY (Tracking inspections of insecticide, fungicide, and rodenticide, and toxic substances)
Housing units lacking complete plumbing facilities: 5.3% Housing units lacking complete kitchen facilities: 7.2%
65.1%Utility gas
11.4%Bottled, tank, or LP gas
10.0%Electricity
8.2%Wood
2.9%Fuel oil, kerosene, etc.
1.7%Coal or coke
1.3%Other fuel
Population in 1990: 2,489.
Place of birth for U.S.-born residents:
This state: 1,763
Northeast: 217
Midwest: 35
South: 63
West: 13
69% of the 14806 zip code residents lived in the same house 5 years ago. Out of people who lived in different houses, 66% lived in this county. Out of people who lived in different counties, 50% lived in New York.
94% of the 14806 zip code residents lived in the same house 1 year ago. Out of people who lived in different houses, 74% moved from this county. Out of people who lived in different houses, 8% moved from different county within same state. Out of people who lived in different houses, 15% moved from different state.
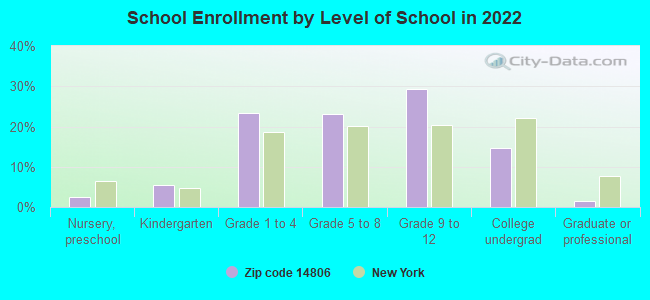
Private vs. public school enrollment:
Students in private schools in grades 1 to 8 (elementary and middle school): 22
Here:
11.7%
New York:
15.6%
Students in private schools in grades 9 to 12 (high school): 3
Here:
2.9%
New York:
15.0%
Students in private undergraduate colleges: 19
Here:
31.8%
New York:
39.2%
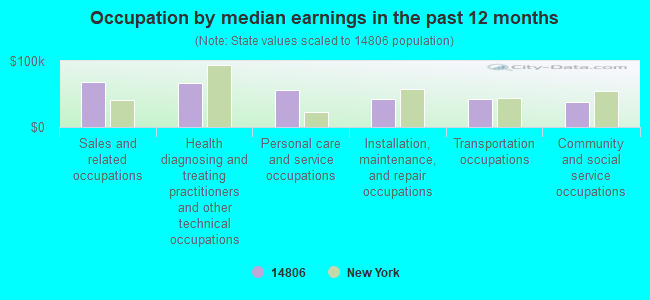
Occupation by median earnings in the past 12 months ($)
68,020Sales and related occupations
66,400Health diagnosing and treating practitioners and other technical occupations
56,087Personal care and service occupations
42,734Installation, maintenance, and repair occupations
42,565Transportation occupations
38,409Community and social service occupations
Top industries in this zip code by the number of employees in 2005:
Construction: Commercial and Institutional Building Construction (5-9 employees: 1 establishment, 1-4 employees: 1 establishment)
Construction: Electrical Contractors (5-9: 1)
Real Estate and Rental and Leasing: Lessors of Nonresidential Buildings (except Miniwarehouses) (5-9: 1)
Other Services (except Public Administration): Other Similar Organizations (except Business, Professional, Labor, and Political Organizations) (5-9: 1)
Health Care and Social Assistance: Offices of Physicians (except Mental Health Specialists) (5-9: 1)
Fatal accident statistics in 2011:
Fatal accident count: 1
Vehicles involved in fatal accidents: 2
Fatal accidents caused by drunken drivers: 0
Fatalities: 1
Persons involved in fatal accidents: 2
Pedestrians involved in fatal accidents: 0
Fatal accident statistics in 2010:
Fatal accident count: 1
Vehicles involved in fatal accidents: 1
Fatal accidents caused by drunken drivers: 1
Fatalities: 1
Persons involved in fatal accidents: 1
Pedestrians involved in fatal accidents: 0
2002 - 2018 National Fire Incident Reporting System (NFIRS) incidents
Based on the data from the years 2002 - 2018 the average number of fires per year is 10. The highest number of reported fire incidents - 21 took place in 2009, and the least - 2 in 2003. The data has a rising trend.
When looking into fire subcategories, the most incidents belonged to: Structure Fires (70.8%), and Outside Fires (17.4%).
Fire incident types reported to NFIRS in Zip Code 14806
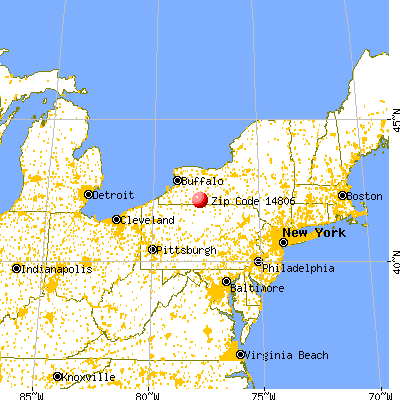


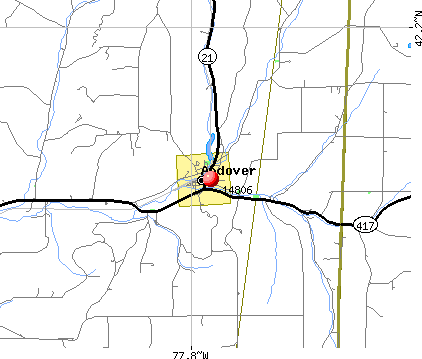 Nearest zip codes: 14802, 14803, 14839, 14877, 14897, 14804.


 Based on the data from the years 2002 - 2018 the average number of fires per year is 10. The highest number of reported fire incidents - 21 took place in 2009, and the least - 2 in 2003. The data has a rising trend.
 When looking into fire subcategories, the most incidents belonged to: Structure Fires (70.8%), and Outside Fires (17.4%).