Estimated zip code population in 2022: 28,208 Zip code population in 2010: 27,049 Zip code population in 2000: 23,196
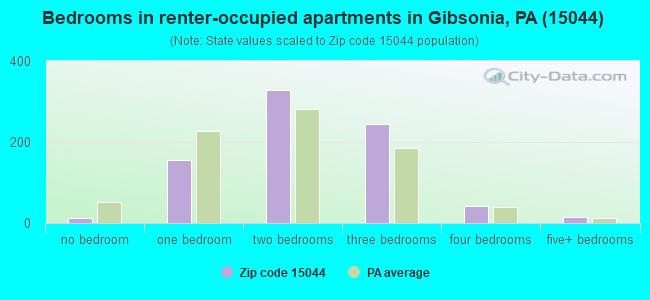
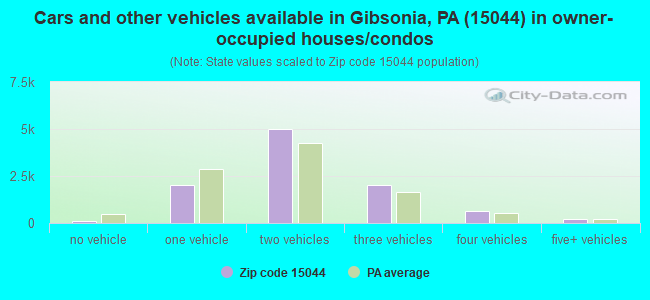
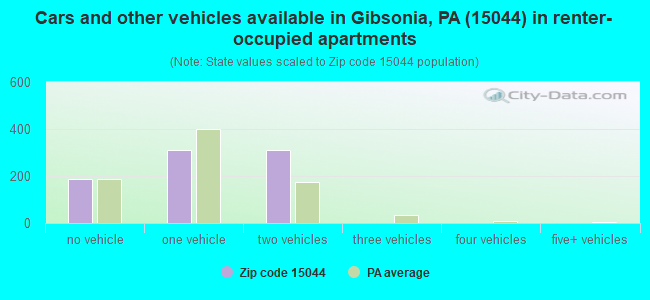
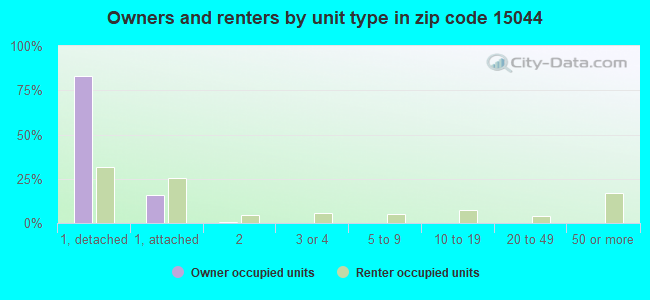
Houses and condos: 11,202 Renter-occupied apartments: 807
% of renters here:
7%
State:
31%
March 2022 cost of living index in zip code 15044: 94.5 (less than average, U.S. average is 100)
Land area: 41.3 sq. mi. Water area: 0.0 sq. mi.
Population density: 682 people per square mile
(low).
OSM Map
General Map
Google Map
MSN Map
OSM Map
General Map
Google Map
MSN Map
OSM Map
General Map
Google Map
MSN Map
OSM Map
General Map
Google Map
MSN Map
Please wait while loading the map...
Real estate property taxes paid for housing units in 2022:
This zip code:
1.4% ($5,132)
Pennsylvania:
1.3% ($3,094)
Median real estate property taxes paid for housing units with mortgages in 2022: $5,532 (1.3%) Median real estate property taxes paid for housing units with no mortgage in 2022: $4,351 (1.4%)
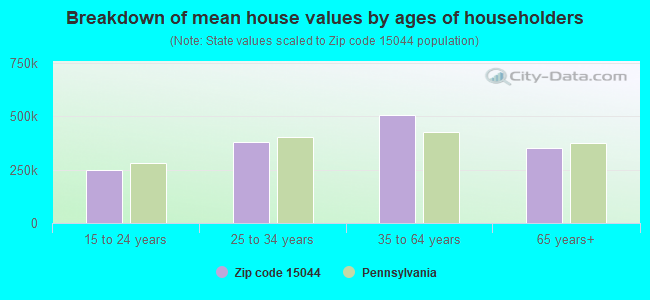
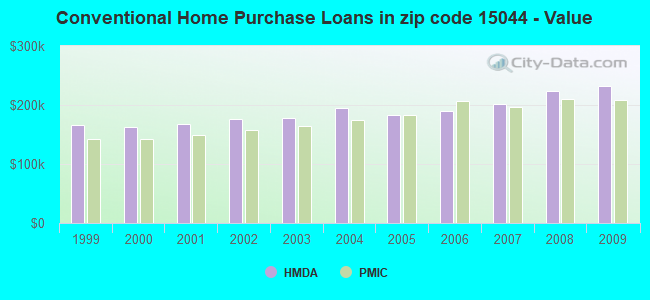
Estimated median house/condo value in 2022: $378,452
15044:
$378,452
Pennsylvania:
$245,500
According to our research of Pennsylvania and other state lists, there were 7 registered sex offenders living in 15044 zip code as of May 13, 2024. The ratio of all residents to sex offenders in zip code 15044 is 4,060 to 1. The ratio of registered sex offenders to all residents in this zip code is much lower than the state average.
Median resident age:
This zip code:
47.9 years
Pennsylvania median age:
40.9 years
Average household size:
This zip code:
2.6 people
Pennsylvania:
2.4 people
Averages for the 2020 tax year for zip code 15044, filed in 2021:
Average Adjusted Gross Income (AGI) in 2020: $138,212 (Individual Income Tax Returns)
Here:
$138,212
State:
$75,707
Salary/wage: $117,802 (reported on 79.2% of returns)
Here:
$117,802
State:
$62,806
(% of AGI for various income ranges: 1065.0% for AGIs below $25k, 3291.1% for AGIs $25k-50k, 5675.6% for AGIs $50k-75k, 8614.7% for AGIs $75k-100k, 18004.6% for AGIs $100k-200k, 102196.6% for AGIs over 200k)
Taxable interest for individuals: $2,005 (reported on 48.6% of returns)
This zip code:
$2,005
Pennsylvania:
$1,633
(% of AGI for various income ranges: 31.6% for AGIs below $25k, 43.1% for AGIs $25k-50k, 53.1% for AGIs $50k-75k, 108.3% for AGIs $75k-100k, 154.5% for AGIs $100k-200k, 1068.1% for AGIs over 200k)
Ordinary dividends: $9,053 (reported on 41.0% of returns)
Here:
$9,053
State:
$7,382
(% of AGI for various income ranges: 69.0% for AGIs below $25k, 118.8% for AGIs $25k-50k, 224.3% for AGIs $50k-75k, 328.0% for AGIs $75k-100k, 469.7% for AGIs $100k-200k, 4639.6% for AGIs over 200k)
Net capital gain/loss in AGI: +$29,104 (reported on 35.4% of returns)
Here:
+$29,104
State:
+$23,522
(% of AGI for various income ranges: 52.4% for AGIs below $25k, 112.6% for AGIs $25k-50k, 163.5% for AGIs $50k-75k, 337.3% for AGIs $75k-100k, 713.8% for AGIs $100k-200k, 16446.2% for AGIs over 200k)
Profit/loss from business: +$26,096 (reported on 15.3% of returns)
Here:
+$26,096
State:
+$16,274
(% of AGI for various income ranges: 101.8% for AGIs below $25k, 181.3% for AGIs $25k-50k, 210.9% for AGIs $50k-75k, 374.0% for AGIs $75k-100k, 638.0% for AGIs $100k-200k, 4506.4% for AGIs over 200k)
Taxable individual retirement arrangement distribution: $25,628 (reported on 15.9% of returns)
15044:
$25,628
Pennsylvania:
$18,583
(% of AGI for various income ranges: 118.3% for AGIs below $25k, 247.8% for AGIs $25k-50k, 519.0% for AGIs $50k-75k, 790.1% for AGIs $75k-100k, 1146.2% for AGIs $100k-200k, 2320.8% for AGIs over 200k)
Self-employed (Keogh) retirement plans: $29,704 (reported on 1.6% of returns)
15044:
$29,704
Pennsylvania:
$25,407
(% of AGI for various income ranges: 13.1% for AGIs $25k-50k, 35.9% for AGIs $100k-200k, 778.8% for AGIs over 200k)
Total itemized deductions: $37,787 (reported on 13.0% of returns)
Here:
$37,787
State:
$34,850
(% of AGI for various income ranges: 90.4% for AGIs below $25k, 125.2% for AGIs $25k-50k, 324.8% for AGIs $50k-75k, 501.4% for AGIs $75k-100k, 711.0% for AGIs $100k-200k, 5856.9% for AGIs over 200k)
Charity contributions: $12,602 (reported on 11.1% of returns)
Here:
$12,602
State:
$12,392
(% of AGI for various income ranges: 4.3% for AGIs below $25k, 15.6% for AGIs $25k-50k, 36.3% for AGIs $50k-75k, 65.5% for AGIs $75k-100k, 169.0% for AGIs $100k-200k, 2014.4% for AGIs over 200k)
Taxes paid: $8,919 (reported on 13.0% of returns)
15044:
$8,919
State:
$8,200
(% of AGI for various income ranges: 13.2% for AGIs below $25k, 28.3% for AGIs $25k-50k, 88.2% for AGIs $50k-75k, 148.0% for AGIs $75k-100k, 228.1% for AGIs $100k-200k, 1205.5% for AGIs over 200k)
Earned income credit: $1,493 (reported on 4.1% of returns)
Here:
$1,493
State:
$2,100
(% of AGI for various income ranges: 25.8% for AGIs below $25k, 26.7% for AGIs $25k-50k)
Percentage of individuals using paid preparers for their 2020 taxes: 89.5%
Here:
90%
State:
92%
(% for various income ranges: 85.9% for AGIs below $25k, 88.8% for AGIs $25k-50k, 90.4% for AGIs $50k-75k, 88.9% for AGIs $75k-100k, 91.6% for AGIs $100k-200k, 92.3% for AGIs over 200k)
Averages for the 2012 tax year for zip code 15044, filed in 2013:
Average Adjusted Gross Income (AGI) in 2012: $117,788 (Individual Income Tax Returns)
Here:
$117,788
State:
$61,346
Salary/wage: $97,272 (reported on 82.6% of returns)
Here:
$97,272
State:
$51,902
(% of AGI for various income ranges: 67.2% for AGIs below $25k, 69.6% for AGIs $25k-50k, 68.3% for AGIs $50k-75k, 73.4% for AGIs $75k-100k, 79.2% for AGIs $100k-200k, 62.6% for AGIs over 200k)
Taxable interest for individuals: $1,505 (reported on 50.4% of returns)
This zip code:
$1,505
Pennsylvania:
$1,588
(% of AGI for various income ranges: 2.2% for AGIs below $25k, 1.1% for AGIs $25k-50k, 0.9% for AGIs $50k-75k, 0.6% for AGIs $75k-100k, 0.6% for AGIs $100k-200k, 0.5% for AGIs over 200k)
Ordinary dividends: $9,963 (reported on 40.3% of returns)
Here:
$9,963
State:
$5,827
(% of AGI for various income ranges: 4.3% for AGIs below $25k, 2.3% for AGIs $25k-50k, 2.5% for AGIs $50k-75k, 1.9% for AGIs $75k-100k, 1.7% for AGIs $100k-200k, 4.5% for AGIs over 200k)
Net capital gain/loss in AGI: +$27,684 (reported on 30.8% of returns)
Here:
+$27,684
State:
+$14,495
(% of AGI for various income ranges: 0.5% for AGIs $25k-50k, 0.5% for AGIs $50k-75k, 0.9% for AGIs $75k-100k, 1.2% for AGIs $100k-200k, 12.5% for AGIs over 200k)
Profit/loss from business: +$27,927 (reported on 14.7% of returns)
Here:
+$27,927
State:
+$16,268
(% of AGI for various income ranges: 6.2% for AGIs below $25k, 4.9% for AGIs $25k-50k, 3.7% for AGIs $50k-75k, 3.5% for AGIs $75k-100k, 3.0% for AGIs $100k-200k, 3.4% for AGIs over 200k)
Taxable individual retirement arrangement distribution: $19,147 (reported on 14.8% of returns)
15044:
$19,147
Pennsylvania:
$14,550
(% of AGI for various income ranges: 6.1% for AGIs below $25k, 4.7% for AGIs $25k-50k, 4.5% for AGIs $50k-75k, 4.0% for AGIs $75k-100k, 3.1% for AGIs $100k-200k, 1.3% for AGIs over 200k)
Self-employment retirement plans: $26,538 (reported on 1.7% of returns)
15044:
$26,538
Pennsylvania:
$20,922
(% of AGI for various income ranges: 0.3% for AGIs $50k-75k, 0.2% for AGIs $100k-200k, 0.6% for AGIs over 200k)
Total itemized deductions: $30,101 (15% of AGI, reported on 49.6% of returns)
Here:
$30,101
State:
$23,538
Here:
14.8% of AGI
State:
18.4% of AGI
(% of AGI for various income ranges: 12.3% for AGIs below $25k, 11.9% for AGIs $25k-50k, 14.1% for AGIs $50k-75k, 14.1% for AGIs $75k-100k, 15.4% for AGIs $100k-200k, 11.2% for AGIs over 200k)
Charity contributions: $5,134 (reported on 44.2% of returns)
Here:
$5,134
State:
$4,025
(% of AGI for various income ranges: 1.0% for AGIs below $25k, 1.1% for AGIs $25k-50k, 1.6% for AGIs $50k-75k, 1.5% for AGIs $75k-100k, 1.9% for AGIs $100k-200k, 2.1% for AGIs over 200k)
Taxes paid: $14,873 (reported on 49.5% of returns)
15044:
$14,873
State:
$9,982
(% of AGI for various income ranges: 3.5% for AGIs below $25k, 4.3% for AGIs $25k-50k, 5.6% for AGIs $50k-75k, 6.3% for AGIs $75k-100k, 7.6% for AGIs $100k-200k, 6.0% for AGIs over 200k)
Earned income credit: $1,701 (reported on 5.3% of returns)
Here:
$1,701
State:
$2,106
(% of AGI for various income ranges: 2.2% for AGIs below $25k, 0.5% for AGIs $25k-50k)
Percentage of individuals using paid preparers for their 2012 taxes: 49.3%
Here:
49%
State:
53%
(% for various income ranges: 41.6% for AGIs below $25k, 44.7% for AGIs $25k-50k, 50.9% for AGIs $50k-75k, 49.7% for AGIs $75k-100k, 50.7% for AGIs $100k-200k, 69.6% for AGIs over 200k)
Averages for the 2004 tax year for zip code 15044, filed in 2005:
Average Adjusted Gross Income (AGI) in 2004: $83,853 (Individual Income Tax Returns)
Here:
$83,853
State:
$48,049
Salary/wage: $76,185 (reported on 83.0% of returns)
Here:
$76,185
State:
$42,646
(% of AGI for various income ranges: 175.9% for AGIs below $10k, 62.0% for AGIs $10k-25k, 71.7% for AGIs $25k-50k, 77.3% for AGIs $50k-75k, 82.1% for AGIs $75k-100k, 74.2% for AGIs over 100k)
Taxable interest for individuals: $1,748 (reported on 64.6% of returns)
This zip code:
$1,748
Pennsylvania:
$1,657
(% of AGI for various income ranges: 14.4% for AGIs below $10k, 4.5% for AGIs $10k-25k, 2.4% for AGIs $25k-50k, 1.5% for AGIs $50k-75k, 1.3% for AGIs $75k-100k, 1.0% for AGIs over 100k)
Taxable dividends: $3,408 (reported on 45.7% of returns)
Here:
$3,408
State:
$3,566
(% of AGI for various income ranges: 17.2% for AGIs below $10k, 3.8% for AGIs $10k-25k, 2.3% for AGIs $25k-50k, 1.8% for AGIs $50k-75k, 1.6% for AGIs $75k-100k, 1.7% for AGIs over 100k)
Net capital gain/loss: +$10,584 (reported on 35.6% of returns)
Here:
+$10,584
State:
+$9,716
(% of AGI for various income ranges: -5.7% for AGIs below $10k, 0.4% for AGIs $10k-25k, 0.9% for AGIs $25k-50k, 0.7% for AGIs $50k-75k, 1.0% for AGIs $75k-100k, 6.3% for AGIs over 100k)
Profit/loss from business: +$22,117 (reported on 15.2% of returns)
Here:
+$22,117
State:
+$14,267
(% of AGI for various income ranges: 7.8% for AGIs below $10k, 5.4% for AGIs $10k-25k, 4.2% for AGIs $25k-50k, 3.2% for AGIs $50k-75k, 4.1% for AGIs $75k-100k, 4.0% for AGIs over 100k)
IRA payment deduction: $3,267 (reported on 3.4% of returns)
15044:
$3,267
Pennsylvania:
$2,903
(% of AGI for various income ranges: 0.5% for AGIs below $10k, 0.3% for AGIs $10k-25k, 0.4% for AGIs $25k-50k, 0.2% for AGIs $50k-75k, 0.2% for AGIs $75k-100k, 0.1% for AGIs over 100k)
Self-employed pension: $17,564 (reported on 2.1% of returns)
Here:
$17,564
Pennsylvania:
$14,674
(% of AGI for various income ranges: 0.1% for AGIs $25k-50k, 0.1% for AGIs $50k-75k, 0.2% for AGIs $75k-100k, 0.6% for AGIs over 100k)
Total itemized deductions: $23,092 (17% of AGI, reported on 52.0% of returns)
Here:
$23,092
State:
$18,804
Here:
16.6% of AGI
State:
19.5% of AGI
(% of AGI for various income ranges: 23.1% for AGIs below $10k, 15.3% for AGIs $10k-25k, 16.4% for AGIs $25k-50k, 18.3% for AGIs $50k-75k, 18.8% for AGIs $75k-100k, 12.6% for AGIs over 100k)
Charity contributions deductions: $3,589 (2% of AGI, reported on 48.5% of returns)
Here:
$3,589
State:
$3,337
Here:
2.5% of AGI
State:
3.3% of AGI
(% of AGI for various income ranges: 1.3% for AGIs below $10k, 1.5% for AGIs $10k-25k, 1.7% for AGIs $25k-50k, 2.1% for AGIs $50k-75k, 2.2% for AGIs $75k-100k, 2.1% for AGIs over 100k)
Total tax: $17,862 (reported on 79.9% of returns)
15044:
$17,862
State:
$8,008
(% of AGI for various income ranges: 4.7% for AGIs below $10k, 4.8% for AGIs $10k-25k, 7.2% for AGIs $25k-50k, 8.6% for AGIs $50k-75k, 9.7% for AGIs $75k-100k, 21.3% for AGIs over 100k)
Earned income credit: $1,371 (reported on 4.6% of returns)
Here:
$1,371
State:
$1,643
Percentage of individuals using paid preparers for their 2004 taxes: 50.9%
Here:
51%
State:
56%
(% for various income ranges: 42.2% for AGIs below $10k, 48.5% for AGIs $10k-25k, 53.8% for AGIs $25k-50k, 52.1% for AGIs $50k-75k, 47.4% for AGIs $75k-100k, 59.3% for AGIs over 100k)
Likely homosexual households (counted as self-reported same-sex unmarried-partner households)
Lesbian couples: 0.2% of all households
Gay men: 0.0% of all households
Household received Food Stamps/SNAP in the past 12 months: 297 Household did not receive Food Stamps/SNAP in the past 12 months: 10,475
Women who had a birth in the past 12 months: 275 (294 now married, 0 unmarried) Women who did not have a birth in the past 12 months: 4,828 (2,499 now married, 2,308 unmarried)
Housing units in zip code 15044 with a mortgage: 6,470 (963 second mortgage, 9 home equity loan, 952 both second mortgage and home equity loan) Houses without a mortgage: 402
Median monthly owner costs for units with a mortgage: $2,248 Median monthly owner costs for units without a mortgage: $778
Residents with income below the poverty level in 2022:
This zip code:
4.1%
Whole state:
11.8%
Residents with income below 50% of the poverty level in 2022:
This zip code:
1.6%
Whole state:
6.1%
Median number of rooms in houses and condos:
Here:
7.7
State:
6.8
Median number of rooms in apartments:
Here:
5.0
State:
4.3
Notable locations in this zip code not listed on our city pages
Notable locations in zip code 15044: Pittsburgh North Golf Course (A), Camp Trees (B), Hope Grange (C), Bakerstown Presbyterian Childrens Center (D), Saint Barnabas Home (E), North Pittsburgh Childrens House (F), Northern Tier Regional Library (G), Richland Police Department (H), Richland Township Building (I), Richland Township Hall (J), Stepping Stones Childrens Center (K), North Hampton Volunteer Fire Department (L), West Deer Township Volunteer Fire Department 3 Station 290 (M), Wexford Volunteer Fire Company Substation (N), Richland Township Volunteer Fire Department Station 2 (O), Richland Township Volunteer Fire Department Station 1 (P). Display/hide their locations on the map
Churches in zip code 15044 include: Salem Heights Christian Life Center (A), Saint Richards Church (B), Saint Andrew the Apostle Byzantine Catholic Church (C), Reformed Presbyterian Church of North Hills (D), Hampton Presbyterian Church (E), Trinity Church (F), Deer Creek United Presbyterian Church (G), Deer Creek Church (H), Bakerstown United Methodist Church (I). Display/hide their locations on the map
In group quarters: 141 (-1 institutionalized population)
Size of family households: 3,788 2-persons, 2,212 3-persons, 1,727 4-persons, 535 5-persons, 99 6-persons
Size of nonfamily households: 1,912 1-person, 498 2-persons
4,784 married couples with children.
802 single-parent households (130 men, 672 women).
95.8% of residents of 15044 zip code speak English at home.
0.5% of residents speak Spanish at home (68% very well, 32% well).
2.7% of residents speak other Indo-European language at home (92% very well, 8% well).
0.6% of residents speak Asian or Pacific Island language at home (48% very well, 30% well, 22% not well).
0.1% of residents speak other language at home (100% very well).
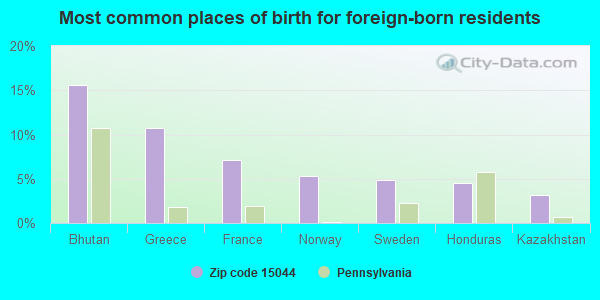
Foreign born population: 1,318 (4.7%) (69.4% of them are naturalized citizens)
This zip code:
4.7%
Whole state:
7.5%
16%Bhutan
11%Greece
7%France
5%Norway
5%Sweden
5%Honduras
3%Kazakhstan
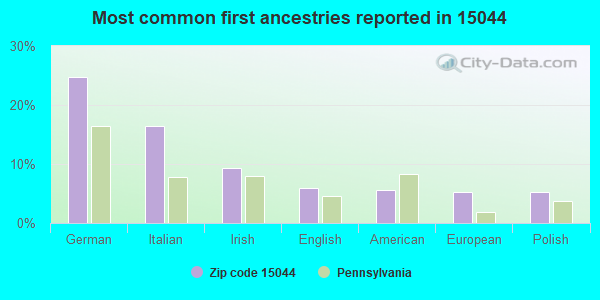
25%German
16%Italian
9%Irish
6%English
6%American
5%European
5%Polish
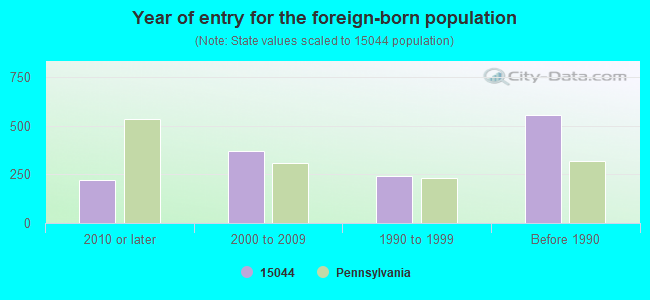
Year of entry for the foreign-born population
2222010 or later
3712000 to 2009
2431990 to 1999
555Before 1990
Facilities with environmental interests located in this zip code:
ALLEGHENY CNTY TRAFFIC DIV & SIGN SHOP (2154 WILDWOOD RD in GIBSONIA, PA)
STATE MASTER (Pennsylvania database) - RCRIS-PAR000037572, HAZARDOUS WASTE PROGRAM (Resource Conservation and Recovery Act (tracking hazardous waste)) Conditionally Exempt Small Quantity Generators, less than 100 kg/month of hazardous waste (Resource Conservation and Recovery Act (tracking hazardous waste)) Organizations: ALLEGHENY CNTY OF (CONTACT/OWNER)
, ALLEGHENY COUNTY (CONTACT/OWNER)
Alternative names: ALLEGHENY CNTY DIST 1, ALLEGHENY CNTY NORTH PARK, ALLEGHENY CNTY PENNSYLVANIA
7 ELEVEN STORE 4012 (5610 WILLIAM FLYNN HIGHWAY in GIBSONIA, PA)
STATE MASTER (Pennsylvania database) - RCRIS-PAD987345147, HAZARDOUS WASTE PROGRAM, PCS-PAG056213, National Pollutant Discharge Elimination System Permit Small Quantity Generators, between 100 kg and 1000 kg of hazardous waste/month (Resource Conservation and Recovery Act (tracking hazardous waste)) - notification Organizations: OPERNAME (CONTACT/OPERATOR)
, COLLIER KEITH (CONTACT/OWNER)
, HANDEE MARTS INC. DBA 7 ELEVEN STORES (CONTACT/OWNER)
Alternative names: 7 ELEVEN 401, COLLIER'S AMOCO
A T T TECHNOLOGY (4451 GIBSONIA RD in GIBSONIA, PA)
Small Quantity Generators, between 100 kg and 1000 kg of hazardous waste/month (Resource Conservation and Recovery Act (tracking hazardous waste)) - notification Organizations: OPERNAME (CONTACT/OPERATOR)
, AT & T TECH INC (CONTACT/OWNER)
Alternative names: A T & T TECH INC
BAUMGARDNER CO (2875 KRAMER RD in GIBSONIA, PA)
USED OIL PROGRAM (Resource Conservation and Recovery Act (tracking hazardous waste)) Organizations: OPERNAME (CONTACT/OPERATOR)
, BAUMGARDNER, ELMER (CONTACT/OWNER)
BENKE MOTORS INC (4361 GIBSONIA RD in GIBSONIA, PA)
Small Quantity Generators, between 100 kg and 1000 kg of hazardous waste/month (Resource Conservation and Recovery Act (tracking hazardous waste)) - notification Organizations: OPERNAME (CONTACT/OPERATOR)
, ORSINI JOHN (CONTACT/OWNER)
BLUEGRASS MED WASTE OF PA INC (2081 B KRAMER RD in GIBSONIA, PA)
TRANSPORTER (Resource Conservation and Recovery Act (tracking hazardous waste))
Housing units lacking complete plumbing facilities: 0.6% Housing units lacking complete kitchen facilities: 1.2%
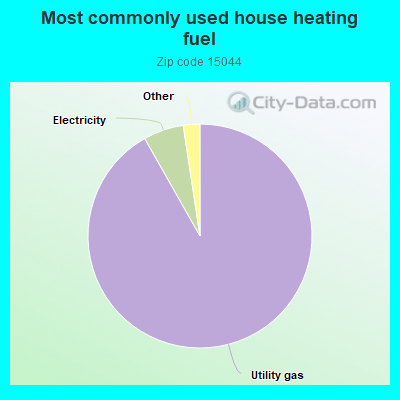
91.8%Utility gas
5.8%Electricity
0.9%Fuel oil, kerosene, etc.
0.7%Bottled, tank, or LP gas
Population in 1990: 18,318. Population change in the 1990s: +4,878 (+26.6%).
Place of birth for U.S.-born residents:
This state: 21,797
Northeast: 1,537
Midwest: 1,540
South: 1,204
West: 591
65% of the 15044 zip code residents lived in the same house 5 years ago. Out of people who lived in different houses, 61% lived in this county. Out of people who lived in different counties, 50% lived in Pennsylvania.
93% of the 15044 zip code residents lived in the same house 1 year ago. Out of people who lived in different houses, 93% moved from this county. Out of people who lived in different houses, 5% moved from different county within same state. Out of people who lived in different houses, 1% moved from different state.
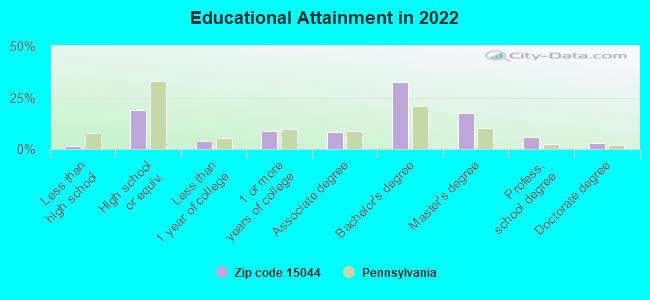
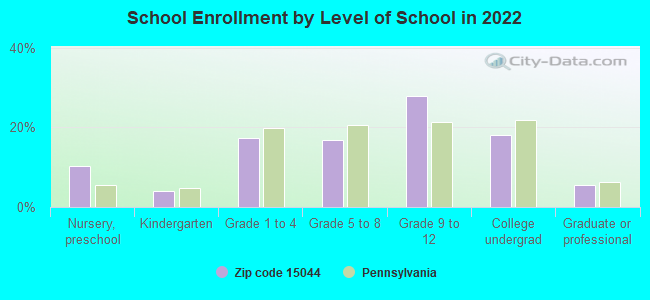
Private vs. public school enrollment:
Students in private schools in grades 1 to 8 (elementary and middle school): 227
Here:
10.9%
Pennsylvania:
15.7%
Students in private schools in grades 9 to 12 (high school): 262
Here:
15.2%
Pennsylvania:
13.4%
Students in private undergraduate colleges: 429
Here:
38.6%
Pennsylvania:
39.8%
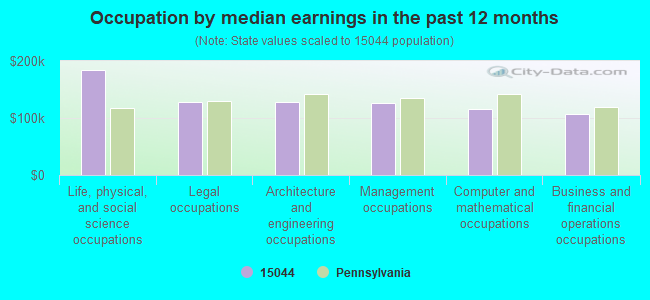
Occupation by median earnings in the past 12 months ($)
183,564Life, physical, and social science occupations
127,351Legal occupations
127,267Architecture and engineering occupations
126,590Management occupations
115,091Computer and mathematical occupations
106,646Business and financial operations occupations
Companies with federal contracts located in this zip code (GIBSONIA, PA):
RHEA ENGINEERS AND CONSULTANTS (4981 WILLIAM FLYNN HWY SUI; small business) : $2,940,301 in 12 contractsfrom 2004 to 2006
Contracts for Architect - Engineer Services (including landscaping, interior layout, and designing), Maintenance, Repair or Alteration of Real Property -- Other Non-Building Facilities, Other Architect and Engineering Services by Navy, Army Signed by year:2000: $0; 2001: $0; 2002: $0; 2003: $0; 2004: $835,366; 2005: $1,854,514; 2006: $250,421.
Biggest contracts:
$1,536,474 with Navy for Architect - Engineer Services (including landscaping, interior layout, and designing). Taking place in DC. Signed on 2005-09-29. Completion date: 2006-03-31.
$740,000 with Army for Maintenance, Repair or Alteration of Real Property -- Other Non-Building Facilities. Signed on 2004-09-30. Completion date: 2005-09-30.
$296,225 with Navy for Other Architect and Engineering Services. Taking place in NC. Signed on 2005-02-14. Completion date: 2006-02-10.
$123,337, same as above.Signed on 2006-04-21. Completion date: 2007-04-21.
JACKSON INDUSTRIES INC (2400 OAKHILLRD; small business) : $111,393 in 3 contractsfrom 2002 to 2003
$57,790 with Army for Maintenance, Repair or Alteration of Real Property -- Miscellaneous Buildings. Signed on 2002-05-28. Completion date: 2002-08-21.
$36,700, same as above.Signed on 2003-08-28. Completion date: 2003-12-05.
$16,903 with Army for Maintenance, Repair or Alteration of Real Property -- Other Administrative Facilities and Service Buildings. Signed on 2002-09-25. Completion date: 2002-11-30.
AMERICAN FASTENER TECHNOLOGIES (9 FRONTIER DR; small business) : $65,526 in 4 contractsfrom 2002 to 2006
$29,520 with Navy for Bolts. Signed on 2005-08-19. Completion date: 2005-10-19.
$27,520 with Navy for Bolts. Taking place in CA. Signed on 2002-02-05. Completion date: 2002-03-08.
$5,232 with Navy for Nails, Machine Keys, and Pins. Signed on 2005-09-02. Completion date: 2005-10-07.
$3,254 with Broadcasting Board of Governors for Bolts. Signed on 2006-09-06. Completion date: 2006-10-18.
JITLEARNING GROUP, INC (1137 WOODHILL DR; small business) : $47,021 in 4 contractsfrom 2004 to 2005
$26,500 with Army for Training Aids. Taking place in AZ. Signed on 2005-06-24. Completion date: 2005-09-17.
$23,680 with Army for Miscellaneous Office Machines. Taking place in AZ. Signed on 2004-02-05. Completion date: 2004-04-05.
$741 with Army for ADP Components. Taking place in AZ. Signed on 2004-08-04. Completion date: 2004-04-05.
-$3,900 with Army for Training Aids. Taking place in AZ. Signed on 2005-09-28. Completion date: 2005-09-17.
LASER DRIVE INC (5318 RANALLI DRIVE; small business)
$3,810 with Army for Laboratory Equipment and Supplies. Signed on 2005-09-21. Completion date: 2005-11-25.
Top industries in this zip code by the number of employees in 2005:
2004 - 2018 National Fire Incident Reporting System (NFIRS) incidents
Based on the data from the years 2004 - 2018 the average number of fire incidents per year is 39. The highest number of reported fires - 85 took place in 2016, and the least - 7 in 2007. The data has a growing trend.
When looking into fire subcategories, the most incidents belonged to: Structure Fires (57.3%), and Outside Fires (19.0%).
Fire incident types reported to NFIRS in Zip Code 15044


 Nearest zip codes: 15007, 15101, 15006, 16059, 16046, 15051.


 Based on the data from the years 2004 - 2018 the average number of fire incidents per year is 39. The highest number of reported fires - 85 took place in 2016, and the least - 7 in 2007. The data has a growing trend.
 When looking into fire subcategories, the most incidents belonged to: Structure Fires (57.3%), and Outside Fires (19.0%).