Estimated zip code population in 2022: 11,084 Zip code population in 2010: 11,588 Zip code population in 2000: 11,996
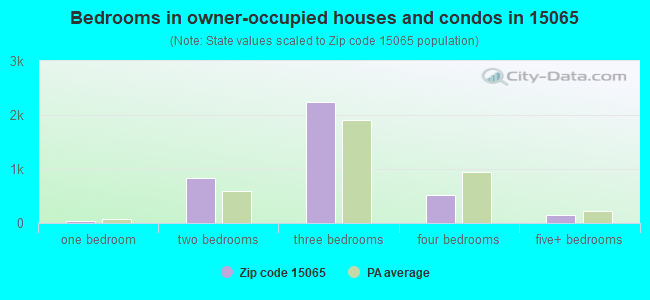
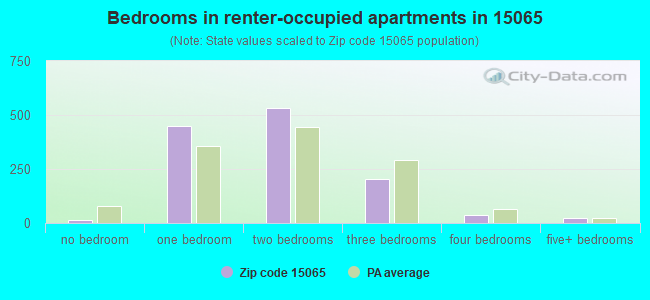
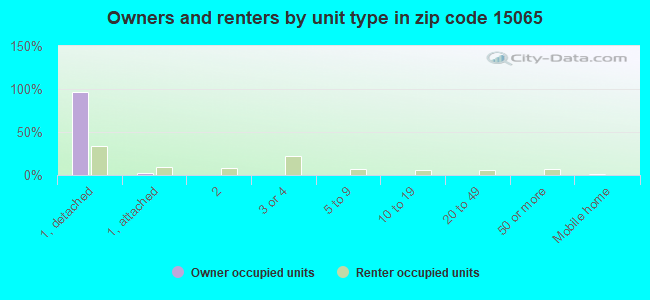
Houses and condos: 5,616 Renter-occupied apartments: 1,262
% of renters here:
25%
State:
31%
March 2022 cost of living index in zip code 15065: 92.1 (less than average, U.S. average is 100)
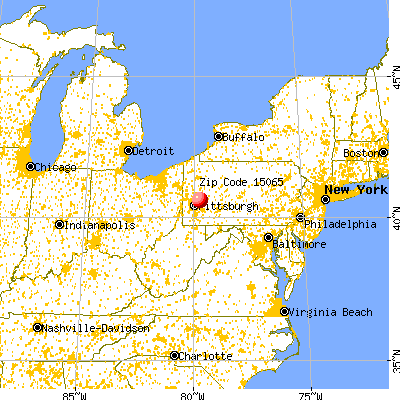
Land area: 12.4 sq. mi. Water area: 0.5 sq. mi.
Population density: 895 people per square mile
(low).
OSM Map
General Map
Google Map
MSN Map
OSM Map
General Map
Google Map
MSN Map
OSM Map
General Map
Google Map
MSN Map
OSM Map
General Map
Google Map
MSN Map
Please wait while loading the map...
Real estate property taxes paid for housing units in 2022:
This zip code:
1.7% ($2,550)
Pennsylvania:
1.3% ($3,094)
Median real estate property taxes paid for housing units with mortgages in 2022: $2,593 (1.7%) Median real estate property taxes paid for housing units with no mortgage in 2022: $2,486 (1.7%)
Business Search- 14 Million verified businesses
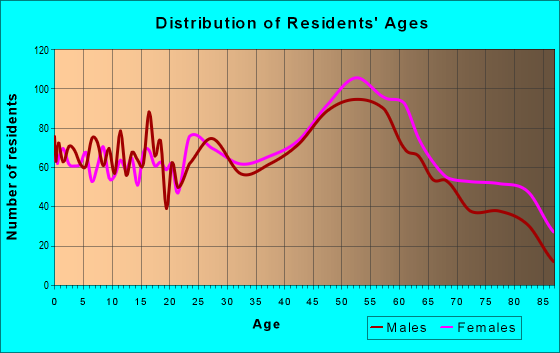
Males: 5,574
(50.3%)
Females: 5,509
(49.7%)
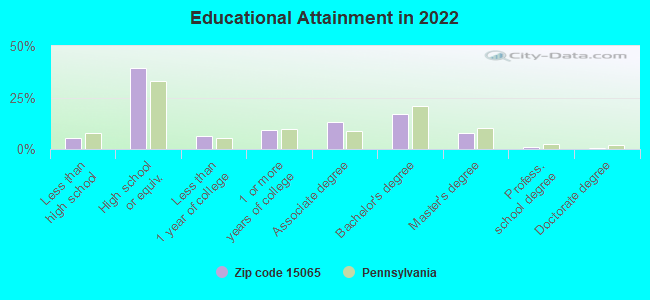
For population 25 years and over in 15065:
High school or higher: 94.3%
Bachelor's degree or higher: 26.4%
Graduate or professional degree: 9.7%
Unemployed: 3.1%
Mean travel time to work (commute): 23.8 minutes
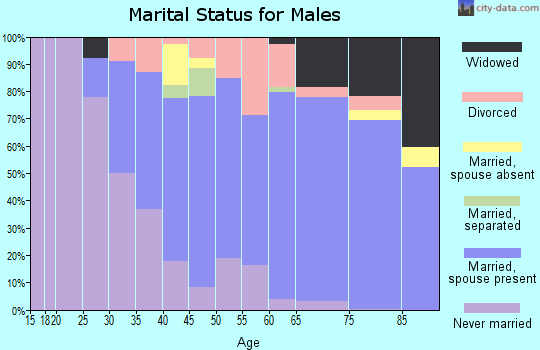
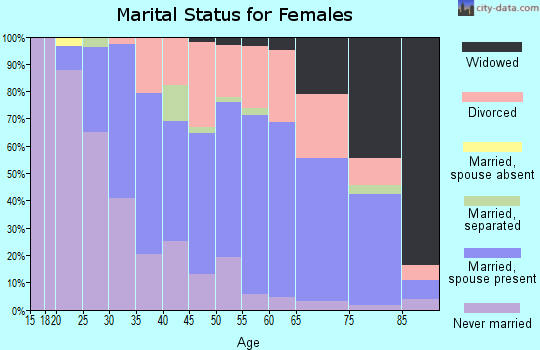
For population 15 years and over in 15065:
Never married: 32.5%
Now married: 52.2%
Separated: 1.3%
Widowed: 4.7%
Divorced: 9.3%
Zip code 15065 compared to state average:
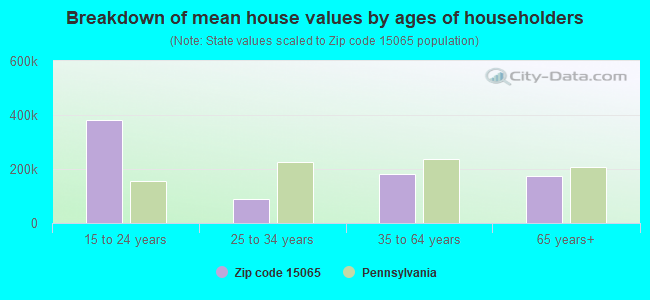
Median house value below state average.
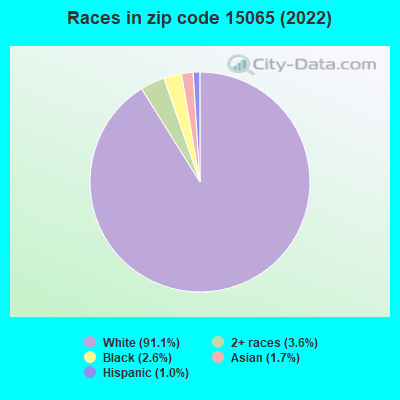
Black race population percentage significantly below state average.
Hispanic race population percentage significantly below state average.
Median age above state average.
Foreign-born population percentage significantly below state average.
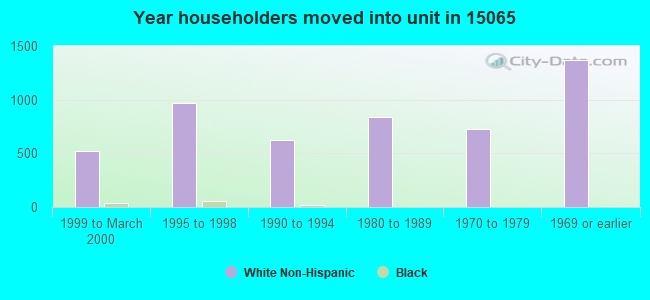
Length of stay since moving in significantly above state average.
Estimated median house/condo value in 2022: $149,015
15065:
$149,015
Pennsylvania:
$245,500
According to our research of Pennsylvania and other state lists, there were 11 registered sex offenders living in 15065 zip code as of April 27, 2024. The ratio of all residents to sex offenders in zip code 15065 is 1,076 to 1. The ratio of registered sex offenders to all residents in this zip code is lower than the state average.
Median resident age:
This zip code:
47.4 years
Pennsylvania median age:
40.9 years
Average household size:
This zip code:
2.2 people
Pennsylvania:
2.4 people
Averages for the 2020 tax year for zip code 15065, filed in 2021:
Average Adjusted Gross Income (AGI) in 2020: $57,558 (Individual Income Tax Returns)
Here:
$57,558
State:
$75,707
Salary/wage: $51,057 (reported on 77.7% of returns)
Here:
$51,057
State:
$62,806
(% of AGI for various income ranges: 1008.9% for AGIs below $25k, 3396.8% for AGIs $25k-50k, 6162.1% for AGIs $50k-75k, 8794.3% for AGIs $75k-100k, 15177.9% for AGIs $100k-200k, 71390.0% for AGIs over 200k)
Taxable interest for individuals: $1,240 (reported on 30.1% of returns)
This zip code:
$1,240
Pennsylvania:
$1,633
(% of AGI for various income ranges: 17.5% for AGIs below $25k, 18.2% for AGIs $25k-50k, 45.8% for AGIs $50k-75k, 86.7% for AGIs $75k-100k, 87.2% for AGIs $100k-200k, 1652.5% for AGIs over 200k)
Ordinary dividends: $3,933 (reported on 19.9% of returns)
Here:
$3,933
State:
$7,382
(% of AGI for various income ranges: 25.7% for AGIs below $25k, 38.7% for AGIs $25k-50k, 73.5% for AGIs $50k-75k, 152.9% for AGIs $75k-100k, 231.9% for AGIs $100k-200k, 3867.5% for AGIs over 200k)
Net capital gain/loss in AGI: +$7,474 (reported on 15.4% of returns)
Here:
+$7,474
State:
+$23,522
(% of AGI for various income ranges: 12.1% for AGIs below $25k, 34.4% for AGIs $25k-50k, 62.1% for AGIs $50k-75k, 122.6% for AGIs $75k-100k, 396.0% for AGIs $100k-200k, 8297.5% for AGIs over 200k)
Profit/loss from business: +$11,478 (reported on 9.5% of returns)
Here:
+$11,478
State:
+$16,274
(% of AGI for various income ranges: 79.1% for AGIs below $25k, 76.2% for AGIs $25k-50k, 135.2% for AGIs $50k-75k, 265.0% for AGIs $75k-100k, 425.1% for AGIs $100k-200k, 1192.5% for AGIs over 200k)
Taxable individual retirement arrangement distribution: $16,208 (reported on 12.6% of returns)
15065:
$16,208
Pennsylvania:
$18,583
(% of AGI for various income ranges: 124.5% for AGIs below $25k, 167.9% for AGIs $25k-50k, 262.1% for AGIs $50k-75k, 472.1% for AGIs $75k-100k, 599.1% for AGIs $100k-200k, 4642.5% for AGIs over 200k)
Total itemized deductions: $27,383 (reported on 3.1% of returns)
Here:
$27,383
State:
$34,850
(% of AGI for various income ranges: 75.4% for AGIs $25k-50k, 133.8% for AGIs $50k-75k, 177.6% for AGIs $75k-100k, 314.3% for AGIs $100k-200k, 2352.5% for AGIs over 200k)
Charity contributions: $8,638 (reported on 2.2% of returns)
Here:
$8,638
State:
$12,392
(% of AGI for various income ranges: 4.8% for AGIs below $25k, 21.1% for AGIs $50k-75k, 21.2% for AGIs $75k-100k, 97.2% for AGIs $100k-200k, 952.5% for AGIs over 200k)
Taxes paid: $7,011 (reported on 3.1% of returns)
15065:
$7,011
State:
$8,200
(% of AGI for various income ranges: 12.2% for AGIs $25k-50k, 34.4% for AGIs $50k-75k, 58.1% for AGIs $75k-100k, 89.4% for AGIs $100k-200k, 570.0% for AGIs over 200k)
Earned income credit: $2,052 (reported on 11.4% of returns)
Here:
$2,052
State:
$2,100
(% of AGI for various income ranges: 69.4% for AGIs below $25k, 45.1% for AGIs $25k-50k)
Percentage of individuals using paid preparers for their 2020 taxes: 85.5%
Here:
85%
State:
92%
(% for various income ranges: 85.6% for AGIs below $25k, 85.7% for AGIs $25k-50k, 83.9% for AGIs $50k-75k, 85.5% for AGIs $75k-100k, 86.5% for AGIs $100k-200k, 85.7% for AGIs over 200k)
Averages for the 2012 tax year for zip code 15065, filed in 2013:
Average Adjusted Gross Income (AGI) in 2012: $49,126 (Individual Income Tax Returns)
Here:
$49,126
State:
$61,346
Salary/wage: $43,810 (reported on 81.0% of returns)
Here:
$43,810
State:
$51,902
(% of AGI for various income ranges: 65.9% for AGIs below $25k, 75.4% for AGIs $25k-50k, 77.3% for AGIs $50k-75k, 77.8% for AGIs $75k-100k, 74.3% for AGIs $100k-200k, 51.5% for AGIs over 200k)
Taxable interest for individuals: $1,182 (reported on 36.4% of returns)
This zip code:
$1,182
Pennsylvania:
$1,588
(% of AGI for various income ranges: 1.6% for AGIs below $25k, 0.7% for AGIs $25k-50k, 0.6% for AGIs $50k-75k, 0.7% for AGIs $75k-100k, 0.8% for AGIs $100k-200k, 1.5% for AGIs over 200k)
Ordinary dividends: $2,893 (reported on 22.8% of returns)
Here:
$2,893
State:
$5,827
(% of AGI for various income ranges: 2.0% for AGIs below $25k, 0.8% for AGIs $25k-50k, 1.1% for AGIs $50k-75k, 1.0% for AGIs $75k-100k, 1.2% for AGIs $100k-200k, 2.7% for AGIs over 200k)
Net capital gain/loss in AGI: +$3,328 (reported on 14.0% of returns)
Here:
+$3,328
State:
+$14,495
(% of AGI for various income ranges: 0.1% for AGIs below $25k, 0.1% for AGIs $25k-50k, 0.6% for AGIs $50k-75k, 0.6% for AGIs $75k-100k, 1.0% for AGIs $100k-200k, 3.9% for AGIs over 200k)
Profit/loss from business: +$11,875 (reported on 9.2% of returns)
Here:
+$11,875
State:
+$16,268
(% of AGI for various income ranges: 5.2% for AGIs below $25k, 1.5% for AGIs $25k-50k, 1.9% for AGIs $50k-75k, 1.9% for AGIs $75k-100k, 2.8% for AGIs $100k-200k, 1.0% for AGIs over 200k)
Taxable individual retirement arrangement distribution: $13,684 (reported on 12.6% of returns)
15065:
$13,684
Pennsylvania:
$14,550
(% of AGI for various income ranges: 4.6% for AGIs below $25k, 3.3% for AGIs $25k-50k, 2.5% for AGIs $50k-75k, 2.7% for AGIs $75k-100k, 3.9% for AGIs $100k-200k, 5.2% for AGIs over 200k)
Self-employment retirement plans: $17,950 (reported on 0.3% of returns)
15065:
$17,950
Pennsylvania:
$20,922
Total itemized deductions: $17,560 (18% of AGI, reported on 22.6% of returns)
Here:
$17,560
State:
$23,538
Here:
17.8% of AGI
State:
18.4% of AGI
(% of AGI for various income ranges: 6.8% for AGIs below $25k, 4.9% for AGIs $25k-50k, 7.4% for AGIs $50k-75k, 8.2% for AGIs $75k-100k, 10.6% for AGIs $100k-200k, 10.3% for AGIs over 200k)
Charity contributions: $2,812 (reported on 19.2% of returns)
Here:
$2,812
State:
$4,025
(% of AGI for various income ranges: 0.5% for AGIs below $25k, 0.5% for AGIs $25k-50k, 0.9% for AGIs $50k-75k, 1.3% for AGIs $75k-100k, 1.5% for AGIs $100k-200k, 1.8% for AGIs over 200k)
Taxes paid: $7,679 (reported on 22.6% of returns)
15065:
$7,679
State:
$9,982
(% of AGI for various income ranges: 1.6% for AGIs below $25k, 1.8% for AGIs $25k-50k, 3.0% for AGIs $50k-75k, 3.4% for AGIs $75k-100k, 5.1% for AGIs $100k-200k, 5.8% for AGIs over 200k)
Earned income credit: $1,768 (reported on 14.2% of returns)
Here:
$1,768
State:
$2,106
(% of AGI for various income ranges: 4.4% for AGIs below $25k, 0.6% for AGIs $25k-50k)
Percentage of individuals using paid preparers for their 2012 taxes: 48.0%
Here:
48%
State:
53%
(% for various income ranges: 44.3% for AGIs below $25k, 46.7% for AGIs $25k-50k, 50.5% for AGIs $50k-75k, 50.9% for AGIs $75k-100k, 54.9% for AGIs $100k-200k, 77.8% for AGIs over 200k)
Averages for the 2004 tax year for zip code 15065, filed in 2005:
Average Adjusted Gross Income (AGI) in 2004: $39,520 (Individual Income Tax Returns)
Here:
$39,520
State:
$48,049
Salary/wage: $36,788 (reported on 79.5% of returns)
Here:
$36,788
State:
$42,646
(% of AGI for various income ranges: 80.4% for AGIs below $10k, 63.3% for AGIs $10k-25k, 78.2% for AGIs $25k-50k, 81.8% for AGIs $50k-75k, 81.7% for AGIs $75k-100k, 61.1% for AGIs over 100k)
Taxable interest for individuals: $1,746 (reported on 49.2% of returns)
This zip code:
$1,746
Pennsylvania:
$1,657
(% of AGI for various income ranges: 7.2% for AGIs below $10k, 4.0% for AGIs $10k-25k, 2.0% for AGIs $25k-50k, 1.4% for AGIs $50k-75k, 0.8% for AGIs $75k-100k, 2.6% for AGIs over 100k)
Taxable dividends: $2,126 (reported on 28.8% of returns)
Here:
$2,126
State:
$3,566
(% of AGI for various income ranges: 4.6% for AGIs below $10k, 1.7% for AGIs $10k-25k, 1.2% for AGIs $25k-50k, 0.9% for AGIs $50k-75k, 0.8% for AGIs $75k-100k, 2.6% for AGIs over 100k)
Net capital gain/loss: +$4,651 (reported on 18.1% of returns)
Here:
+$4,651
State:
+$9,716
(% of AGI for various income ranges: -1.0% for AGIs below $10k, 0.1% for AGIs $10k-25k, 0.6% for AGIs $25k-50k, 0.6% for AGIs $50k-75k, 1.2% for AGIs $75k-100k, 6.9% for AGIs over 100k)
Profit/loss from business: +$11,399 (reported on 9.2% of returns)
Here:
+$11,399
State:
+$14,267
(% of AGI for various income ranges: 5.0% for AGIs below $10k, 3.5% for AGIs $10k-25k, 2.1% for AGIs $25k-50k, 1.7% for AGIs $50k-75k, 1.6% for AGIs $75k-100k, 4.2% for AGIs over 100k)
IRA payment deduction: $2,825 (reported on 2.4% of returns)
15065:
$2,825
Pennsylvania:
$2,903
(% of AGI for various income ranges: 0.3% for AGIs $10k-25k, 0.3% for AGIs $25k-50k, 0.1% for AGIs $50k-75k, 0.2% for AGIs $75k-100k)
Self-employed pension: $15,045 (reported on 0.4% of returns)
Here:
$15,045
Pennsylvania:
$14,674
Total itemized deductions: $14,776 (19% of AGI, reported on 25.4% of returns)
Here:
$14,776
State:
$18,804
Here:
19.0% of AGI
State:
19.5% of AGI
(% of AGI for various income ranges: 7.3% for AGIs below $10k, 6.1% for AGIs $10k-25k, 7.8% for AGIs $25k-50k, 10.1% for AGIs $50k-75k, 11.2% for AGIs $75k-100k, 11.1% for AGIs over 100k)
Charity contributions deductions: $2,210 (3% of AGI, reported on 23.4% of returns)
Here:
$2,210
State:
$3,337
Here:
2.8% of AGI
State:
3.3% of AGI
(% of AGI for various income ranges: 0.6% for AGIs below $10k, 0.7% for AGIs $10k-25k, 0.8% for AGIs $25k-50k, 1.3% for AGIs $50k-75k, 1.6% for AGIs $75k-100k, 1.9% for AGIs over 100k)
Total tax: $5,683 (reported on 74.3% of returns)
15065:
$5,683
State:
$8,008
(% of AGI for various income ranges: 1.9% for AGIs below $10k, 4.0% for AGIs $10k-25k, 7.2% for AGIs $25k-50k, 9.2% for AGIs $50k-75k, 10.5% for AGIs $75k-100k, 19.4% for AGIs over 100k)
Earned income credit: $1,554 (reported on 12.7% of returns)
Here:
$1,554
State:
$1,643
Percentage of individuals using paid preparers for their 2004 taxes: 52.3%
Here:
52%
State:
56%
(% for various income ranges: 47.5% for AGIs below $10k, 52.0% for AGIs $10k-25k, 49.8% for AGIs $25k-50k, 57.0% for AGIs $50k-75k, 54.9% for AGIs $75k-100k, 68.5% for AGIs over 100k)
Household received Food Stamps/SNAP in the past 12 months: 798 Household did not receive Food Stamps/SNAP in the past 12 months: 4,234
Women who had a birth in the past 12 months: 80 (60 now married, 20 unmarried) Women who did not have a birth in the past 12 months: 2,143 (990 now married, 1,148 unmarried)
Housing units in zip code 15065 with a mortgage: 2,036 (196 second mortgage, 10 home equity loan, 168 both second mortgage and home equity loan) Houses without a mortgage: 218
Median monthly owner costs for units with a mortgage: $1,253 Median monthly owner costs for units without a mortgage: $522
Residents with income below the poverty level in 2022:
This zip code:
10.9%
Whole state:
11.8%
Residents with income below 50% of the poverty level in 2022:
This zip code:
5.6%
Whole state:
6.1%
Median number of rooms in houses and condos:
Here:
6.5
State:
6.8
Median number of rooms in apartments:
Here:
4.1
State:
4.3
Notable locations in this zip code not listed on our city pages
Notable locations in zip code 15065: Brackenridge Golf Course (A), Highlands Senior High School Library (B), Polish Roman Catholic Union Branch Number 224 (C), Citizens Hose Volunteer Fire Department 2 (D), Hilltop Hose Company 3 Station 168 (E), Fawn Township Volunteer Fire Company 2 (F), Harrison Hills Volunteer Fire Company 4 Station 169 (G). Display/hide their locations on the map
Churches in zip code 15065 include: Saint Joseph Church (A), Our Lady of the Most Blessed Sacrament Church (B), Natrona Heights Presbyterian Church (C), Kingdom Hall Church (D), Faith Evangelical Lutheran Church (E), Calvary Baptist Church (F), Saint Ladislaus Church (G), Center Church (H), Calvary Church (I). Display/hide their locations on the map
In group quarters: 68 (-1 institutionalized population)
Size of family households: 1,858 2-persons, 579 3-persons, 464 4-persons, 205 5-persons, 72 6-persons, 6 7-or-more-persons
Size of nonfamily households: 1,674 1-person, 133 2-persons, 33 3-persons
1,080 married couples with children.
649 single-parent households (347 men, 302 women).
96.6% of residents of 15065 zip code speak English at home.
0.7% of residents speak Spanish at home (88% very well, 12% not well).
0.8% of residents speak other Indo-European language at home (98% very well, 2% well).
1.3% of residents speak Asian or Pacific Island language at home (50% very well, 32% well, 18% not well).
0.1% of residents speak other language at home (100% very well).
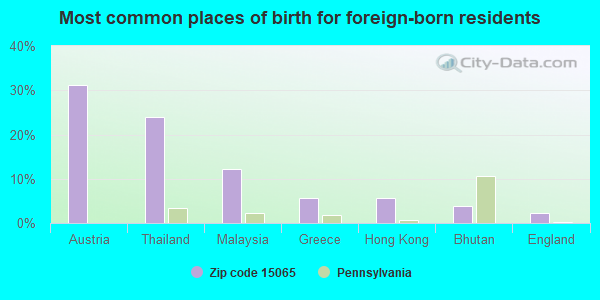
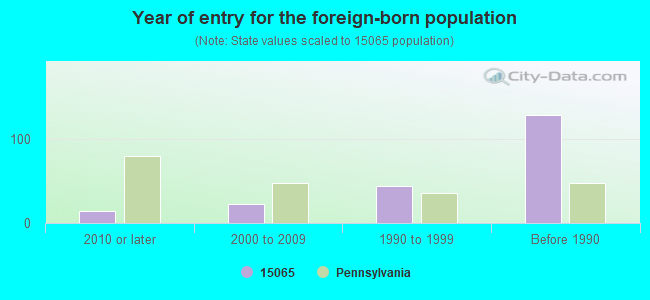
Foreign born population: 180 (1.6%) (71.4% of them are naturalized citizens)
This zip code:
1.6%
Whole state:
7.5%
31%Austria
24%Thailand
12%Malaysia
6%Greece
6%Hong Kong
4%Bhutan
2%England
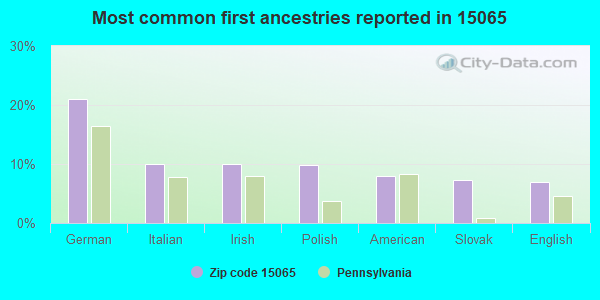
21%German
10%Italian
10%Irish
10%Polish
8%American
7%Slovak
7%English
Year of entry for the foreign-born population
142010 or later
232000 to 2009
441990 to 1999
128Before 1990
Facilities with environmental interests located in this zip code:
ALSCO PARK LINDANE SITE (SPRINGHILL & KARNS RDS in NATRONA HEIGHTS, PA)
STATE MASTER (Pennsylvania database) - RCRIS-PAD982569956, HAZARDOUS WASTE PROGRAM Conditionally Exempt Small Quantity Generators, less than 100 kg/month of hazardous waste (Resource Conservation and Recovery Act (tracking hazardous waste)) - notification Organizations: OPERNAME (CONTACT/OPERATOR)
, HARRISON TOWNSHIP/ALLEGHENY LUDLUM (CONTACT/OWNER)
AIRCO INDUSTRIAL GASES (101 NORTH CANAL STREET in NATRONA, PA)
AIR MINOR (AIRS/AFS) Conditionally Exempt Small Quantity Generators, less than 100 kg/month of hazardous waste (Resource Conservation and Recovery Act (tracking hazardous waste)) - notification Business SIC classification: INDUSTRIAL GASES Organizations: OPERNAME (CONTACT/OPERATOR)
, AIRCO INCORPORATED (CONTACT/OWNER)
ALLEGHENY LUDLUM CORP TECHNICAL CENTER (ALABAMA & PACIFIC AVENUE in NATRONA HEIGHTS, PA)
HAZARDOUS WASTE BIENNIAL REPORTER (Resource Conservation and Recovery Act (tracking hazardous waste)) Large Quantity Generators, more that 1000 kg of hazardous waste/month (Resource Conservation and Recovery Act (tracking hazardous waste)) - notification Alternative names: ALLEGHENY LUDLUM CORPORATION, ALLEGHENY LUDLUM TECH CNTR
ALLEGHENY VALLEY HOSPITAL (1301 CARLISLE STREET in NATRONA HEIGHTS, PA)
AIR MINOR (AIRS/AFS) CRITERIA AND HAZARDOUS AIR POLLUTANT INVENTORY (Inventory of air pollution sources) Business SIC classification: GENERAL MEDICAL AND SURGICAL HOSPITALS
Housing units lacking complete plumbing facilities: 3.7% Housing units lacking complete kitchen facilities: 1.8%
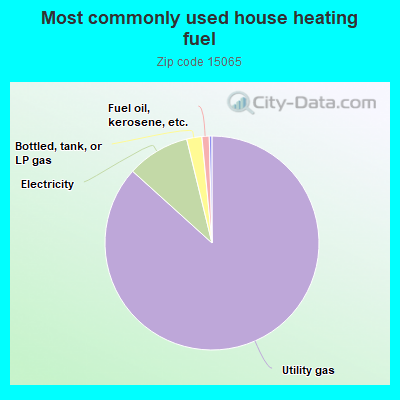
86.7%Utility gas
9.5%Electricity
2.3%Bottled, tank, or LP gas
1.1%Fuel oil, kerosene, etc.
Population in 1990: 13,305.
Place of birth for U.S.-born residents:
This state: 9,797
Northeast: 386
Midwest: 313
South: 167
West: 110
70% of the 15065 zip code residents lived in the same house 5 years ago. Out of people who lived in different houses, 68% lived in this county. Out of people who lived in different counties, 50% lived in Pennsylvania.
92% of the 15065 zip code residents lived in the same house 1 year ago. Out of people who lived in different houses, 47% moved from this county. Out of people who lived in different houses, 29% moved from different county within same state. Out of people who lived in different houses, 24% moved from different state. Out of people who lived in different houses, 0% moved from abroad.
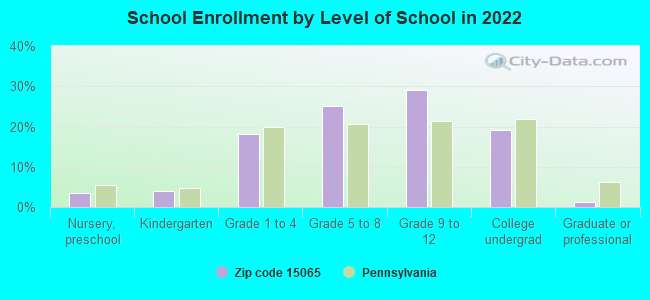
Private vs. public school enrollment:
Students in private schools in grades 1 to 8 (elementary and middle school): 53
Here:
6.3%
Pennsylvania:
15.7%
Students in private schools in grades 9 to 12 (high school): 12
Here:
2.1%
Pennsylvania:
13.4%
Students in private undergraduate colleges: 148
Here:
39.1%
Pennsylvania:
39.8%
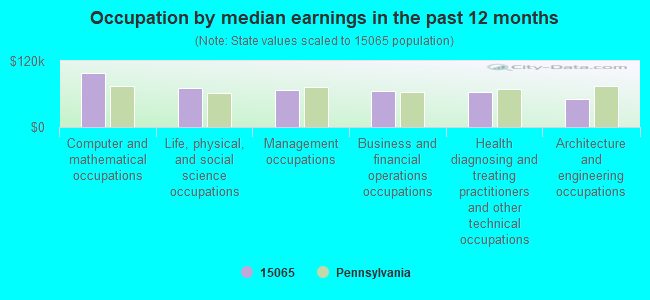
Occupation by median earnings in the past 12 months ($)
98,615Computer and mathematical occupations
71,199Life, physical, and social science occupations
66,487Management occupations
66,320Business and financial operations occupations
63,502Health diagnosing and treating practitioners and other technical occupations
51,375Architecture and engineering occupations
Companies with federal contracts located in this zip code:
ABB AUTOMATION,INC (2 ACEE DRIVE in NATRONA HEIGHT, PA) : $77,852 in 2 contractsin 2001
$53,460 with Navy for Power and Hand Pumps. Signed on 2001-03-05. Completion date: 2001-06-18.
$24,392 with Navy for Electrical and Electronic Properties Measuring and Testing Instruments. Signed on 2001-10-09. Completion date: 2001-10-10.
A B B AUTOMATION INC (2 ACEE DR in NATRONA HEIGHT, PA) : $4,549 in 2 contractsin 2003
$3,840 with Navy for Maintenance, Repair and Rebuilding of Equipment -- Miscellaneous. Signed on 2003-07-10. Completion date: 2003-07-10.
$709, same as above.Signed on 2003-07-17. Completion date: 2003-07-17.
TOYO TANSO SPECIALTY MATERIALS (10 ACEE DRIVE in NATRONA HEIGHT, PA; small business)
$3,568 with Navy for Other Defense -- Applied Research and Exploratory Development (R&D). Signed on 2005-04-06. Completion date: 2005-06-01.
Top industries in this zip code by the number of employees in 2005:
Health Care and Social Assistance: General Medical and Surgical Hospitals (over 1000 employees: 1 establishment)
Other Services (except Public Administration): Religious Organizations (100-249: 1, 20-49: 1, 10-19: 1, 5-9: 4, 1-4: 3)
Health Care and Social Assistance: Offices of Physicians (except Mental Health Specialists) (20-49: 4, 10-19: 3, 5-9: 7, 1-4: 8)
2003 - 2018 National Fire Incident Reporting System (NFIRS) incidents
Based on the data from the years 2003 - 2018 the average number of fires per year is 20. The highest number of reported fire incidents - 56 took place in 2016, and the least - 2 in 2007. The data has a rising trend.
When looking into fire subcategories, the most reports belonged to: Structure Fires (60.1%), and Outside Fires (18.9%).
Fire incident types reported to NFIRS in Zip Code 15065


 Nearest zip codes: 15014, 16055, 15030, 15084, 15068, 15656.


 Based on the data from the years 2003 - 2018 the average number of fires per year is 20. The highest number of reported fire incidents - 56 took place in 2016, and the least - 2 in 2007. The data has a rising trend.
 When looking into fire subcategories, the most reports belonged to: Structure Fires (60.1%), and Outside Fires (18.9%).