Estimated zip code population in 2022: 21,794 Zip code population in 2010: 20,395 Zip code population in 2000: 20,616
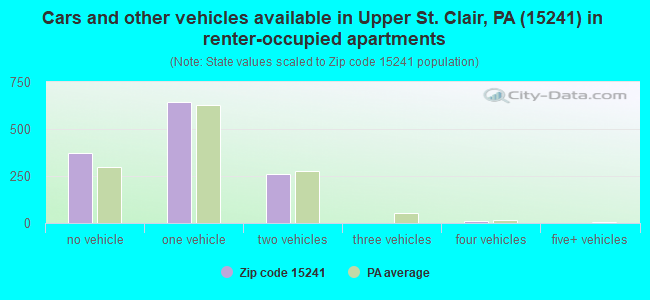
Houses and condos: 8,774 Renter-occupied apartments: 1,279
% of renters here:
15%
State:
31%
March 2022 cost of living index in zip code 15241: 96.3 (near average, U.S. average is 100)
Land area: 10.4 sq. mi. Water area: 0.0 sq. mi.
Population density: 2,095 people per square mile
(low).
OSM Map
General Map
Google Map
MSN Map
OSM Map
General Map
Google Map
MSN Map
OSM Map
General Map
Google Map
MSN Map
OSM Map
General Map
Google Map
MSN Map
Please wait while loading the map...
Real estate property taxes paid for housing units in 2022:
This zip code:
1.9% ($7,617)
Pennsylvania:
1.3% ($3,094)
Median real estate property taxes paid for housing units with mortgages in 2022: $7,971 (2.0%) Median real estate property taxes paid for housing units with no mortgage in 2022: $7,141 (1.9%)
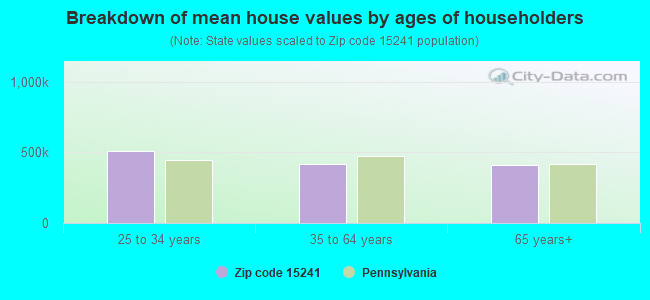
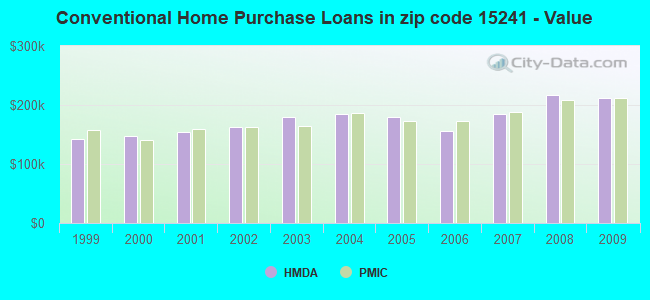
Estimated median house/condo value in 2022: $395,926
15241:
$395,926
Pennsylvania:
$245,500
According to our research of Pennsylvania and other state lists, there were 3 registered sex offenders living in 15241 zip code as of April 27, 2024. The ratio of all residents to sex offenders in zip code 15241 is 6,939 to 1. The ratio of registered sex offenders to all residents in this zip code is much lower than the state average.
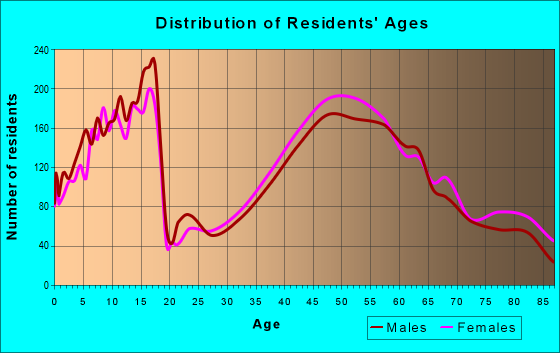
Median resident age:
This zip code:
44.7 years
Pennsylvania median age:
40.9 years
Average household size:
This zip code:
2.6 people
Pennsylvania:
2.4 people
Averages for the 2020 tax year for zip code 15241, filed in 2021:
Average Adjusted Gross Income (AGI) in 2020: $166,630 (Individual Income Tax Returns)
Here:
$166,630
State:
$75,707
Salary/wage: $130,248 (reported on 78.4% of returns)
Here:
$130,248
State:
$62,806
(% of AGI for various income ranges: 1230.6% for AGIs below $25k, 3468.8% for AGIs $25k-50k, 6020.9% for AGIs $50k-75k, 8859.5% for AGIs $75k-100k, 18764.8% for AGIs $100k-200k, 104503.5% for AGIs over 200k)
Taxable interest for individuals: $3,581 (reported on 53.3% of returns)
This zip code:
$3,581
Pennsylvania:
$1,633
(% of AGI for various income ranges: 39.8% for AGIs below $25k, 74.0% for AGIs $25k-50k, 87.4% for AGIs $50k-75k, 137.0% for AGIs $75k-100k, 202.7% for AGIs $100k-200k, 2296.5% for AGIs over 200k)
Ordinary dividends: $12,980 (reported on 48.5% of returns)
Here:
$12,980
State:
$7,382
(% of AGI for various income ranges: 113.2% for AGIs below $25k, 199.3% for AGIs $25k-50k, 321.9% for AGIs $50k-75k, 531.8% for AGIs $75k-100k, 728.5% for AGIs $100k-200k, 7430.3% for AGIs over 200k)
Net capital gain/loss in AGI: +$34,712 (reported on 44.0% of returns)
Here:
+$34,712
State:
+$23,522
(% of AGI for various income ranges: 68.1% for AGIs below $25k, 215.2% for AGIs $25k-50k, 213.2% for AGIs $50k-75k, 429.6% for AGIs $75k-100k, 946.1% for AGIs $100k-200k, 21906.3% for AGIs over 200k)
Profit/loss from business: +$28,603 (reported on 17.0% of returns)
Here:
+$28,603
State:
+$16,274
(% of AGI for various income ranges: 88.8% for AGIs below $25k, 209.9% for AGIs $25k-50k, 310.3% for AGIs $50k-75k, 492.9% for AGIs $75k-100k, 685.5% for AGIs $100k-200k, 5225.5% for AGIs over 200k)
Taxable individual retirement arrangement distribution: $33,925 (reported on 15.7% of returns)
15241:
$33,925
Pennsylvania:
$18,583
(% of AGI for various income ranges: 106.2% for AGIs below $25k, 265.1% for AGIs $25k-50k, 570.1% for AGIs $50k-75k, 924.6% for AGIs $75k-100k, 1287.4% for AGIs $100k-200k, 3916.2% for AGIs over 200k)
Self-employed (Keogh) retirement plans: $27,841 (reported on 2.1% of returns)
15241:
$27,841
Pennsylvania:
$25,407
(% of AGI for various income ranges: 61.6% for AGIs $100k-200k, 802.9% for AGIs over 200k)
Total itemized deductions: $44,619 (reported on 16.4% of returns)
Here:
$44,619
State:
$34,850
(% of AGI for various income ranges: 160.0% for AGIs below $25k, 314.4% for AGIs $25k-50k, 643.9% for AGIs $50k-75k, 789.6% for AGIs $75k-100k, 926.2% for AGIs $100k-200k, 7852.6% for AGIs over 200k)
Charity contributions: $16,609 (reported on 14.2% of returns)
Here:
$16,609
State:
$12,392
(% of AGI for various income ranges: 10.4% for AGIs below $25k, 22.0% for AGIs $25k-50k, 76.2% for AGIs $50k-75k, 94.8% for AGIs $75k-100k, 200.1% for AGIs $100k-200k, 3195.5% for AGIs over 200k)
Taxes paid: $8,534 (reported on 16.4% of returns)
15241:
$8,534
State:
$8,200
(% of AGI for various income ranges: 24.3% for AGIs below $25k, 59.8% for AGIs $25k-50k, 147.8% for AGIs $50k-75k, 192.0% for AGIs $75k-100k, 258.7% for AGIs $100k-200k, 1268.0% for AGIs over 200k)
Earned income credit: $1,550 (reported on 3.4% of returns)
Here:
$1,550
State:
$2,100
(% of AGI for various income ranges: 23.2% for AGIs below $25k, 33.3% for AGIs $25k-50k)
Percentage of individuals using paid preparers for their 2020 taxes: 90.2%
Here:
90%
State:
92%
(% for various income ranges: 88.5% for AGIs below $25k, 89.7% for AGIs $25k-50k, 89.7% for AGIs $50k-75k, 90.5% for AGIs $75k-100k, 90.7% for AGIs $100k-200k, 91.6% for AGIs over 200k)
Averages for the 2012 tax year for zip code 15241, filed in 2013:
Average Adjusted Gross Income (AGI) in 2012: $164,110 (Individual Income Tax Returns)
Here:
$164,110
State:
$61,346
Salary/wage: $111,685 (reported on 78.5% of returns)
Here:
$111,685
State:
$51,902
(% of AGI for various income ranges: 64.7% for AGIs below $25k, 61.4% for AGIs $25k-50k, 60.6% for AGIs $50k-75k, 63.6% for AGIs $75k-100k, 73.0% for AGIs $100k-200k, 45.6% for AGIs over 200k)
Taxable interest for individuals: $3,385 (reported on 57.0% of returns)
This zip code:
$3,385
Pennsylvania:
$1,588
(% of AGI for various income ranges: 3.1% for AGIs below $25k, 1.9% for AGIs $25k-50k, 1.5% for AGIs $50k-75k, 1.3% for AGIs $75k-100k, 0.6% for AGIs $100k-200k, 1.2% for AGIs over 200k)
Ordinary dividends: $15,301 (reported on 50.0% of returns)
Here:
$15,301
State:
$5,827
(% of AGI for various income ranges: 7.2% for AGIs below $25k, 4.8% for AGIs $25k-50k, 4.2% for AGIs $50k-75k, 3.6% for AGIs $75k-100k, 2.7% for AGIs $100k-200k, 5.3% for AGIs over 200k)
Net capital gain/loss in AGI: +$45,844 (reported on 40.9% of returns)
Here:
+$45,844
State:
+$14,495
(% of AGI for various income ranges: 0.4% for AGIs below $25k, 0.7% for AGIs $25k-50k, 1.2% for AGIs $50k-75k, 1.3% for AGIs $75k-100k, 1.5% for AGIs $100k-200k, 16.6% for AGIs over 200k)
Profit/loss from business: +$36,605 (reported on 16.9% of returns)
Here:
+$36,605
State:
+$16,268
(% of AGI for various income ranges: 5.7% for AGIs below $25k, 5.4% for AGIs $25k-50k, 4.4% for AGIs $50k-75k, 4.3% for AGIs $75k-100k, 5.0% for AGIs $100k-200k, 3.2% for AGIs over 200k)
Taxable individual retirement arrangement distribution: $29,430 (reported on 18.9% of returns)
15241:
$29,430
Pennsylvania:
$14,550
(% of AGI for various income ranges: 5.8% for AGIs below $25k, 6.7% for AGIs $25k-50k, 7.0% for AGIs $50k-75k, 6.6% for AGIs $75k-100k, 4.4% for AGIs $100k-200k, 2.4% for AGIs over 200k)
Self-employment retirement plans: $23,155 (reported on 2.9% of returns)
15241:
$23,155
Pennsylvania:
$20,922
(% of AGI for various income ranges: 0.5% for AGIs $75k-100k, 0.4% for AGIs $100k-200k, 0.4% for AGIs over 200k)
Total itemized deductions: $34,845 (13% of AGI, reported on 57.5% of returns)
Here:
$34,845
State:
$23,538
Here:
13.3% of AGI
State:
18.4% of AGI
(% of AGI for various income ranges: 23.6% for AGIs below $25k, 19.1% for AGIs $25k-50k, 17.5% for AGIs $50k-75k, 17.5% for AGIs $75k-100k, 16.2% for AGIs $100k-200k, 9.7% for AGIs over 200k)
Charity contributions: $6,291 (reported on 52.0% of returns)
Here:
$6,291
State:
$4,025
(% of AGI for various income ranges: 1.4% for AGIs below $25k, 1.8% for AGIs $25k-50k, 1.9% for AGIs $50k-75k, 1.9% for AGIs $75k-100k, 2.0% for AGIs $100k-200k, 2.0% for AGIs over 200k)
Taxes paid: $17,857 (reported on 57.1% of returns)
15241:
$17,857
State:
$9,982
(% of AGI for various income ranges: 6.2% for AGIs below $25k, 6.5% for AGIs $25k-50k, 6.8% for AGIs $50k-75k, 7.8% for AGIs $75k-100k, 8.4% for AGIs $100k-200k, 5.4% for AGIs over 200k)
Earned income credit: $1,638 (reported on 3.6% of returns)
Here:
$1,638
State:
$2,106
(% of AGI for various income ranges: 1.8% for AGIs below $25k, 0.4% for AGIs $25k-50k)
Percentage of individuals using paid preparers for their 2012 taxes: 54.5%
Here:
55%
State:
53%
(% for various income ranges: 47.6% for AGIs below $25k, 52.0% for AGIs $25k-50k, 54.3% for AGIs $50k-75k, 54.0% for AGIs $75k-100k, 52.9% for AGIs $100k-200k, 71.9% for AGIs over 200k)
Averages for the 2004 tax year for zip code 15241, filed in 2005:
Average Adjusted Gross Income (AGI) in 2004: $111,961 (Individual Income Tax Returns)
Here:
$111,961
State:
$48,049
Salary/wage: $93,286 (reported on 75.0% of returns)
Here:
$93,286
State:
$42,646
(% of AGI for various income ranges: 323.8% for AGIs below $10k, 51.4% for AGIs $10k-25k, 56.7% for AGIs $25k-50k, 61.8% for AGIs $50k-75k, 69.0% for AGIs $75k-100k, 61.7% for AGIs over 100k)
Taxable interest for individuals: $3,663 (reported on 71.5% of returns)
This zip code:
$3,663
Pennsylvania:
$1,657
(% of AGI for various income ranges: 68.3% for AGIs below $10k, 7.0% for AGIs $10k-25k, 4.2% for AGIs $25k-50k, 2.9% for AGIs $50k-75k, 1.8% for AGIs $75k-100k, 2.0% for AGIs over 100k)
Taxable dividends: $7,758 (reported on 60.0% of returns)
Here:
$7,758
State:
$3,566
(% of AGI for various income ranges: 65.6% for AGIs below $10k, 7.7% for AGIs $10k-25k, 5.1% for AGIs $25k-50k, 4.1% for AGIs $50k-75k, 3.6% for AGIs $75k-100k, 3.9% for AGIs over 100k)
Net capital gain/loss: +$24,513 (reported on 50.5% of returns)
Here:
+$24,513
State:
+$9,716
(% of AGI for various income ranges: -9.0% for AGIs below $10k, 0.9% for AGIs $10k-25k, 1.6% for AGIs $25k-50k, 2.1% for AGIs $50k-75k, 2.1% for AGIs $75k-100k, 13.6% for AGIs over 100k)
Profit/loss from business: +$28,328 (reported on 17.9% of returns)
Here:
+$28,328
State:
+$14,267
(% of AGI for various income ranges: 1.6% for AGIs below $10k, 8.7% for AGIs $10k-25k, 6.9% for AGIs $25k-50k, 5.5% for AGIs $50k-75k, 4.7% for AGIs $75k-100k, 4.2% for AGIs over 100k)
IRA payment deduction: $3,552 (reported on 3.8% of returns)
15241:
$3,552
Pennsylvania:
$2,903
(% of AGI for various income ranges: 1.5% for AGIs below $10k, 0.3% for AGIs $10k-25k, 0.4% for AGIs $25k-50k, 0.3% for AGIs $50k-75k, 0.3% for AGIs $75k-100k, 0.1% for AGIs over 100k)
Self-employed pension: $17,943 (reported on 3.5% of returns)
Here:
$17,943
Pennsylvania:
$14,674
(% of AGI for various income ranges: 0.1% for AGIs $10k-25k, 0.3% for AGIs $25k-50k, 0.3% for AGIs $50k-75k, 0.4% for AGIs $75k-100k, 0.6% for AGIs over 100k)
Total itemized deductions: $25,706 (15% of AGI, reported on 57.9% of returns)
Here:
$25,706
State:
$18,804
Here:
14.6% of AGI
State:
19.5% of AGI
(% of AGI for various income ranges: 68.6% for AGIs below $10k, 23.5% for AGIs $10k-25k, 22.8% for AGIs $25k-50k, 20.5% for AGIs $50k-75k, 19.6% for AGIs $75k-100k, 11.1% for AGIs over 100k)
Charity contributions deductions: $4,896 (3% of AGI, reported on 55.0% of returns)
Here:
$4,896
State:
$3,337
Here:
2.7% of AGI
State:
3.3% of AGI
(% of AGI for various income ranges: 3.4% for AGIs below $10k, 2.1% for AGIs $10k-25k, 2.6% for AGIs $25k-50k, 2.3% for AGIs $50k-75k, 2.8% for AGIs $75k-100k, 2.4% for AGIs over 100k)
Total tax: $25,987 (reported on 80.2% of returns)
15241:
$25,987
State:
$8,008
(% of AGI for various income ranges: 11.6% for AGIs below $10k, 4.9% for AGIs $10k-25k, 7.2% for AGIs $25k-50k, 8.7% for AGIs $50k-75k, 9.5% for AGIs $75k-100k, 21.4% for AGIs over 100k)
Earned income credit: $1,183 (reported on 3.0% of returns)
Here:
$1,183
State:
$1,643
Percentage of individuals using paid preparers for their 2004 taxes: 55.9%
Here:
56%
State:
56%
(% for various income ranges: 51.5% for AGIs below $10k, 54.3% for AGIs $10k-25k, 56.7% for AGIs $25k-50k, 55.3% for AGIs $50k-75k, 50.7% for AGIs $75k-100k, 61.8% for AGIs over 100k)
Likely homosexual households (counted as self-reported same-sex unmarried-partner households)
Lesbian couples: 0.0% of all households
Gay men: 0.1% of all households
Household received Food Stamps/SNAP in the past 12 months: 183 Household did not receive Food Stamps/SNAP in the past 12 months: 8,172
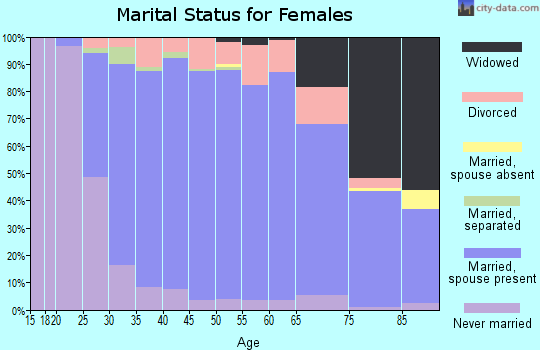
Women who had a birth in the past 12 months: 208 (202 now married, 15 unmarried) Women who did not have a birth in the past 12 months: 3,942 (2,254 now married, 1,664 unmarried)
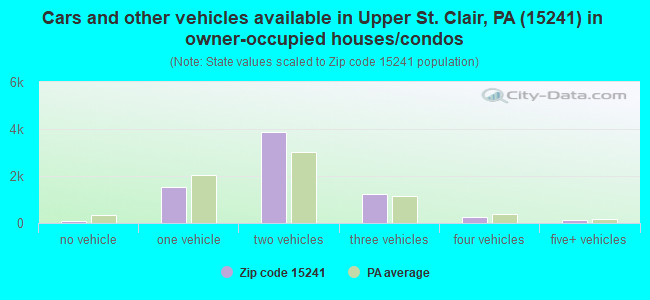
Housing units in zip code 15241 with a mortgage: 4,167 (701 second mortgage, 29 home equity loan, 642 both second mortgage and home equity loan) Houses without a mortgage: 252
Median monthly owner costs for units with a mortgage: $2,447 Median monthly owner costs for units without a mortgage: $1,005
Residents with income below the poverty level in 2022:
This zip code:
2.3%
Whole state:
11.8%
Residents with income below 50% of the poverty level in 2022:
This zip code:
0.4%
Whole state:
6.1%
Median number of rooms in houses and condos:
Here:
8.3
State:
6.8
Median number of rooms in apartments:
Here:
3.6
State:
4.3
Notable locations in this zip code not listed on our city pages
Notable locations in zip code 15241: Hidden Valley Golf Course (A), Wingfield Pines Golf Course (B), Panhandle (C), Saint Clair Country Club (D), Dorchester Station (E), Santa Barbara Station (F), Drake Loop (G), Montessori Early Childhood Center (H), Upper Saint Clair Township Hall (I), Upper Saint Clair Township Library (J), Upper Saint Clair Township Police Department (K), Westminster Presbyterian Church Day Care Center (L), Upper Saint Clair Volunteer Fire Department Station 284 (M), Upper Saint Clair Volunteer Fire Department Substation 284 (N). Display/hide their locations on the map
Churches in zip code 15241 include: South Hills Community Baptist Church (A), Saint Thomas More Church (B), Saint Gregory Byzantine Catholic Church (C), Rectory New Apostolic Church (D), Westminister Church (E), New Day Assembly of God Church (F), Good Shepherd Church (G), Christian and Missionary Alliance Church (H), Saint John Capistran Church (I). Display/hide their locations on the map
In group quarters: 84 (-1 institutionalized population)
Size of family households: 2,694 2-persons, 1,247 3-persons, 1,437 4-persons, 526 5-persons, 168 6-persons, 35 7-or-more-persons
Size of nonfamily households: 1,940 1-person, 291 2-persons, 25 3-persons
4,613 married couples with children.
435 single-parent households (98 men, 337 women).
88.9% of residents of 15241 zip code speak English at home.
1.1% of residents speak Spanish at home (84% very well, 11% well, 4% not well).
5.4% of residents speak other Indo-European language at home (86% very well, 8% well, 6% not well).
3.7% of residents speak Asian or Pacific Island language at home (65% very well, 27% well, 8% not well, 1% not at all).
0.5% of residents speak other language at home (76% very well, 24% well).
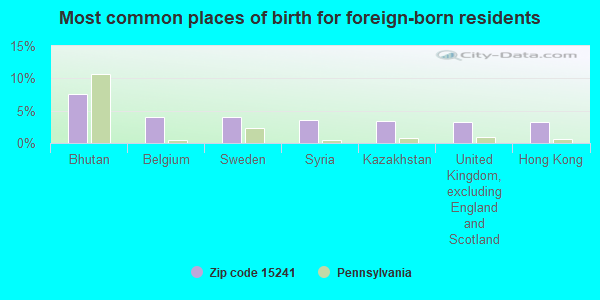
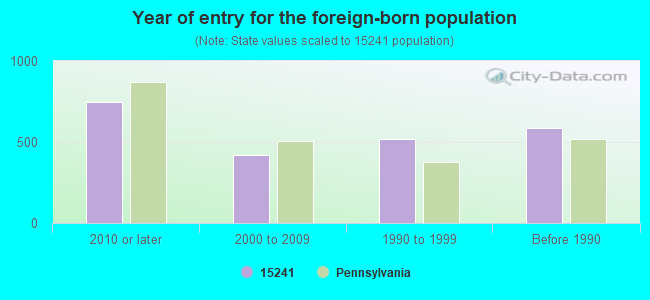
Foreign born population: 2,089 (9.6%) (68.8% of them are naturalized citizens)
Facilities with environmental interests located in this zip code:
ALLEGHENY CNTY PORT AUTH S HILLS GARAGE (1000 VILLAGE DRIVE in PITTSBURGH, PA)
AIR MINOR (AIRS/AFS) STATE MASTER (Pennsylvania database) - RCRIS-PAD981105968, HAZARDOUS WASTE PROGRAM HAZARDOUS WASTE BIENNIAL REPORTER (Resource Conservation and Recovery Act (tracking hazardous waste)) Large Quantity Generators, more that 1000 kg of hazardous waste/month (Resource Conservation and Recovery Act (tracking hazardous waste)) - notification Business SIC classification: LOCAL AND SUBURBAN TRANSIT Organizations: PORT AUTHORITY OF ALLEGHENT COUNTY (CONTACT/OPERATOR)
, PORT AUTHORITY OF ALLEGHENY COUNTY (CONTACT/OWNER)
Alternative names: PORT AUTHORITY ALLEGHENY COUNTY, PORT AUTH S HILLS VILLAGE, PORT AUTHORITY - SH VILLAGE RAIL_JUNCTN, PORT AUTHORITY SOUTH HILLS VILLAGE RAIL
BAKER EL SCH (2300 MORTON RD in PITTSBURGH, PA)
(National Center for Education Statistics) - STATE ID-5195 Organizations: UPPER SAINT CLAIR SD (SCHOOL DISTRICT)
ALLEGHENY LIQUID SYSTEMS, INC (1815 WASHINGTON ROAD in PITTSBURGH, PA)
AIR MINOR (AIRS/AFS) Business SIC classification: REFUSE SYSTEMS
ALLENS AUTO SERVICE (145 MCMURRAY RD in PITTSBURGH, PA)
AIR MINOR (AIRS/AFS) Business SIC classification: GASOLINE SERVICE STATIONS
CONSOLIDATION COAL COMPANY (1800 WASHINGTON ROAD in PITTSBURGH, WV)
AIR MINOR (AIRS/AFS)
BEST OIL INC. #6_- TOOT N SCOOT (1909 PAINTERS RUN RD in PITTSBURGH, PA)
AIR MINOR (AIRS/AFS) Business SIC classification: GASOLINE SERVICE STATIONS
BLACK BOX CORP (MAYVIEW ROAD @ PARK DRIVE in PITTSBURGH, PA)
Small Quantity Generators, between 100 kg and 1000 kg of hazardous waste/month (Resource Conservation and Recovery Act (tracking hazardous waste)) - notification Organizations: OPERNAME (CONTACT/OPERATOR)
, WILSON, JAMES (CONTACT/OWNER)
ALMEGA CO INC THE (1337 MCLAUGHLIN RUN RD in PITTSBURGH, PA)
Conditionally Exempt Small Quantity Generators, less than 100 kg/month of hazardous waste (Resource Conservation and Recovery Act (tracking hazardous waste)) - notification Organizations: THE ALMEGA CO INC (CONTACT/OWNER)
AMER STRESS TECH (61 MCMURRAY ROAD in PITTSBURGH, PA)
Conditionally Exempt Small Quantity Generators, less than 100 kg/month of hazardous waste (Resource Conservation and Recovery Act (tracking hazardous waste)) - notification Organizations: DICRO DEVELOPMENT (CONTACT/OWNER)
Housing units lacking complete plumbing facilities: 0.6% Housing units lacking complete kitchen facilities: 2.0%
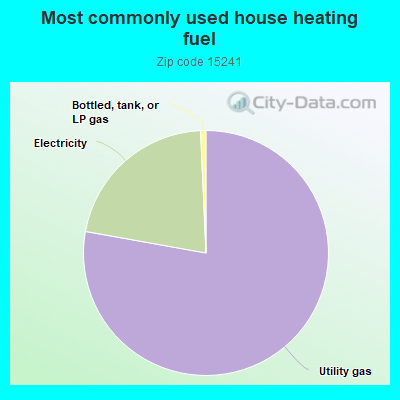
77.2%Utility gas
21.3%Electricity
0.7%Bottled, tank, or LP gas
Population in 1990: 20,276. Population change in the 1990s: +340 (+1.7%).
Place of birth for U.S.-born residents:
This state: 14,334
Northeast: 1,297
Midwest: 1,574
South: 1,637
West: 699
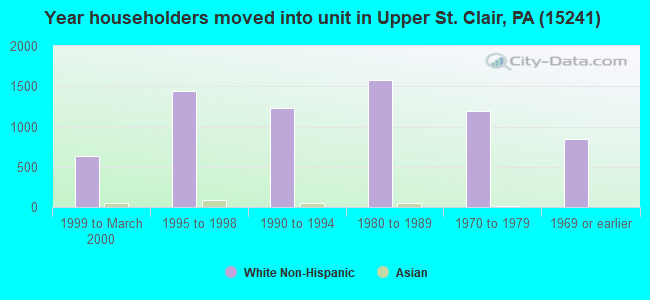
68% of the 15241 zip code residents lived in the same house 5 years ago. Out of people who lived in different houses, 67% lived in this county. Out of people who lived in different counties, 50% lived in Pennsylvania.
92% of the 15241 zip code residents lived in the same house 1 year ago. Out of people who lived in different houses, 78% moved from this county. Out of people who lived in different houses, 8% moved from different county within same state. Out of people who lived in different houses, 7% moved from different state. Out of people who lived in different houses, 7% moved from abroad.
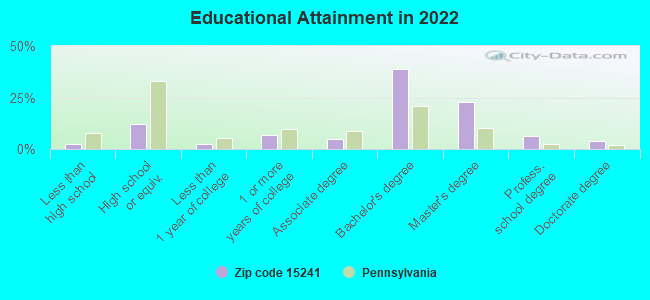
Private vs. public school enrollment:
Students in private schools in grades 1 to 8 (elementary and middle school): 254
Here:
10.1%
Pennsylvania:
15.7%
Students in private schools in grades 9 to 12 (high school): 72
Here:
5.4%
Pennsylvania:
13.4%
Students in private undergraduate colleges: 152
Here:
27.4%
Pennsylvania:
39.8%
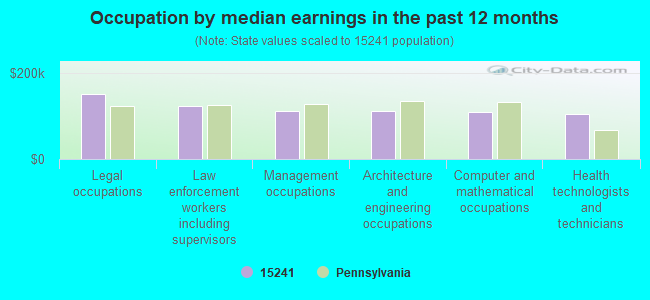
Occupation by median earnings in the past 12 months ($)
152,466Legal occupations
123,109Law enforcement workers including supervisors
112,869Management occupations
110,963Architecture and engineering occupations
109,999Computer and mathematical occupations
104,585Health technologists and technicians
Companies with federal contracts located in this zip code (PITTSBURGH, PA):
MCABE, INC (1517 WOODSDALE DRIVE; small business)
$169,551 with Air Force for Safety and Rescue Equipment. Signed on 2001-09-30. Completion date: 2001-12-31.
INTEGRAN TECHNOLOGIES U S A , (2541 APPLETREE DR; small business)
$99,016 with Air Force for Defense Aircraft -- Basic Research (R&D). Signed on 2006-06-21. Completion date: 2007-02-21.
AVID LEARNER INC (2421 EDGEWOOD DR; small business) : $80,500 in 2 contractsfrom 2004 to 2006
$49,500 with Army for Other Education and Training Services. Taking place in MD. Signed on 2006-02-16. Completion date: 2007-02-28.
$31,000 with Army for Other Education and Training Services. Signed on 2004-09-17. Completion date: 2005-06-01.
SPECIALTY COATING & CONSULTING (1377 MCLAUGHLIN RUN RD 2FL; small business)
$49,804 with Navy for Construction of Structures and Facilities -- Miscellaneous Buildings. Signed on 2004-07-21. Completion date: 2004-09-20.
ENVIRONMENTAL SAFETY SOLUTIONS (1369 MCLAUGHLIN RUN ROAD,; small business)
$7,699 with Army for Construction of Structures and Facilities -- Pollution Abatement and Control Facilities. Signed on 2003-08-15. Completion date: 2003-08-18.
BRAJOVIC, VLADIMIR (513 HARROGATE RD; small business)
$7,500 with Army for Operations Research and Quantitative Analysis Services. Signed on 2002-07-28. Completion date: 2002-10-31.
ROTH ACOUSTICAL ASSOCIATES (STEPHEN ROTH; small business)
$5,500 with Office of the Assistant Secretary for Administration and Management for . Taking place in IL. Signed on 2003-10-29. Effective on 2003-10-30. Completion date: 2003-11-07.
Top industries in this zip code by the number of employees in 2005:
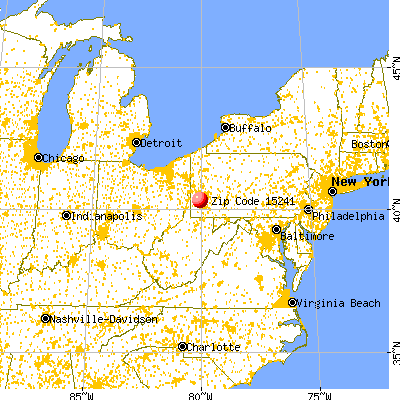


 Nearest zip codes: 15243, 15102, 15017, 15055, 15228, 15142.