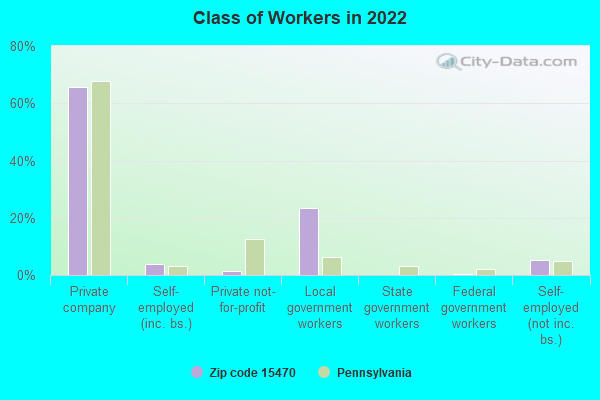
Estimated zip code population in 2022: 602 Zip code population in 2010: 982 Zip code population in 2000: 1,176
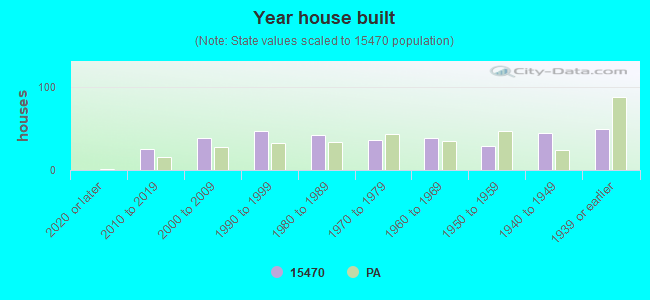
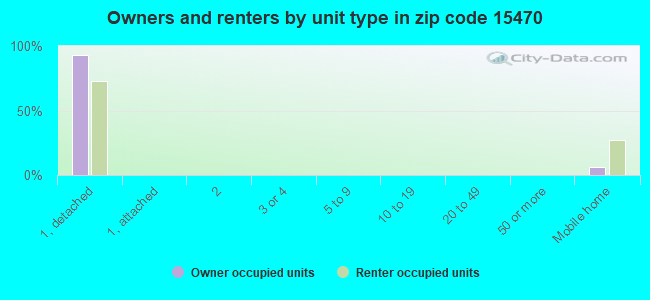
Houses and condos: 351 Renter-occupied apartments: 11
% of renters here:
4%
State:
31%
March 2022 cost of living index in zip code 15470: 86.8 (less than average, U.S. average is 100)
Land area: 31.5 sq. mi. Water area: 0.2 sq. mi.
Population density: 19 people per square mile
(very low).
OSM Map
General Map
Google Map
MSN Map
OSM Map
General Map
Google Map
MSN Map
OSM Map
General Map
Google Map
MSN Map
OSM Map
General Map
Google Map
MSN Map
Please wait while loading the map...
Real estate property taxes paid for housing units in 2022:
This zip code:
1.0% ($2,663)
Pennsylvania:
1.3% ($3,094)
Median real estate property taxes paid for housing units with mortgages in 2022: $2,182 (0.9%) Median real estate property taxes paid for housing units with no mortgage in 2022: $3,185 (0.9%)
Business Search- 14 Million verified businesses
Males: 299
(49.7%)
Females: 302
(50.3%)
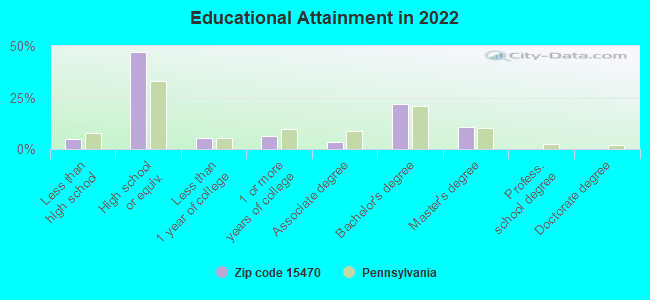
For population 25 years and over in 15470:
High school or higher: 94.3%
Bachelor's degree or higher: 32.5%
Graduate or professional degree: 10.9%
Unemployed: 0.8%
Mean travel time to work (commute): 21.4 minutes
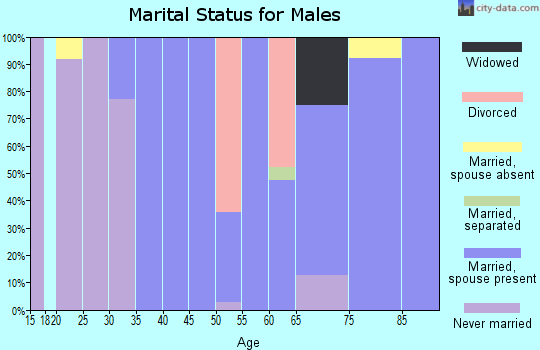
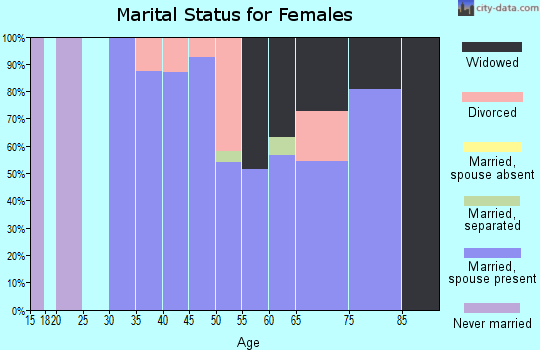
For population 15 years and over in 15470:
Never married: 15.9%
Now married: 71.4%
Separated: 1.1%
Widowed: 8.0%
Divorced: 3.5%
Zip code 15470 compared to state average:
Unemployed percentage significantly below state average.
Black race population percentage significantly below state average.
Hispanic race population percentage significantly below state average.
Median age significantly above state average.
Foreign-born population percentage significantly below state average.
Renting percentage significantly below state average.
Length of stay since moving in significantly below state average.
Number of college students significantly below state average.
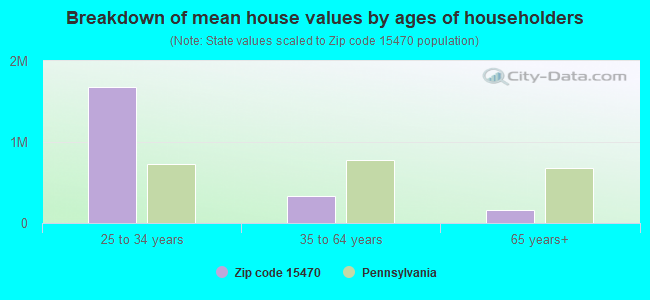
Estimated median house/condo value in 2022: $276,540
15470:
$276,540
Pennsylvania:
$245,500
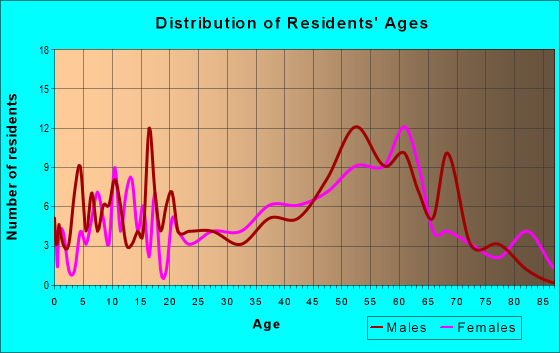
Median resident age:
This zip code:
61.6 years
Pennsylvania median age:
40.9 years
Average household size:
This zip code:
2.2 people
Pennsylvania:
2.4 people
Averages for the 2020 tax year for zip code 15470, filed in 2021:
Average Adjusted Gross Income (AGI) in 2020: $73,082 (Individual Income Tax Returns)
Here:
$73,082
State:
$75,707
Salary/wage: $51,610 (reported on 85.3% of returns)
Here:
$51,610
State:
$62,806
(% of AGI for various income ranges: 1123.3% for AGIs below $25k, 3141.7% for AGIs $25k-50k, 5880.0% for AGIs $50k-75k, 9080.0% for AGIs $75k-100k, 18330.0% for AGIs $100k-200k)
Taxable interest for individuals: $627 (reported on 32.4% of returns)
This zip code:
$627
Pennsylvania:
$1,633
(% of AGI for various income ranges: 10.0% for AGIs below $25k, 26.7% for AGIs $25k-50k, 20.0% for AGIs $50k-75k, 97.5% for AGIs $100k-200k)
Ordinary dividends: $2,071 (reported on 20.6% of returns)
Here:
$2,071
State:
$7,382
(% of AGI for various income ranges: 26.7% for AGIs $25k-50k, 430.0% for AGIs $75k-100k)
Net capital gain/loss in AGI: +$16,840 (reported on 14.7% of returns)
Here:
+$16,840
State:
+$23,522
(% of AGI for various income ranges: 41.7% for AGIs $25k-50k, 2042.5% for AGIs $100k-200k)
Profit/loss from business: +$5,350 (reported on 11.8% of returns)
Here:
+$5,350
State:
+$16,274
(% of AGI for various income ranges: 535.0% for AGIs $50k-75k)
Taxable individual retirement arrangement distribution: $9,650 (reported on 11.8% of returns)
15470:
$9,650
Pennsylvania:
$18,583
(% of AGI for various income ranges: 238.3% for AGIs below $25k, 607.5% for AGIs $50k-75k)
Earned income credit: $1,500 (reported on 5.9% of returns)
Here:
$1,500
State:
$2,100
(% of AGI for various income ranges: 50.0% for AGIs below $25k)
Percentage of individuals using paid preparers for their 2020 taxes: 94.1%
Here:
94%
State:
92%
(% for various income ranges: 90.0% for AGIs below $25k, 87.5% for AGIs $25k-50k, 100.0% for AGIs $50k-75k, 100.0% for AGIs $75k-100k, 100.0% for AGIs $100k-200k)
Averages for the 2012 tax year for zip code 15470, filed in 2013:
Average Adjusted Gross Income (AGI) in 2012: $45,308 (Individual Income Tax Returns)
Here:
$45,308
State:
$61,346
Salary/wage: $38,803 (reported on 84.2% of returns)
Here:
$38,803
State:
$51,902
(% of AGI for various income ranges: 70.7% for AGIs below $25k, 77.8% for AGIs $25k-50k, 77.7% for AGIs $50k-75k, 69.5% for AGIs $75k-100k, 65.6% for AGIs $100k-200k)
Taxable interest for individuals: $700 (reported on 31.6% of returns)
This zip code:
$700
Pennsylvania:
$1,588
(% of AGI for various income ranges: 1.3% for AGIs below $25k, 0.1% for AGIs $25k-50k, 1.4% for AGIs $50k-75k, 0.1% for AGIs $100k-200k)
Ordinary dividends: $1,229 (reported on 18.4% of returns)
Here:
$1,229
State:
$5,827
Net capital gain/loss in AGI: +$3,075 (reported on 10.5% of returns)
Here:
+$3,075
State:
+$14,495
Profit/loss from business: +$7,075 (reported on 10.5% of returns)
Here:
+$7,075
State:
+$16,268
Taxable individual retirement arrangement distribution: $17,550 (reported on 5.3% of returns)
15470:
$17,550
Pennsylvania:
$14,550
Total itemized deductions: $19,783 (21% of AGI, reported on 15.8% of returns)
Here:
$19,783
State:
$23,538
Here:
21.3% of AGI
State:
18.4% of AGI
(% of AGI for various income ranges: 18.6% for AGIs $50k-75k, 9.9% for AGIs $100k-200k)
Charity contributions: $2,600 (reported on 13.2% of returns)
Here:
$2,600
State:
$4,025
(% of AGI for various income ranges: 0.9% for AGIs $25k-50k, 2.8% for AGIs $75k-100k)
Taxes paid: $6,233 (reported on 15.8% of returns)
15470:
$6,233
State:
$9,982
(% of AGI for various income ranges: 4.3% for AGIs $50k-75k, 4.4% for AGIs $100k-200k)
Earned income credit: $2,175 (reported on 10.5% of returns)
Here:
$2,175
State:
$2,106
(% of AGI for various income ranges: 5.7% for AGIs below $25k)
Percentage of individuals using paid preparers for their 2012 taxes: 60.5%
Here:
61%
State:
53%
(% for various income ranges: 50.0% for AGIs below $25k, 60.0% for AGIs $25k-50k, 66.7% for AGIs $50k-75k, 75.0% for AGIs $75k-100k, 75.0% for AGIs $100k-200k)
Averages for the 2004 tax year for zip code 15470, filed in 2005:
Average Adjusted Gross Income (AGI) in 2004: $35,006 (Individual Income Tax Returns)
Here:
$35,006
State:
$48,049
Salary/wage: $31,679 (reported on 85.7% of returns)
Here:
$31,679
State:
$42,646
(% of AGI for various income ranges: 120.7% for AGIs below $10k, 70.2% for AGIs $10k-25k, 82.4% for AGIs $25k-50k, 79.7% for AGIs $50k-75k, 83.9% for AGIs $75k-100k, 64.3% for AGIs over 100k)
Taxable interest for individuals: $594 (reported on 47.3% of returns)
This zip code:
$594
Pennsylvania:
$1,657
(% of AGI for various income ranges: 1.4% for AGIs below $10k, 2.3% for AGIs $10k-25k, 0.7% for AGIs $25k-50k, 0.9% for AGIs $50k-75k, 0.2% for AGIs $75k-100k, 0.2% for AGIs over 100k)
Taxable dividends: $1,481 (reported on 22.6% of returns)
Here:
$1,481
State:
$3,566
(% of AGI for various income ranges: 3.4% for AGIs $10k-25k, 0.3% for AGIs $25k-50k, 0.9% for AGIs $50k-75k, 1.5% for AGIs $75k-100k)
Net capital gain/loss: +$600 (reported on 12.9% of returns)
Here:
+$600
State:
+$9,716
Profit/loss from business: +$4,978 (reported on 12.9% of returns)
Here:
+$4,978
State:
+$14,267
IRA payment deduction: $3,200 (reported on 2.9% of returns)
15470:
$3,200
Pennsylvania:
$2,903
Total itemized deductions: $15,469 (21% of AGI, reported on 18.3% of returns)
Here:
$15,469
State:
$18,804
Here:
20.6% of AGI
State:
19.5% of AGI
(% of AGI for various income ranges: 8.9% for AGIs $25k-50k, 9.7% for AGIs $50k-75k, 9.3% for AGIs $75k-100k, 10.5% for AGIs over 100k)
Charity contributions deductions: $2,386 (3% of AGI, reported on 12.6% of returns)
Here:
$2,386
State:
$3,337
Here:
2.8% of AGI
State:
3.3% of AGI
(% of AGI for various income ranges: 0.9% for AGIs $10k-25k, 1.9% for AGIs $50k-75k, 1.4% for AGIs over 100k)
Total tax: $4,504 (reported on 73.4% of returns)
15470:
$4,504
State:
$8,008
(% of AGI for various income ranges: 3.1% for AGIs below $10k, 4.3% for AGIs $10k-25k, 6.8% for AGIs $25k-50k, 7.7% for AGIs $50k-75k, 11.1% for AGIs $75k-100k, 17.6% for AGIs over 100k)
Earned income credit: $1,429 (reported on 14.0% of returns)
Here:
$1,429
State:
$1,643
Percentage of individuals using paid preparers for their 2004 taxes: 63.6%
Here:
64%
State:
56%
(% for various income ranges: 58.1% for AGIs below $10k, 53.8% for AGIs $10k-25k, 75.9% for AGIs $25k-50k, 61.2% for AGIs $50k-75k, 60.0% for AGIs $75k-100k, 93.8% for AGIs over 100k)
Household received Food Stamps/SNAP in the past 12 months: 8 Household did not receive Food Stamps/SNAP in the past 12 months: 266
Women who had a birth in the past 12 months: 4 (4 now married, 0 unmarried) Women who did not have a birth in the past 12 months: 56 (44 now married, 11 unmarried)
Housing units in zip code 15470 with a mortgage: 133 (23 second mortgage, 21 both second mortgage and home equity loan) Houses without a mortgage: 4
Median monthly owner costs for units with a mortgage: $1,308 Median monthly owner costs for units without a mortgage: $611
Residents with income below the poverty level in 2022:
This zip code:
1.8%
Whole state:
11.8%
Residents with income below 50% of the poverty level in 2022:
This zip code:
1.1%
Whole state:
6.1%
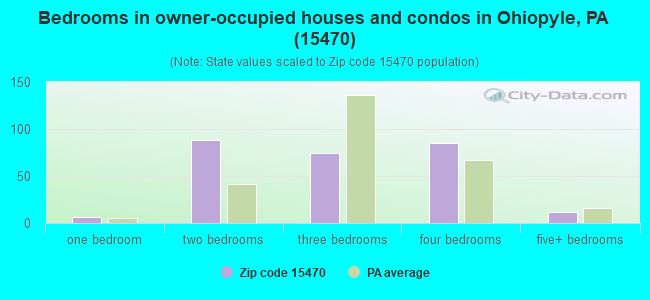
Median number of rooms in houses and condos:
Here:
6.1
State:
6.8
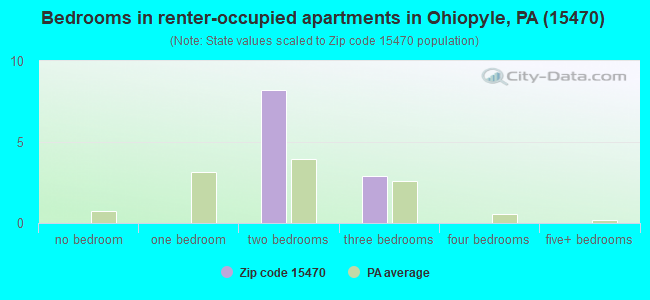
Median number of rooms in apartments:
Here:
5.7
State:
4.3
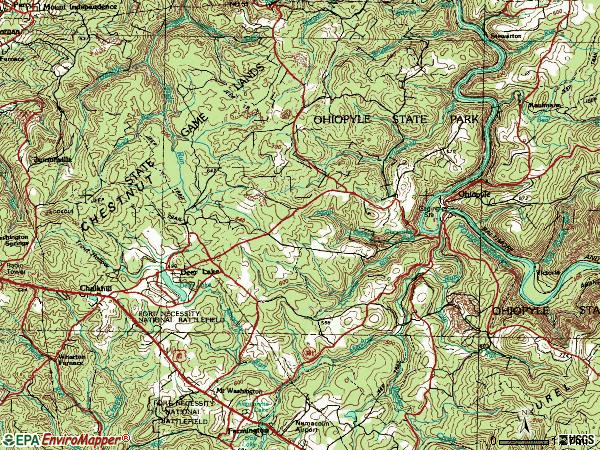
Notable locations in this zip code not listed on our city pages
Churches in zip code 15470 include: Meadow Run Valley Church (A), Full Gospel Church (B), Kentuck Union Church (C), Greenbrier Church (D). Display/hide their locations on the map
Streams, rivers, and creeks: Flat Rock Run (A), Meadow Run (B), Smiley Run (C), Cucumber Run (D), Laurel Run (E), Blackberry Run (F), Beaver Creek (G), Peck Run (H). Display/hide their locations on the map
Size of family households: 111 2-persons, 25 3-persons, 37 4-persons, 19 5-persons
Size of nonfamily households: 79 1-person, 3 2-persons
90 married couples with children.
4 single-parent households (4 men).
97.8% of residents of 15470 zip code speak English at home.
2.5% of residents speak other Indo-European language at home (73% very well, 27% well).
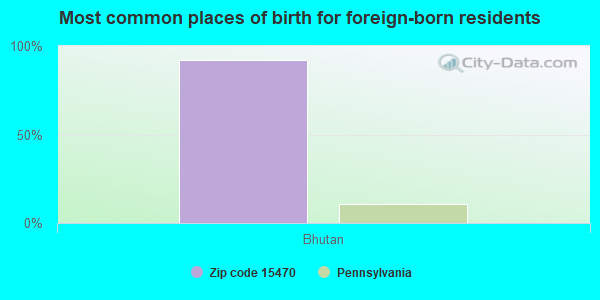
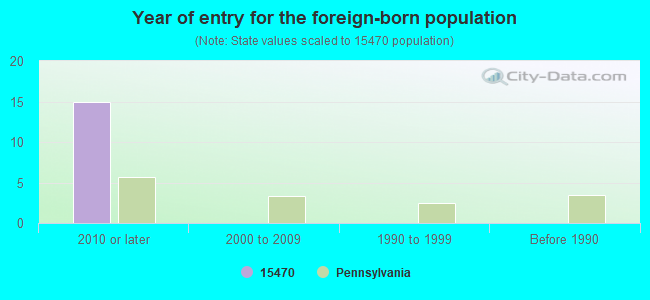
Foreign born population: 13 (2.3%) (70.1% of them are naturalized citizens)
This zip code:
2.3%
Whole state:
7.5%
92%Bhutan
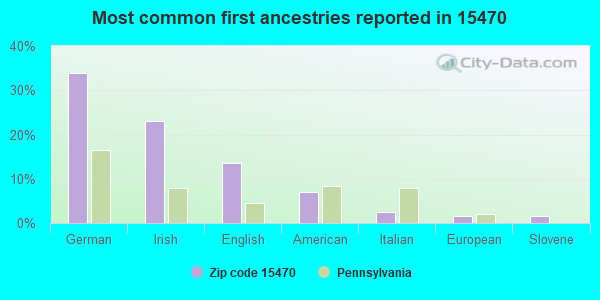
34%German
23%Irish
14%English
7%American
2%Italian
2%European
2%Slovene
Year of entry for the foreign-born population
152010 or later
02000 to 2009
01990 to 1999
0Before 1990
Housing units lacking complete plumbing facilities: 3.5% Housing units lacking complete kitchen facilities: 4.2%
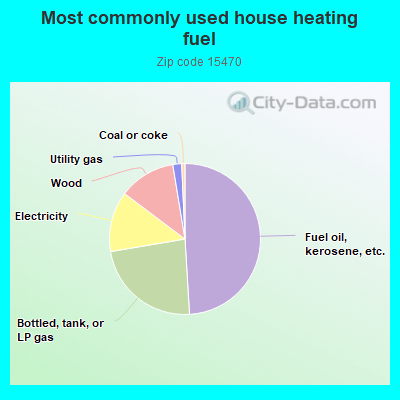
49.3%Fuel oil, kerosene, etc.
23.4%Bottled, tank, or LP gas
13.0%Electricity
12.2%Wood
1.9%Utility gas
0.7%Coal or coke
Population in 1990: 815. Population change in the 1990s: +361 (+44.3%).
Place of birth for U.S.-born residents:
This state: 477
Northeast: 5
Midwest: 48
South: 55
80% of the 15470 zip code residents lived in the same house 5 years ago. Out of people who lived in different houses, 65% lived in this county. Out of people who lived in different counties, 50% lived in Pennsylvania.
99% of the 15470 zip code residents lived in the same house 1 year ago. Out of people who lived in different houses, 50% moved from this county. Out of people who lived in different houses, 75% moved from different state.
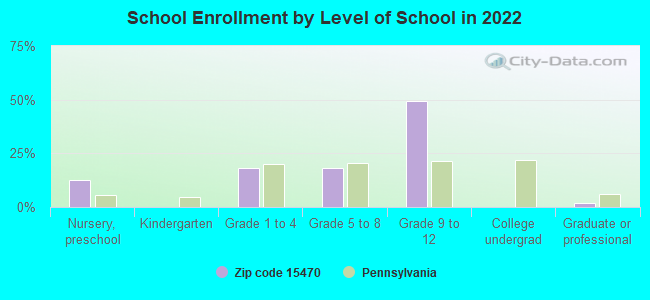
Private vs. public school enrollment:
Students in private schools in grades 1 to 8 (elementary and middle school): 2
Here:
5.5%
Pennsylvania:
15.7%
Students in private schools in grades 9 to 12 (high school):
Here:
0.0%
Pennsylvania:
13.4%
Students in private undergraduate colleges:
Here:
0.0%
Pennsylvania:
39.8%
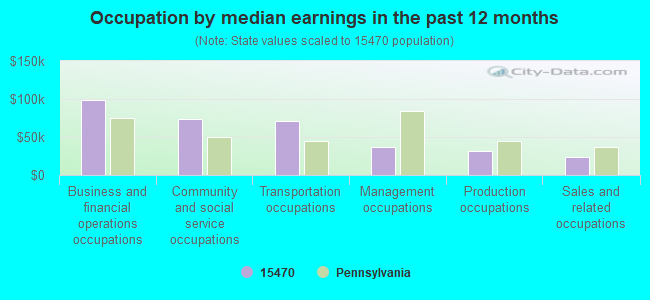
Occupation by median earnings in the past 12 months ($)
98,981Business and financial operations occupations
73,818Community and social service occupations
71,391Transportation occupations
36,306Management occupations
31,605Production occupations
24,013Sales and related occupations
Top industries in this zip code by the number of employees in 2005:
Health Care and Social Assistance: Other Residential Care Facilities (50-99 employees: 1 establishment)
Arts, Entertainment, and Recreation: All Other Amusement and Recreation Industries (5-9: 2, 1-4: 3)
Accommodation and Food Services: Full-Service Restaurants (5-9: 1, 1-4: 1)
Other Services (except Public Administration): Labor Unions and Similar Labor Organizations (5-9: 1)
Accommodation and Food Services: Limited-Service Restaurants (1-4: 2)
Health Care and Social Assistance: Home Health Care Services (1-4: 1)
Administrative and Support and Waste Management and Remediation Services: Solid Waste Landfill (1-4: 1)
Construction: Masonry Contractors (1-4: 1)
Fatal accident statistics in 2013:
Fatal accident count: 1
Vehicles involved in fatal accidents: 1
Fatal accidents caused by drunken drivers: 0
Fatalities: 1
Persons involved in fatal accidents: 1
Pedestrians involved in fatal accidents: 0
Home Mortgage Disclosure Act Aggregated Statistics For Year 2009 (Based on 2 partial tracts)
A) FHA, FSA/RHS & VA Home Purchase Loans
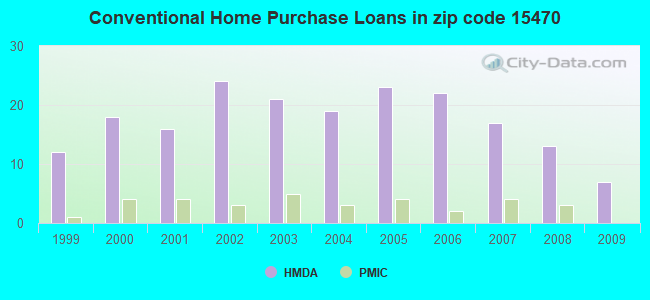
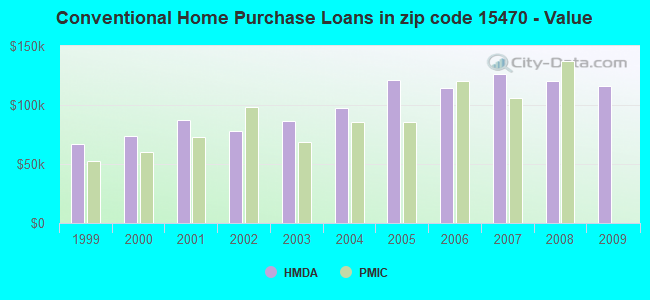
B) Conventional Home Purchase Loans
C) Refinancings
D) Home Improvement Loans
F) Non-occupant Loans on < 5 Family Dwellings (A B C & D)
G) Loans On Manufactured Home Dwelling (A B C & D)
Number
Average Value
Number
Average Value
Number
Average Value
Number
Average Value
Number
Average Value
Number
Average Value
LOANS ORIGINATED
2
$146,745
7
$116,384
32
$123,130
8
$51,449
4
$143,208
5
$48,372
APPLICATIONS APPROVED, NOT ACCEPTED
0
$0
0
$0
2
$82,740
1
$74,260
0
$0
0
$0
APPLICATIONS DENIED
1
$55,870
2
$66,300
18
$135,979
6
$23,868
2
$183,870
4
$49,770
APPLICATIONS WITHDRAWN
0
$0
1
$14,850
8
$137,682
0
$0
0
$0
1
$49,860
FILES CLOSED FOR INCOMPLETENESS
0
$0
0
$0
1
$133,660
0
$0
0
$0
0
$0
Aggregated Statistics For Year 2008 (Based on 2 partial tracts)
A) FHA, FSA/RHS & VA Home Purchase Loans
B) Conventional Home Purchase Loans
C) Refinancings
D) Home Improvement Loans
F) Non-occupant Loans on < 5 Family Dwellings (A B C & D)
G) Loans On Manufactured Home Dwelling (A B C & D)
Number
Average Value
Number
Average Value
Number
Average Value
Number
Average Value
Number
Average Value
Number
Average Value
LOANS ORIGINATED
2
$113,330
13
$120,360
26
$108,678
12
$45,791
4
$156,380
6
$65,298
APPLICATIONS APPROVED, NOT ACCEPTED
0
$0
2
$113,505
3
$98,653
1
$47,030
1
$145,680
1
$57,280
APPLICATIONS DENIED
1
$77,080
4
$74,875
24
$107,023
11
$52,365
1
$154,170
6
$82,860
APPLICATIONS WITHDRAWN
0
$0
1
$67,180
8
$130,965
1
$51,270
1
$58,340
1
$93,000
FILES CLOSED FOR INCOMPLETENESS
0
$0
0
$0
2
$110,855
0
$0
0
$0
0
$0
Aggregated Statistics For Year 2007 (Based on 2 partial tracts)
A) FHA, FSA/RHS & VA Home Purchase Loans
B) Conventional Home Purchase Loans
C) Refinancings
D) Home Improvement Loans
F) Non-occupant Loans on < 5 Family Dwellings (A B C & D)
G) Loans On Manufactured Home Dwelling (A B C & D)
Number
Average Value
Number
Average Value
Number
Average Value
Number
Average Value
Number
Average Value
Number
Average Value
LOANS ORIGINATED
2
$145,860
17
$126,027
25
$111,511
14
$47,964
8
$115,230
9
$64,906
APPLICATIONS APPROVED, NOT ACCEPTED
0
$0
3
$118,220
7
$99,160
1
$36,770
1
$76,730
1
$90,170
APPLICATIONS DENIED
1
$77,080
6
$78,440
34
$106,673
13
$60,602
3
$97,477
8
$98,169
APPLICATIONS WITHDRAWN
0
$0
2
$144,090
7
$125,377
2
$72,840
2
$93,525
1
$50,920
FILES CLOSED FOR INCOMPLETENESS
0
$0
0
$0
2
$172,735
1
$8,130
0
$0
0
$0
Aggregated Statistics For Year 2006 (Based on 2 partial tracts)
A) FHA, FSA/RHS & VA Home Purchase Loans
B) Conventional Home Purchase Loans
C) Refinancings
D) Home Improvement Loans
F) Non-occupant Loans on < 5 Family Dwellings (A B C & D)
G) Loans On Manufactured Home Dwelling (A B C & D)
Number
Average Value
Number
Average Value
Number
Average Value
Number
Average Value
Number
Average Value
Number
Average Value
LOANS ORIGINATED
1
$120,580
22
$114,341
32
$116,732
18
$35,379
11
$96,951
9
$65,770
APPLICATIONS APPROVED, NOT ACCEPTED
0
$0
6
$99,362
7
$169,779
1
$72,490
2
$177,330
1
$90,170
APPLICATIONS DENIED
0
$0
7
$95,421
37
$109,052
11
$60,305
2
$140,735
9
$78,539
APPLICATIONS WITHDRAWN
0
$0
3
$168,430
15
$174,254
2
$49,505
1
$138,960
1
$53,040
FILES CLOSED FOR INCOMPLETENESS
0
$0
1
$119,870
4
$92,642
0
$0
0
$0
0
$0
Aggregated Statistics For Year 2005 (Based on 2 partial tracts)
A) FHA, FSA/RHS & VA Home Purchase Loans
B) Conventional Home Purchase Loans
C) Refinancings
D) Home Improvement Loans
F) Non-occupant Loans on < 5 Family Dwellings (A B C & D)
G) Loans On Manufactured Home Dwelling (A B C & D)
Number
Average Value
Number
Average Value
Number
Average Value
Number
Average Value
Number
Average Value
Number
Average Value
LOANS ORIGINATED
1
$88,750
23
$120,793
34
$92,529
17
$31,554
8
$113,285
7
$47,989
APPLICATIONS APPROVED, NOT ACCEPTED
0
$0
4
$45,172
10
$92,608
2
$74,785
1
$112,090
3
$46,677
APPLICATIONS DENIED
0
$0
6
$83,862
51
$85,377
17
$36,525
3
$123,407
16
$60,532
APPLICATIONS WITHDRAWN
0
$0
2
$80,265
23
$115,612
2
$179,805
1
$136,490
4
$77,615
FILES CLOSED FOR INCOMPLETENESS
0
$0
1
$94,060
5
$108,202
0
$0
1
$115,270
0
$0
Aggregated Statistics For Year 2004 (Based on 2 partial tracts)
A) FHA, FSA/RHS & VA Home Purchase Loans
B) Conventional Home Purchase Loans
C) Refinancings
D) Home Improvement Loans
F) Non-occupant Loans on < 5 Family Dwellings (A B C & D)
G) Loans On Manufactured Home Dwelling (A B C & D)
Number
Average Value
Number
Average Value
Number
Average Value
Number
Average Value
Number
Average Value
Number
Average Value
LOANS ORIGINATED
0
$0
19
$97,649
40
$78,800
20
$38,684
7
$69,609
4
$40,840
APPLICATIONS APPROVED, NOT ACCEPTED
0
$0
5
$115,416
14
$81,176
3
$32,883
2
$65,770
3
$67,537
APPLICATIONS DENIED
1
$125,880
10
$70,260
54
$79,953
8
$33,282
3
$87,103
12
$60,053
APPLICATIONS WITHDRAWN
0
$0
5
$96,180
28
$101,976
3
$21,807
1
$26,870
5
$74,256
FILES CLOSED FOR INCOMPLETENESS
0
$0
1
$141,090
7
$126,236
1
$45,970
1
$117,400
0
$0
Aggregated Statistics For Year 2003 (Based on 2 partial tracts)
A) FHA, FSA/RHS & VA Home Purchase Loans
B) Conventional Home Purchase Loans
C) Refinancings
D) Home Improvement Loans
F) Non-occupant Loans on < 5 Family Dwellings (A B C & D)
Number
Average Value
Number
Average Value
Number
Average Value
Number
Average Value
Number
Average Value
LOANS ORIGINATED
1
$124,470
21
$86,026
71
$87,862
19
$36,160
9
$95,276
APPLICATIONS APPROVED, NOT ACCEPTED
0
$0
2
$85,925
16
$90,499
5
$39,462
1
$98,300
APPLICATIONS DENIED
0
$0
6
$56,282
48
$89,991
13
$32,613
2
$114,215
APPLICATIONS WITHDRAWN
0
$0
1
$181,400
25
$94,213
1
$47,030
1
$109,620
FILES CLOSED FOR INCOMPLETENESS
0
$0
1
$149,570
4
$171,938
1
$60,470
0
$0
Aggregated Statistics For Year 2002 (Based on 2 partial tracts)
A) FHA, FSA/RHS & VA Home Purchase Loans
B) Conventional Home Purchase Loans
C) Refinancings
D) Home Improvement Loans
F) Non-occupant Loans on < 5 Family Dwellings (A B C & D)
Number
Average Value
Number
Average Value
Number
Average Value
Number
Average Value
Number
Average Value
LOANS ORIGINATED
1
$69,310
24
$78,160
43
$83,343
18
$24,281
5
$92,148
APPLICATIONS APPROVED, NOT ACCEPTED
1
$19,090
1
$35,360
15
$80,197
2
$47,560
1
$30,060
APPLICATIONS DENIED
0
$0
7
$39,957
42
$75,039
10
$28,642
2
$76,380
APPLICATIONS WITHDRAWN
0
$0
3
$96,413
32
$78,997
4
$22,808
2
$47,735
FILES CLOSED FOR INCOMPLETENESS
0
$0
1
$78,500
3
$106,787
0
$0
0
$0
Aggregated Statistics For Year 2001 (Based on 2 partial tracts)
B) Conventional Home Purchase Loans
C) Refinancings
D) Home Improvement Loans
F) Non-occupant Loans on < 5 Family Dwellings (A B C & D)
Number
Average Value
Number
Average Value
Number
Average Value
Number
Average Value
LOANS ORIGINATED
16
$87,273
44
$63,913
11
$28,288
3
$97,240
APPLICATIONS APPROVED, NOT ACCEPTED
5
$45,898
16
$61,106
3
$30,410
1
$29,700
APPLICATIONS DENIED
11
$50,918
38
$72,442
9
$23,141
1
$118,100
APPLICATIONS WITHDRAWN
1
$129,060
13
$74,908
0
$0
0
$0
FILES CLOSED FOR INCOMPLETENESS
0
$0
4
$61,968
0
$0
0
$0
Aggregated Statistics For Year 2000 (Based on 2 partial tracts)
A) FHA, FSA/RHS & VA Home Purchase Loans
B) Conventional Home Purchase Loans
C) Refinancings
D) Home Improvement Loans
F) Non-occupant Loans on < 5 Family Dwellings (A B C & D)
Number
Average Value
Number
Average Value
Number
Average Value
Number
Average Value
Number
Average Value
LOANS ORIGINATED
1
$76,730
18
$74,020
29
$60,014
16
$17,061
4
$80,885
APPLICATIONS APPROVED, NOT ACCEPTED
0
$0
5
$62,092
12
$55,221
3
$13,083
1
$36,770
APPLICATIONS DENIED
0
$0
10
$50,494
31
$63,671
11
$14,884
2
$18,920
APPLICATIONS WITHDRAWN
0
$0
4
$64,442
10
$79,595
2
$22,275
0
$0
FILES CLOSED FOR INCOMPLETENESS
0
$0
0
$0
3
$75,553
0
$0
0
$0
Aggregated Statistics For Year 1999 (Based on 1 partial tract)
A) FHA, FSA/RHS & VA Home Purchase Loans
B) Conventional Home Purchase Loans
C) Refinancings
D) Home Improvement Loans
F) Non-occupant Loans on < 5 Family Dwellings (A B C & D)
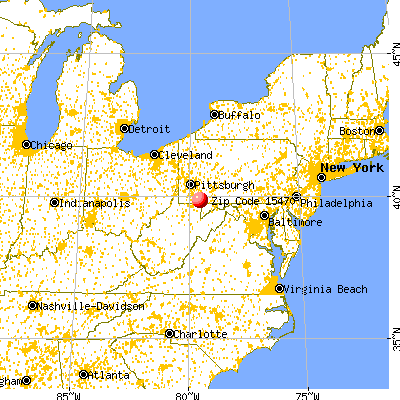


 Nearest zip codes: 15421, 15431, 15464, 15437, 15459, 15456.