Estimated zip code population in 2022: 2,690 Zip code population in 2010: 2,573 Zip code population in 2000: 3,085
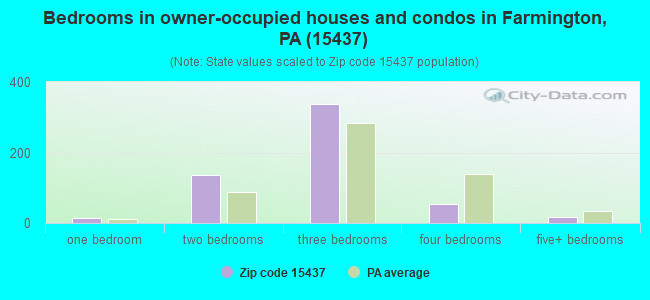
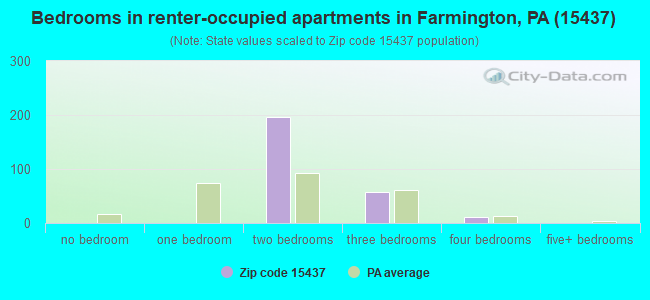
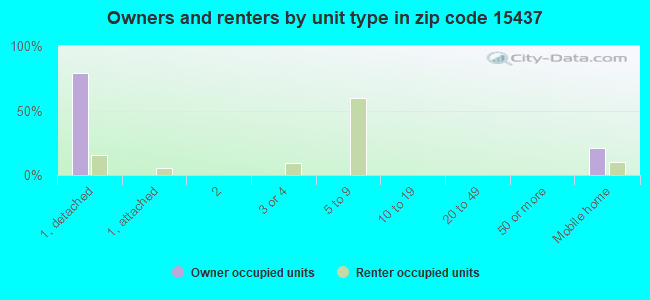
Houses and condos: 997 Renter-occupied apartments: 266
% of renters here:
32%
State:
31%
March 2022 cost of living index in zip code 15437: 89.3 (less than average, U.S. average is 100)
Land area: 69.8 sq. mi. Water area: 0.1 sq. mi.
Population density: 39 people per square mile
(very low).
OSM Map
General Map
Google Map
MSN Map
OSM Map
General Map
Google Map
MSN Map
OSM Map
General Map
Google Map
MSN Map
OSM Map
General Map
Google Map
MSN Map
Please wait while loading the map...
Real estate property taxes paid for housing units in 2022:
This zip code:
0.6% ($1,313)
Pennsylvania:
1.3% ($3,094)
Median real estate property taxes paid for housing units with mortgages in 2022: $1,481 (0.6%) Median real estate property taxes paid for housing units with no mortgage in 2022: $920 (0.9%)
Business Search- 14 Million verified businesses
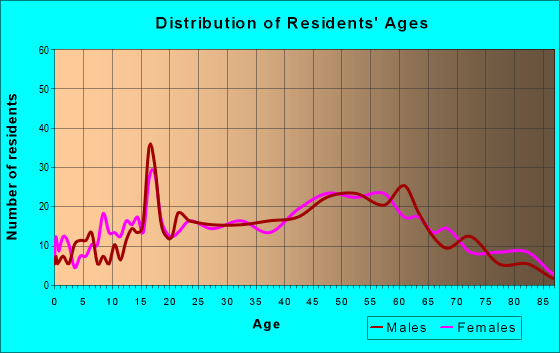
Males: 1,478
(55.0%)
Females: 1,211
(45.0%)
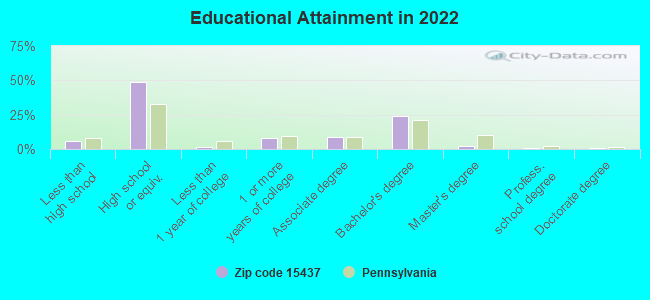
For population 25 years and over in 15437:
High school or higher: 93.3%
Bachelor's degree or higher: 27.2%
Graduate or professional degree: 3.5%
Unemployed: 0.9%
Mean travel time to work (commute): 18.5 minutes
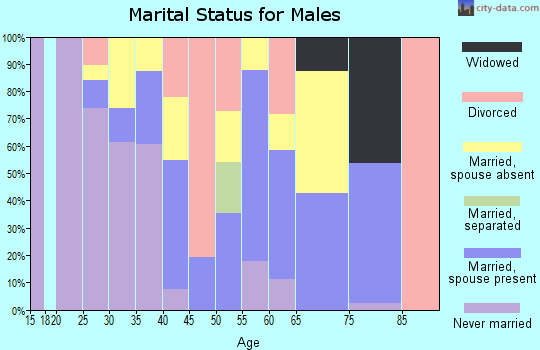
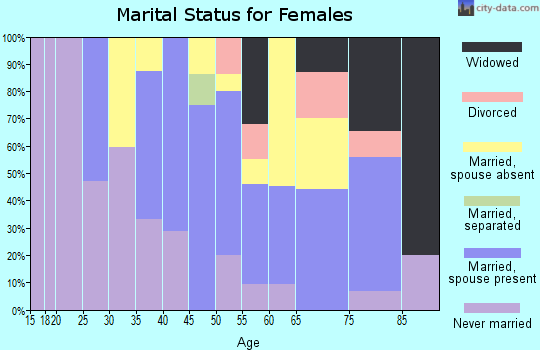
For population 15 years and over in 15437:
Never married: 36.5%
Now married: 53.7%
Separated: 0.9%
Widowed: 4.0%
Divorced: 4.9%
Zip code 15437 compared to state average:
Unemployed percentage significantly below state average.
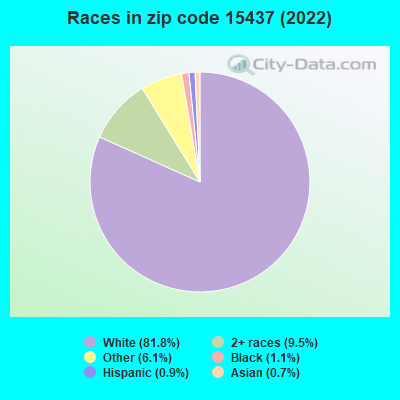
Black race population percentage significantly below state average.
Hispanic race population percentage significantly below state average.
Median age below state average.
Foreign-born population percentage significantly above state average.
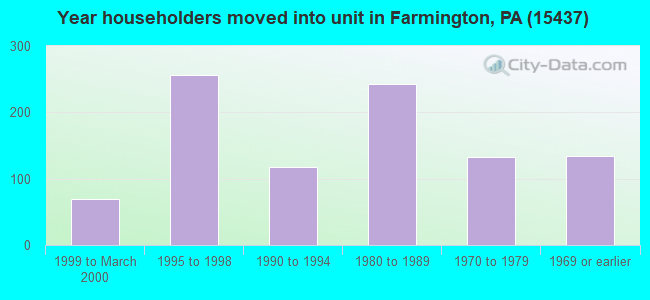
Length of stay since moving in significantly above state average.
House age below state average.
Number of college students significantly below state average.
Estimated median house/condo value in 2022: $211,529
15437:
$211,529
Pennsylvania:
$245,500
According to our research of Pennsylvania and other state lists, there were 3 registered sex offenders living in 15437 zip code as of April 28, 2024. The ratio of all residents to sex offenders in zip code 15437 is 901 to 1. The ratio of registered sex offenders to all residents in this zip code is lower than the state average.
Median resident age:
This zip code:
34.3 years
Pennsylvania median age:
40.9 years
Average household size:
This zip code:
2.3 people
Pennsylvania:
2.4 people
Averages for the 2020 tax year for zip code 15437, filed in 2021:
Average Adjusted Gross Income (AGI) in 2020: $59,643 (Individual Income Tax Returns)
Here:
$59,643
State:
$75,707
Salary/wage: $50,115 (reported on 69.7% of returns)
Here:
$50,115
State:
$62,806
(% of AGI for various income ranges: 1178.6% for AGIs below $25k, 3442.1% for AGIs $25k-50k, 6184.2% for AGIs $50k-75k, 8052.9% for AGIs $75k-100k, 14783.3% for AGIs $100k-200k)
Taxable interest for individuals: $956 (reported on 20.5% of returns)
This zip code:
$956
Pennsylvania:
$1,633
(% of AGI for various income ranges: 8.6% for AGIs below $25k, 11.1% for AGIs $25k-50k, 18.3% for AGIs $50k-75k, 110.0% for AGIs $75k-100k, 41.1% for AGIs $100k-200k)
Ordinary dividends: $15,643 (reported on 30.3% of returns)
Here:
$15,643
State:
$7,382
(% of AGI for various income ranges: 900.0% for AGIs below $25k, 987.4% for AGIs $25k-50k, 1194.2% for AGIs $50k-75k, 654.4% for AGIs $100k-200k)
Net capital gain/loss in AGI: +$8,900 (reported on 10.7% of returns)
Here:
+$8,900
State:
+$23,522
(% of AGI for various income ranges: 317.5% for AGIs $50k-75k, 862.2% for AGIs $100k-200k)
Profit/loss from business: +$14,977 (reported on 10.7% of returns)
Here:
+$14,977
State:
+$16,274
(% of AGI for various income ranges: 91.9% for AGIs below $25k, 187.4% for AGIs $25k-50k, 462.5% for AGIs $50k-75k, 936.7% for AGIs $100k-200k)
Taxable individual retirement arrangement distribution: $17,271 (reported on 5.7% of returns)
15437:
$17,271
Pennsylvania:
$18,583
(% of AGI for various income ranges: 153.2% for AGIs $25k-50k, 186.7% for AGIs $50k-75k, 771.1% for AGIs $100k-200k)
Total itemized deductions: $33,833 (reported on 2.5% of returns)
Here:
$33,833
State:
$34,850
(% of AGI for various income ranges: 1450.0% for AGIs $75k-100k)
Charity contributions: $11,050 (reported on 1.6% of returns)
Here:
$11,050
State:
$12,392
(% of AGI for various income ranges: 184.2% for AGIs $50k-75k)
Taxes paid: $8,433 (reported on 2.5% of returns)
15437:
$8,433
State:
$8,200
(% of AGI for various income ranges: 361.4% for AGIs $75k-100k)
Earned income credit: $1,558 (reported on 9.8% of returns)
Here:
$1,558
State:
$2,100
(% of AGI for various income ranges: 60.0% for AGIs below $25k, 32.1% for AGIs $25k-50k)
Percentage of individuals using paid preparers for their 2020 taxes: 93.4%
Here:
93%
State:
92%
(% for various income ranges: 93.8% for AGIs below $25k, 96.6% for AGIs $25k-50k, 94.4% for AGIs $50k-75k, 90.0% for AGIs $75k-100k, 85.7% for AGIs $100k-200k, 100.0% for AGIs over 200k)
Averages for the 2012 tax year for zip code 15437, filed in 2013:
Average Adjusted Gross Income (AGI) in 2012: $46,928 (Individual Income Tax Returns)
Here:
$46,928
State:
$61,346
Salary/wage: $42,396 (reported on 71.8% of returns)
Here:
$42,396
State:
$51,902
(% of AGI for various income ranges: 58.0% for AGIs below $25k, 69.7% for AGIs $25k-50k, 61.8% for AGIs $50k-75k, 70.8% for AGIs $75k-100k, 110.6% for AGIs $100k-200k)
Taxable interest for individuals: $1,190 (reported on 23.4% of returns)
This zip code:
$1,190
Pennsylvania:
$1,588
(% of AGI for various income ranges: 1.3% for AGIs below $25k, 0.6% for AGIs $25k-50k, 0.2% for AGIs $50k-75k, 0.3% for AGIs $75k-100k, 1.1% for AGIs $100k-200k)
Ordinary dividends: $17,030 (reported on 29.8% of returns)
Here:
$17,030
State:
$5,827
(% of AGI for various income ranges: 25.1% for AGIs below $25k, 11.8% for AGIs $25k-50k, 21.8% for AGIs $50k-75k, 9.1% for AGIs $75k-100k, 3.8% for AGIs $100k-200k)
Net capital gain/loss in AGI: +$333 (reported on 9.7% of returns)
Here:
+$333
State:
+$14,495
(% of AGI for various income ranges: 0.4% for AGIs $75k-100k, 0.3% for AGIs $100k-200k)
Profit/loss from business: +$10,829 (reported on 11.3% of returns)
Here:
+$10,829
State:
+$16,268
(% of AGI for various income ranges: 4.5% for AGIs below $25k, 1.2% for AGIs $25k-50k, 2.5% for AGIs $50k-75k, 6.2% for AGIs $100k-200k)
Taxable individual retirement arrangement distribution: $12,378 (reported on 7.3% of returns)
15437:
$12,378
Pennsylvania:
$14,550
(% of AGI for various income ranges: 3.8% for AGIs below $25k, 4.2% for AGIs $50k-75k, 3.3% for AGIs $100k-200k)
Total itemized deductions: $19,355 (17% of AGI, reported on 17.7% of returns)
Here:
$19,355
State:
$23,538
Here:
17.0% of AGI
State:
18.4% of AGI
(% of AGI for various income ranges: 4.1% for AGIs below $25k, 4.5% for AGIs $25k-50k, 4.3% for AGIs $50k-75k, 7.2% for AGIs $75k-100k, 18.5% for AGIs $100k-200k)
Charity contributions: $4,380 (reported on 12.1% of returns)
Here:
$4,380
State:
$4,025
(% of AGI for various income ranges: 1.3% for AGIs $25k-50k, 0.5% for AGIs $75k-100k, 3.6% for AGIs $100k-200k)
Taxes paid: $6,673 (reported on 17.7% of returns)
15437:
$6,673
State:
$9,982
(% of AGI for various income ranges: 0.4% for AGIs below $25k, 1.1% for AGIs $25k-50k, 1.1% for AGIs $50k-75k, 2.4% for AGIs $75k-100k, 4.3% for AGIs $100k-200k, 4.5% for AGIs over 200k)
Earned income credit: $1,406 (reported on 12.9% of returns)
Here:
$1,406
State:
$2,106
(% of AGI for various income ranges: 2.1% for AGIs below $25k, 0.8% for AGIs $25k-50k)
Percentage of individuals using paid preparers for their 2012 taxes: 65.3%
Here:
65%
State:
53%
(% for various income ranges: 63.3% for AGIs below $25k, 65.4% for AGIs $25k-50k, 68.8% for AGIs $50k-75k, 60.0% for AGIs $75k-100k, 90.0% for AGIs $100k-200k)
Averages for the 2004 tax year for zip code 15437, filed in 2005:
Average Adjusted Gross Income (AGI) in 2004: $39,032 (Individual Income Tax Returns)
Here:
$39,032
State:
$48,049
Salary/wage: $34,274 (reported on 84.0% of returns)
Here:
$34,274
State:
$42,646
(% of AGI for various income ranges: 137.4% for AGIs below $10k, 75.5% for AGIs $10k-25k, 83.6% for AGIs $25k-50k, 81.0% for AGIs $50k-75k, 70.2% for AGIs $75k-100k, 58.2% for AGIs over 100k)
Taxable interest for individuals: $1,249 (reported on 40.1% of returns)
This zip code:
$1,249
Pennsylvania:
$1,657
(% of AGI for various income ranges: 9.0% for AGIs below $10k, 2.5% for AGIs $10k-25k, 1.1% for AGIs $25k-50k, 0.6% for AGIs $50k-75k, 1.7% for AGIs $75k-100k, 0.8% for AGIs over 100k)
Taxable dividends: $3,561 (reported on 20.8% of returns)
Here:
$3,561
State:
$3,566
(% of AGI for various income ranges: 15.3% for AGIs below $10k, 2.7% for AGIs $10k-25k, 1.3% for AGIs $25k-50k, 0.5% for AGIs $50k-75k, 0.4% for AGIs $75k-100k, 2.9% for AGIs over 100k)
Net capital gain/loss: +$11,375 (reported on 14.1% of returns)
Here:
+$11,375
State:
+$9,716
(% of AGI for various income ranges: -2.5% for AGIs below $10k, 0.4% for AGIs $10k-25k, -0.1% for AGIs $25k-50k, 1.0% for AGIs $50k-75k, 1.0% for AGIs $75k-100k, 12.9% for AGIs over 100k)
Profit/loss from business: +$11,387 (reported on 15.2% of returns)
Here:
+$11,387
State:
+$14,267
(% of AGI for various income ranges: 5.5% for AGIs below $10k, 4.6% for AGIs $10k-25k, 3.6% for AGIs $25k-50k, 0.6% for AGIs $50k-75k, 7.3% for AGIs $75k-100k, 6.4% for AGIs over 100k)
IRA payment deduction: $1,870 (reported on 2.3% of returns)
15437:
$1,870
Pennsylvania:
$2,903
Total itemized deductions: $17,527 (18% of AGI, reported on 18.2% of returns)
Here:
$17,527
State:
$18,804
Here:
18.1% of AGI
State:
19.5% of AGI
(% of AGI for various income ranges: 3.3% for AGIs $10k-25k, 6.7% for AGIs $25k-50k, 9.5% for AGIs $50k-75k, 10.7% for AGIs $75k-100k, 10.1% for AGIs over 100k)
Charity contributions deductions: $2,771 (3% of AGI, reported on 15.0% of returns)
Here:
$2,771
State:
$3,337
Here:
2.9% of AGI
State:
3.3% of AGI
(% of AGI for various income ranges: 1.1% for AGIs $25k-50k, 1.3% for AGIs $50k-75k, 1.4% for AGIs $75k-100k, 1.2% for AGIs over 100k)
Total tax: $6,044 (reported on 74.2% of returns)
15437:
$6,044
State:
$8,008
(% of AGI for various income ranges: 3.4% for AGIs below $10k, 4.4% for AGIs $10k-25k, 6.7% for AGIs $25k-50k, 8.9% for AGIs $50k-75k, 10.8% for AGIs $75k-100k, 21.0% for AGIs over 100k)
Earned income credit: $1,449 (reported on 13.5% of returns)
Here:
$1,449
State:
$1,643
Percentage of individuals using paid preparers for their 2004 taxes: 62.4%
Here:
62%
State:
56%
(% for various income ranges: 58.2% for AGIs below $10k, 59.2% for AGIs $10k-25k, 63.0% for AGIs $25k-50k, 68.9% for AGIs $50k-75k, 66.1% for AGIs $75k-100k, 76.0% for AGIs over 100k)
Household received Food Stamps/SNAP in the past 12 months: 97 Household did not receive Food Stamps/SNAP in the past 12 months: 728
Women who had a birth in the past 12 months: 22 (24 now married, 0 unmarried) Women who did not have a birth in the past 12 months: 482 (263 now married, 216 unmarried)
Housing units in zip code 15437 with a mortgage: 338 Houses without a mortgage: 6
Median monthly owner costs for units with a mortgage: $1,140 Median monthly owner costs for units without a mortgage: $418
Residents with income below the poverty level in 2022:
This zip code:
37.2%
Whole state:
11.8%
Residents with income below 50% of the poverty level in 2022:
This zip code:
12.7%
Whole state:
6.1%
Median number of rooms in houses and condos:
Here:
5.7
State:
6.8
Median number of rooms in apartments:
Here:
4.2
State:
4.3
Notable locations in this zip code not listed on our city pages
Notable locations in zip code 15437: Grist Mill (A), Camp Riamo (B), Farmington Volunteer Fire Department Station 15 (C). Display/hide their locations on the map
Cemeteries: Van Sickle Cemetery (1), Visitation Cemetery (2), Thomas Cemetery (3), Sunsetview Cemetery (4), Workman Cemetery (5), Brown Cemetery (6), Sansom Cemetery (7). Display/hide their locations on the map
Lakes and reservoirs: Surprise Lake (A), Oak Lake (B), Bluegill Pond (C), Alanconnie Lake (D), Peters Lake (E), Heritage Lake (F), Lake George (G), Russell Lake (H). Display/hide their locations on the map
Streams, rivers, and creeks: McIntire Run (A), Deadman Run (B), Long Run (C), Chaney Run (D), Scotts Run (E), Laurel Run (F), Stony Fork (G), Noahs Glade (H), Great Meadow Run (I). Display/hide their locations on the map
Parks in zip code 15437 include: Fort Necessity National Battlefield (1), Fort Necessity State Park (2), Braddock Grave State Park (3). Display/hide their locations on the map
In group quarters: 853 (-1 institutionalized population)
Size of family households: 253 2-persons, 61 3-persons, 88 4-persons, 37 5-persons
Size of nonfamily households: 197 1-person, 30 2-persons, 145 4-persons
145 married couples with children.
32 single-parent households (8 men, 24 women).
74.4% of residents of 15437 zip code speak English at home.
1.5% of residents speak Spanish at home (68% very well, 32% not well).
22.1% of residents speak other Indo-European language at home (88% very well, 12% well).
0.2% of residents speak Asian or Pacific Island language at home (100% well).
1.2% of residents speak other language at home (100% very well).
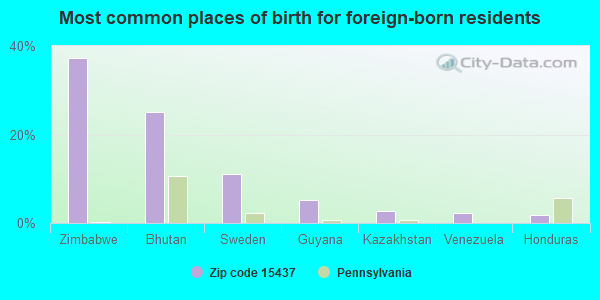
Foreign born population: 596 (22.2%) (18.6% of them are naturalized citizens)
This zip code:
22.2%
Whole state:
7.5%
37%Zimbabwe
25%Bhutan
11%Sweden
5%Guyana
3%Kazakhstan
2%Venezuela
2%Honduras
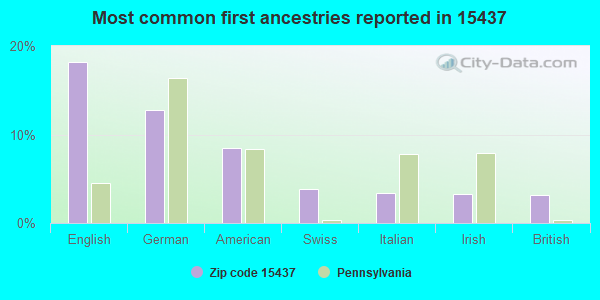
18%English
13%German
8%American
4%Swiss
3%Italian
3%Irish
3%British
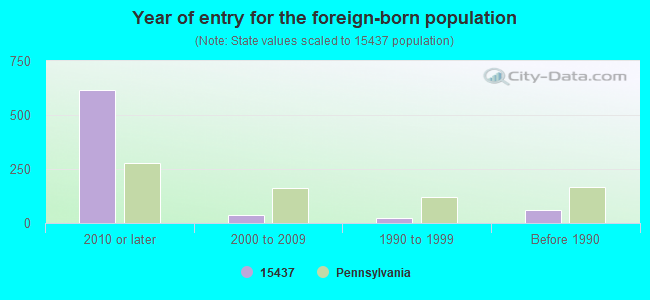
Year of entry for the foreign-born population
6142010 or later
372000 to 2009
221990 to 1999
59Before 1990
Facilities with environmental interests located in this zip code:
ANKERS AUTO BODY (RD 2 192D in FARMINGTON, PA)
Conditionally Exempt Small Quantity Generators, less than 100 kg/month of hazardous waste (Resource Conservation and Recovery Act (tracking hazardous waste)) - notification
Housing units lacking complete plumbing facilities: 2.4%
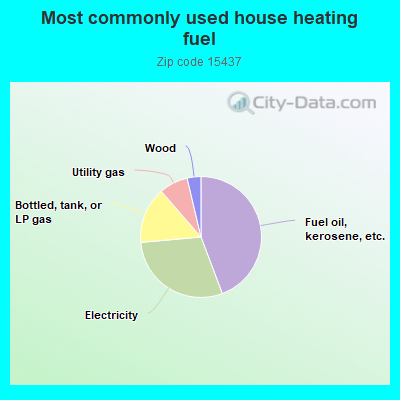
44.4%Fuel oil, kerosene, etc.
29.4%Electricity
15.1%Bottled, tank, or LP gas
7.7%Utility gas
3.7%Wood
Population in 1990: 3,296.
Place of birth for U.S.-born residents:
This state: 1,176
Northeast: 368
Midwest: 95
South: 365
West: 57
64% of the 15437 zip code residents lived in the same house 5 years ago. Out of people who lived in different houses, 48% lived in this county. Out of people who lived in different counties, 50% lived in Pennsylvania.
78% of the 15437 zip code residents lived in the same house 1 year ago. Out of people who lived in different houses, 11% moved from this county. Out of people who lived in different houses, 7% moved from different county within same state. Out of people who lived in different houses, 20% moved from different state. Out of people who lived in different houses, 69% moved from abroad.
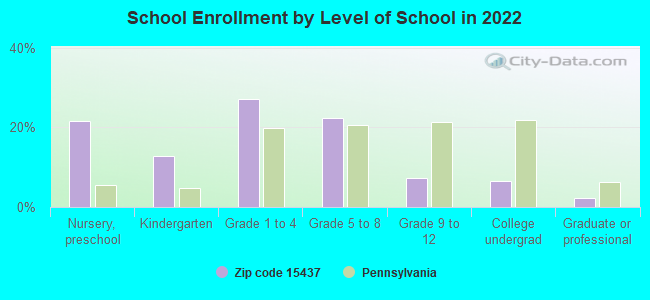
Private vs. public school enrollment:
Students in private schools in grades 1 to 8 (elementary and middle school): 101
Here:
60.9%
Pennsylvania:
15.7%
Students in private schools in grades 9 to 12 (high school):
Here:
0.0%
Pennsylvania:
13.4%
Students in private undergraduate colleges:
Here:
0.0%
Pennsylvania:
39.8%
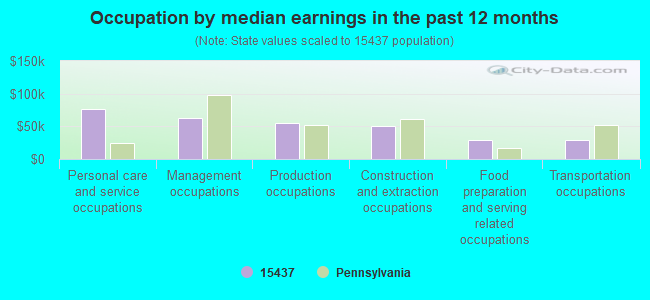
Occupation by median earnings in the past 12 months ($)
76,064Personal care and service occupations
63,123Management occupations
55,308Production occupations
50,599Construction and extraction occupations
29,311Food preparation and serving related occupations
29,254Transportation occupations
Top industries in this zip code by the number of employees in 2005:
Accommodation and Food Services: Hotels (except Casino Hotels) and Motels (over 1000 employees: 1 establishment, 10-19 employees: 1 establishment)
Accommodation and Food Services: Full-Service Restaurants (10-19: 1, 5-9: 1)
Professional, Scientific, and Technical Services: Offices of Certified Public Accountants (10-19: 1, 1-4: 1)
Health Care and Social Assistance: Offices of Dentists (10-19: 1)
Health Care and Social Assistance: Nursing Care Facilities (10-19: 1)
People in group quarters in 2010:
471 people in group homes intended for adults
25 people in residential treatment centers for adults
People in group quarters in 2000:
693 people in religious group quarters
47 people in nursing homes
Fatal accident statistics in 2014:
Fatal accident count: 1
Vehicles involved in fatal accidents: 2
Fatal accidents caused by drunken drivers: 1
Fatalities: 1
Persons involved in fatal accidents: 2
Pedestrians involved in fatal accidents: 0
Fatal accident statistics in 2011:
Fatal accident count: 1
Vehicles involved in fatal accidents: 1
Fatal accidents caused by drunken drivers: 1
Fatalities: 1
Persons involved in fatal accidents: 6
Pedestrians involved in fatal accidents: 0
Home Mortgage Disclosure Act Aggregated Statistics For Year 2009 (Based on 2 partial tracts)
A) FHA, FSA/RHS & VA Home Purchase Loans
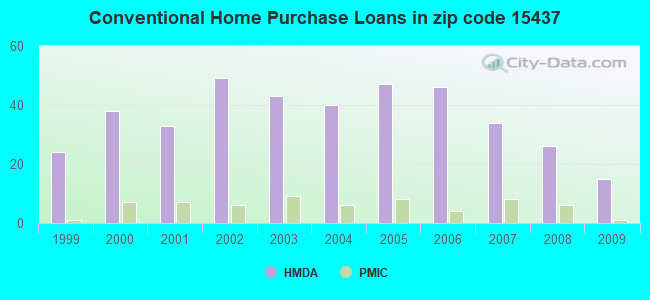
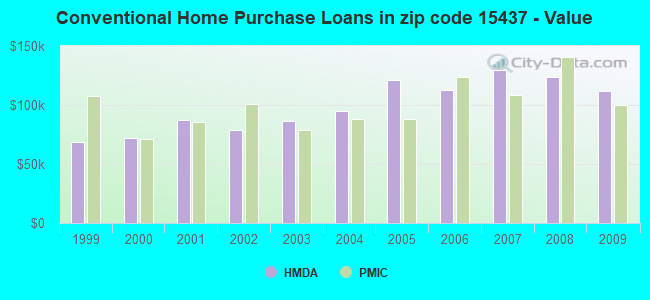
B) Conventional Home Purchase Loans
C) Refinancings
D) Home Improvement Loans
E) Loans on Dwellings For 5+ Families
F) Non-occupant Loans on < 5 Family Dwellings (A B C & D)
G) Loans On Manufactured Home Dwelling (A B C & D)
Number
Average Value
Number
Average Value
Number
Average Value
Number
Average Value
Number
Average Value
Number
Average Value
Number
Average Value
LOANS ORIGINATED
5
$120,582
15
$111,575
66
$122,641
17
$49,737
1
$1,954,020
9
$130,752
9
$55,207
APPLICATIONS APPROVED, NOT ACCEPTED
0
$0
1
$24,700
4
$84,990
2
$76,270
0
$0
1
$61,740
1
$24,700
APPLICATIONS DENIED
1
$114,770
4
$68,100
36
$139,671
13
$22,630
0
$0
5
$151,092
7
$58,423
APPLICATIONS WITHDRAWN
0
$0
1
$30,510
17
$133,102
0
$0
0
$0
1
$54,480
1
$102,420
FILES CLOSED FOR INCOMPLETENESS
0
$0
0
$0
2
$137,290
0
$0
0
$0
0
$0
1
$72,640
Aggregated Statistics For Year 2008 (Based on 2 partial tracts)
A) FHA, FSA/RHS & VA Home Purchase Loans
B) Conventional Home Purchase Loans
C) Refinancings
D) Home Improvement Loans
F) Non-occupant Loans on < 5 Family Dwellings (A B C & D)
G) Loans On Manufactured Home Dwelling (A B C & D)
Number
Average Value
Number
Average Value
Number
Average Value
Number
Average Value
Number
Average Value
Number
Average Value
LOANS ORIGINATED
4
$116,405
26
$123,628
54
$107,494
24
$47,035
9
$142,778
12
$67,071
APPLICATIONS APPROVED, NOT ACCEPTED
0
$0
4
$116,588
7
$86,857
1
$96,610
1
$299,280
2
$58,840
APPLICATIONS DENIED
1
$158,360
7
$87,894
49
$107,685
23
$51,448
3
$105,570
13
$78,563
APPLICATIONS WITHDRAWN
0
$0
2
$69,010
17
$126,607
1
$105,330
2
$59,930
1
$191,040
FILES CLOSED FOR INCOMPLETENESS
0
$0
1
$103,150
4
$113,862
1
$21,790
1
$77,720
0
$0
Aggregated Statistics For Year 2007 (Based on 2 partial tracts)
A) FHA, FSA/RHS & VA Home Purchase Loans
B) Conventional Home Purchase Loans
C) Refinancings
D) Home Improvement Loans
E) Loans on Dwellings For 5+ Families
F) Non-occupant Loans on < 5 Family Dwellings (A B C & D)
G) Loans On Manufactured Home Dwelling (A B C & D)
Number
Average Value
Number
Average Value
Number
Average Value
Number
Average Value
Number
Average Value
Number
Average Value
Number
Average Value
LOANS ORIGINATED
5
$119,856
34
$129,449
51
$112,293
28
$49,265
1
$210,660
17
$111,395
19
$63,158
APPLICATIONS APPROVED, NOT ACCEPTED
0
$0
6
$121,430
15
$95,061
2
$37,775
0
$0
3
$52,543
2
$92,615
APPLICATIONS DENIED
1
$158,360
12
$80,570
70
$106,438
27
$59,941
0
$0
6
$100,122
17
$94,902
APPLICATIONS WITHDRAWN
0
$0
5
$118,404
15
$120,195
5
$59,856
0
$0
4
$96,068
1
$104,600
FILES CLOSED FOR INCOMPLETENESS
0
$0
1
$58,110
4
$177,422
1
$16,710
0
$0
1
$58,110
0
$0
Aggregated Statistics For Year 2006 (Based on 2 partial tracts)
A) FHA, FSA/RHS & VA Home Purchase Loans
B) Conventional Home Purchase Loans
C) Refinancings
D) Home Improvement Loans
F) Non-occupant Loans on < 5 Family Dwellings (A B C & D)
G) Loans On Manufactured Home Dwelling (A B C & D)
Number
Average Value
Number
Average Value
Number
Average Value
Number
Average Value
Number
Average Value
Number
Average Value
LOANS ORIGINATED
3
$82,567
46
$112,339
66
$116,268
37
$35,358
23
$95,253
18
$67,555
APPLICATIONS APPROVED, NOT ACCEPTED
0
$0
13
$94,208
15
$162,762
3
$49,637
4
$182,145
2
$92,615
APPLICATIONS DENIED
1
$52,300
15
$91,478
77
$107,649
23
$59,249
4
$144,552
19
$76,425
APPLICATIONS WITHDRAWN
0
$0
6
$173,005
31
$173,211
4
$50,848
2
$142,740
1
$108,960
FILES CLOSED FOR INCOMPLETENESS
1
$43,580
1
$246,250
7
$108,753
1
$36,320
1
$163,440
1
$66,100
Aggregated Statistics For Year 2005 (Based on 2 partial tracts)
A) FHA, FSA/RHS & VA Home Purchase Loans
B) Conventional Home Purchase Loans
C) Refinancings
D) Home Improvement Loans
F) Non-occupant Loans on < 5 Family Dwellings (A B C & D)
G) Loans On Manufactured Home Dwelling (A B C & D)
Number
Average Value
Number
Average Value
Number
Average Value
Number
Average Value
Number
Average Value
Number
Average Value
LOANS ORIGINATED
1
$182,330
47
$121,432
70
$92,325
35
$31,484
16
$116,360
15
$46,005
APPLICATIONS APPROVED, NOT ACCEPTED
0
$0
7
$53,027
20
$95,122
5
$61,454
2
$115,135
6
$47,942
APPLICATIONS DENIED
1
$82,810
12
$86,139
104
$86,009
34
$37,516
7
$108,649
32
$62,175
APPLICATIONS WITHDRAWN
0
$0
5
$65,958
48
$113,803
4
$184,688
2
$140,195
8
$79,722
FILES CLOSED FOR INCOMPLETENESS
0
$0
3
$64,407
9
$123,488
0
$0
3
$78,937
0
$0
Aggregated Statistics For Year 2004 (Based on 2 partial tracts)
A) FHA, FSA/RHS & VA Home Purchase Loans
B) Conventional Home Purchase Loans
C) Refinancings
D) Home Improvement Loans
F) Non-occupant Loans on < 5 Family Dwellings (A B C & D)
G) Loans On Manufactured Home Dwelling (A B C & D)
Number
Average Value
Number
Average Value
Number
Average Value
Number
Average Value
Number
Average Value
Number
Average Value
LOANS ORIGINATED
1
$53,750
40
$95,286
83
$78,014
41
$38,765
15
$66,732
8
$41,950
APPLICATIONS APPROVED, NOT ACCEPTED
1
$61,020
9
$131,720
30
$77,822
6
$33,778
4
$67,555
6
$69,372
APPLICATIONS DENIED
2
$129,300
20
$72,168
110
$80,630
16
$34,186
6
$89,468
25
$59,216
APPLICATIONS WITHDRAWN
0
$0
10
$98,790
57
$102,907
7
$19,197
2
$27,605
11
$69,338
FILES CLOSED FOR INCOMPLETENESS
1
$52,300
2
$144,915
15
$121,018
2
$47,215
1
$241,160
0
$0
Aggregated Statistics For Year 2003 (Based on 2 partial tracts)
A) FHA, FSA/RHS & VA Home Purchase Loans
B) Conventional Home Purchase Loans
C) Refinancings
D) Home Improvement Loans
F) Non-occupant Loans on < 5 Family Dwellings (A B C & D)
Number
Average Value
Number
Average Value
Number
Average Value
Number
Average Value
Number
Average Value
LOANS ORIGINATED
3
$85,230
43
$86,307
147
$87,178
40
$35,285
18
$97,862
APPLICATIONS APPROVED, NOT ACCEPTED
0
$0
5
$70,606
32
$92,957
10
$40,533
3
$67,313
APPLICATIONS DENIED
1
$36,320
12
$57,809
100
$88,737
26
$33,498
4
$117,312
APPLICATIONS WITHDRAWN
0
$0
3
$124,213
51
$94,874
3
$32,203
3
$75,060
FILES CLOSED FOR INCOMPLETENESS
1
$74,820
3
$102,423
9
$156,983
1
$124,210
0
$0
Aggregated Statistics For Year 2002 (Based on 2 partial tracts)
A) FHA, FSA/RHS & VA Home Purchase Loans
B) Conventional Home Purchase Loans
C) Refinancings
D) Home Improvement Loans
F) Non-occupant Loans on < 5 Family Dwellings (A B C & D)
Number
Average Value
Number
Average Value
Number
Average Value
Number
Average Value
Number
Average Value
LOANS ORIGINATED
1
$142,370
49
$78,644
89
$82,720
37
$24,266
11
$86,045
APPLICATIONS APPROVED, NOT ACCEPTED
1
$39,230
2
$36,320
31
$79,716
5
$39,080
1
$61,740
APPLICATIONS DENIED
1
$92,980
14
$41,041
86
$75,284
20
$29,419
4
$78,450
APPLICATIONS WITHDRAWN
1
$29,780
7
$84,886
66
$78,682
7
$26,773
4
$49,032
FILES CLOSED FOR INCOMPLETENESS
0
$0
2
$80,630
6
$109,687
0
$0
0
$0
Aggregated Statistics For Year 2001 (Based on 2 partial tracts)
A) FHA, FSA/RHS & VA Home Purchase Loans
B) Conventional Home Purchase Loans
C) Refinancings
D) Home Improvement Loans
F) Non-occupant Loans on < 5 Family Dwellings (A B C & D)
Number
Average Value
Number
Average Value
Number
Average Value
Number
Average Value
Number
Average Value
LOANS ORIGINATED
0
$0
33
$86,926
90
$64,190
23
$27,793
7
$85,611
APPLICATIONS APPROVED, NOT ACCEPTED
1
$13,080
10
$47,143
32
$62,766
6
$31,235
2
$30,510
APPLICATIONS DENIED
0
$0
23
$50,027
78
$72,500
18
$23,769
3
$80,873
APPLICATIONS WITHDRAWN
0
$0
3
$88,380
28
$71,447
0
$0
0
$0
FILES CLOSED FOR INCOMPLETENESS
0
$0
0
$0
8
$63,651
0
$0
0
$0
Aggregated Statistics For Year 2000 (Based on 2 partial tracts)
A) FHA, FSA/RHS & VA Home Purchase Loans
B) Conventional Home Purchase Loans
C) Refinancings
D) Home Improvement Loans
F) Non-occupant Loans on < 5 Family Dwellings (A B C & D)
Number
Average Value
Number
Average Value
Number
Average Value
Number
Average Value
Number
Average Value
LOANS ORIGINATED
3
$52,543
38
$72,028
60
$59,589
33
$16,993
8
$83,082
APPLICATIONS APPROVED, NOT ACCEPTED
0
$0
10
$63,778
24
$56,720
6
$13,438
2
$37,775
APPLICATIONS DENIED
0
$0
20
$51,865
63
$64,361
22
$15,287
4
$19,430
APPLICATIONS WITHDRAWN
1
$32,690
8
$66,194
21
$77,863
4
$22,882
1
$18,160
FILES CLOSED FOR INCOMPLETENESS
0
$0
0
$0
6
$77,603
0
$0
1
$72,640
Aggregated Statistics For Year 1999 (Based on 1 partial tract)
A) FHA, FSA/RHS & VA Home Purchase Loans
B) Conventional Home Purchase Loans
C) Refinancings
D) Home Improvement Loans
F) Non-occupant Loans on < 5 Family Dwellings (A B C & D)
Detailed PMIC statistics for the following Tracts:2627.00
2004 - 2018 National Fire Incident Reporting System (NFIRS) incidents
Based on the data from the years 2004 - 2018 the average number of fire incidents per year is 14. The highest number of fires - 54 took place in 2016, and the least - 0 in 2013. The data has a decreasing trend.
When looking into fire subcategories, the most incidents belonged to: Structure Fires (37.9%), and Other (35.0%).
Fire incident types reported to NFIRS in Zip Code 15437


 Nearest zip codes: 15440, 15421, 15445, 15470, 15436, 26525.
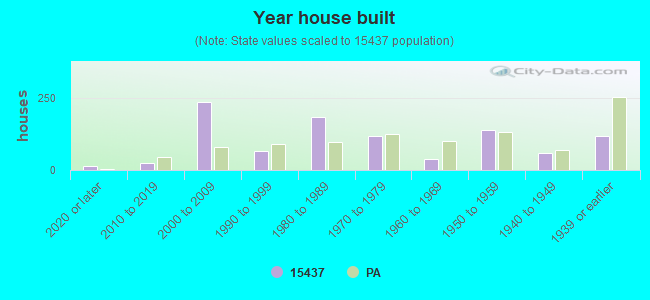


 Based on the data from the years 2004 - 2018 the average number of fire incidents per year is 14. The highest number of fires - 54 took place in 2016, and the least - 0 in 2013. The data has a decreasing trend.
 When looking into fire subcategories, the most incidents belonged to: Structure Fires (37.9%), and Other (35.0%).