Estimated zip code population in 2022: 2,372 Zip code population in 2010: 2,740 Zip code population in 2000: 3,276
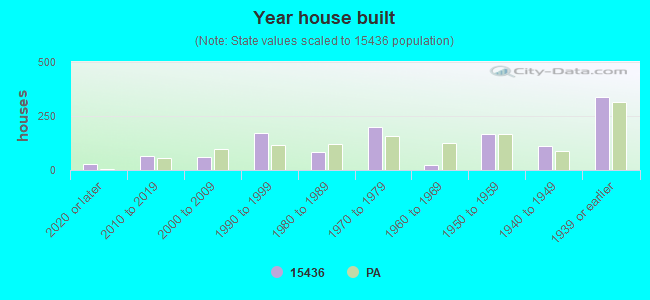
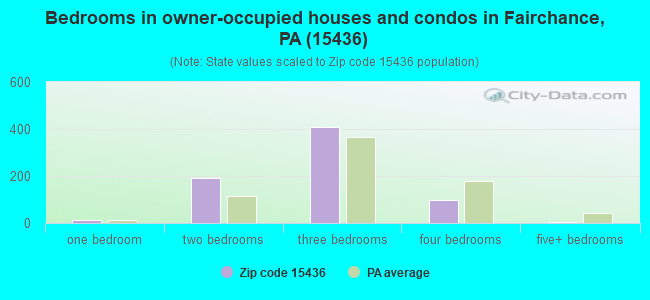
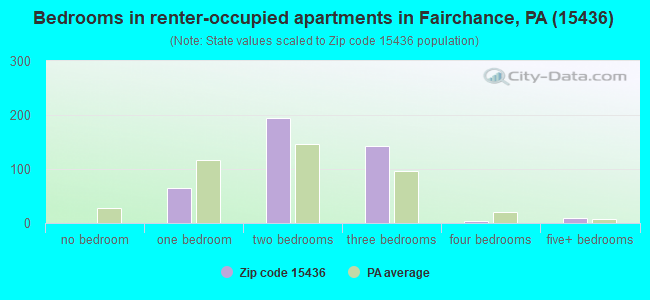
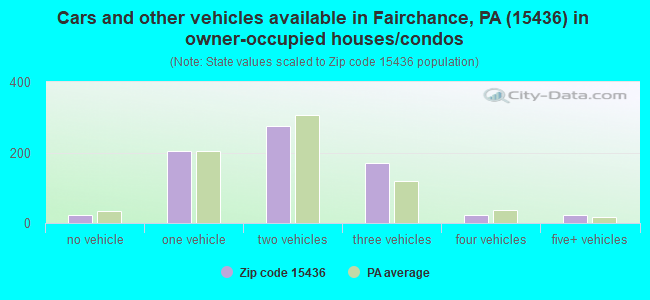
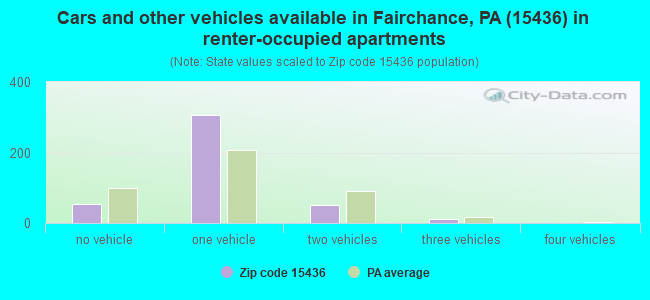
Houses and condos: 1,266 Renter-occupied apartments: 419
% of renters here:
37%
State:
31%
March 2022 cost of living index in zip code 15436: 89.1 (less than average, U.S. average is 100)
Land area: 7.0 sq. mi. Water area: 0.0 sq. mi.
Population density: 339 people per square mile
(very low).
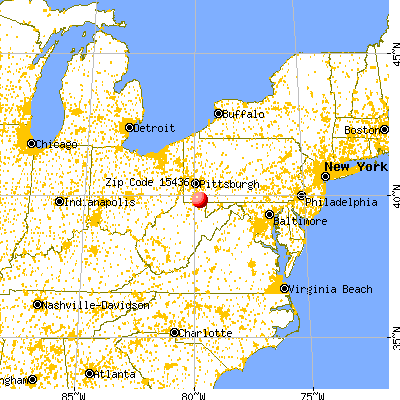
OSM Map
General Map
Google Map
MSN Map
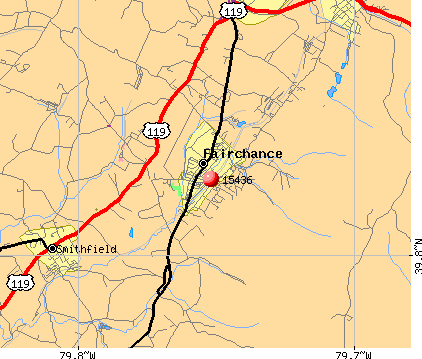
OSM Map
General Map
Google Map
MSN Map
OSM Map
General Map
Google Map
MSN Map
OSM Map
General Map
Google Map
MSN Map
Please wait while loading the map...
Real estate property taxes paid for housing units in 2022:
This zip code:
1.0% ($1,264)
Pennsylvania:
1.3% ($3,094)
Median real estate property taxes paid for housing units with mortgages in 2022: $1,804 (1.2%) Median real estate property taxes paid for housing units with no mortgage in 2022: $1,171 (1.1%)
Business Search- 14 Million verified businesses
Males: 1,158
(48.8%)
Females: 1,214
(51.2%)
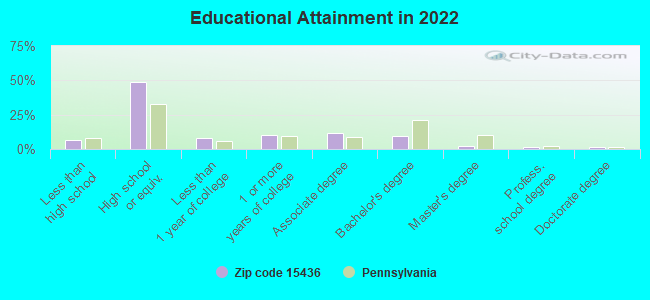
For population 25 years and over in 15436:
High school or higher: 92.3%
Bachelor's degree or higher: 14.5%
Graduate or professional degree: 5.1%
Unemployed: 4.8%
Mean travel time to work (commute): 25.4 minutes
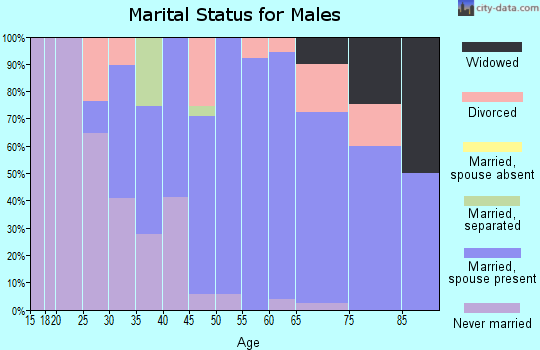
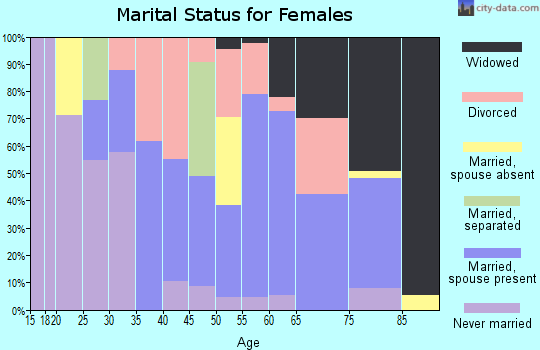
For population 15 years and over in 15436:
Never married: 24.0%
Now married: 48.3%
Separated: 3.4%
Widowed: 9.4%
Divorced: 14.8%
Zip code 15436 compared to state average:
Median house value below state average.
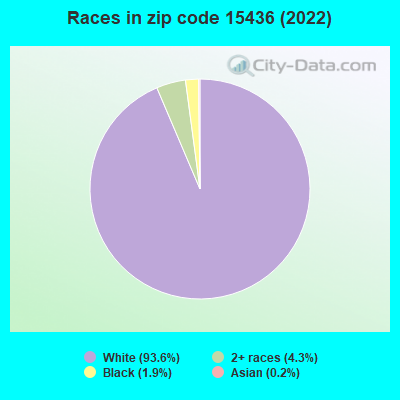
Black race population percentage significantly below state average.
Hispanic race population percentage significantly below state average.
Median age above state average.
Foreign-born population percentage significantly below state average.
Length of stay since moving in significantly above state average.
Number of college students below state average.
Percentage of population with a bachelor's degree or higher below state average.
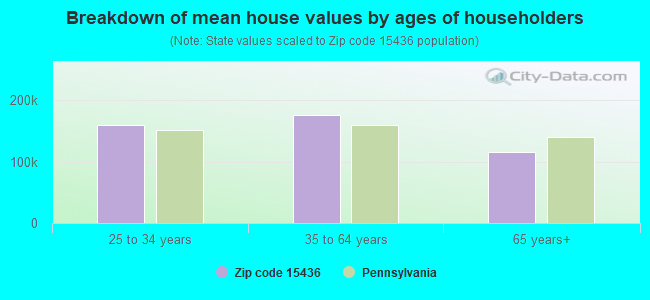
Estimated median house/condo value in 2022: $122,967
15436:
$122,967
Pennsylvania:
$245,500
According to our research of Pennsylvania and other state lists, there was 1 registered sex offender living in 15436 zip code as of April 28, 2024. The ratio of all residents to sex offenders in zip code 15436 is 2,556 to 1. The ratio of registered sex offenders to all residents in this zip code is much lower than the state average.
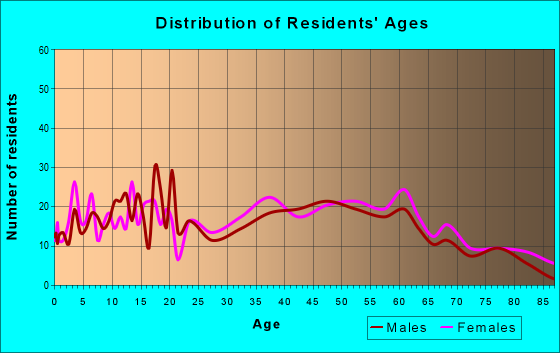
Median resident age:
This zip code:
47.1 years
Pennsylvania median age:
40.9 years
Average household size:
This zip code:
2.1 people
Pennsylvania:
2.4 people
Averages for the 2020 tax year for zip code 15436, filed in 2021:
Average Adjusted Gross Income (AGI) in 2020: $46,855 (Individual Income Tax Returns)
Here:
$46,855
State:
$75,707
Salary/wage: $42,393 (reported on 80.8% of returns)
Here:
$42,393
State:
$62,806
(% of AGI for various income ranges: 1055.4% for AGIs below $25k, 3261.0% for AGIs $25k-50k, 5666.7% for AGIs $50k-75k, 7918.8% for AGIs $75k-100k, 14536.4% for AGIs $100k-200k)
Taxable interest for individuals: $496 (reported on 20.8% of returns)
This zip code:
$496
Pennsylvania:
$1,633
(% of AGI for various income ranges: 9.5% for AGIs below $25k, 14.0% for AGIs $25k-50k, 6.0% for AGIs $50k-75k, 22.5% for AGIs $75k-100k, 27.3% for AGIs $100k-200k)
Ordinary dividends: $917 (reported on 9.2% of returns)
Here:
$917
State:
$7,382
(% of AGI for various income ranges: 2.4% for AGIs below $25k, 20.3% for AGIs $25k-50k, 13.8% for AGIs $75k-100k, 26.4% for AGIs $100k-200k)
Net capital gain/loss in AGI: +$2,892 (reported on 9.2% of returns)
Here:
+$2,892
State:
+$23,522
(% of AGI for various income ranges: 5.7% for AGIs below $25k, 22.7% for AGIs $25k-50k, 54.0% for AGIs $50k-75k, 160.9% for AGIs $100k-200k)
Profit/loss from business: +$8,375 (reported on 9.2% of returns)
Here:
+$8,375
State:
+$16,274
(% of AGI for various income ranges: 28.4% for AGIs below $25k, 27.0% for AGIs $25k-50k, 292.0% for AGIs $50k-75k, 346.4% for AGIs $100k-200k)
Taxable individual retirement arrangement distribution: $13,438 (reported on 6.2% of returns)
15436:
$13,438
Pennsylvania:
$18,583
(% of AGI for various income ranges: 32.2% for AGIs below $25k, 83.7% for AGIs $25k-50k, 881.2% for AGIs $75k-100k)
Earned income credit: $2,138 (reported on 16.2% of returns)
Here:
$2,138
State:
$2,100
(% of AGI for various income ranges: 79.2% for AGIs below $25k, 52.0% for AGIs $25k-50k)
Percentage of individuals using paid preparers for their 2020 taxes: 95.4%
Here:
95%
State:
92%
(% for various income ranges: 94.1% for AGIs below $25k, 97.1% for AGIs $25k-50k, 94.4% for AGIs $50k-75k, 90.9% for AGIs $75k-100k, 100.0% for AGIs $100k-200k)
Averages for the 2012 tax year for zip code 15436, filed in 2013:
Average Adjusted Gross Income (AGI) in 2012: $40,963 (Individual Income Tax Returns)
Here:
$40,963
State:
$61,346
Salary/wage: $37,311 (reported on 86.1% of returns)
Here:
$37,311
State:
$51,902
(% of AGI for various income ranges: 78.0% for AGIs below $25k, 82.1% for AGIs $25k-50k, 81.0% for AGIs $50k-75k, 77.8% for AGIs $75k-100k, 73.0% for AGIs $100k-200k)
Taxable interest for individuals: $557 (reported on 24.6% of returns)
This zip code:
$557
Pennsylvania:
$1,588
(% of AGI for various income ranges: 0.6% for AGIs below $25k, 0.5% for AGIs $25k-50k, 0.4% for AGIs $50k-75k, 0.1% for AGIs $75k-100k, 0.2% for AGIs $100k-200k)
Ordinary dividends: $650 (reported on 11.5% of returns)
Here:
$650
State:
$5,827
(% of AGI for various income ranges: 0.3% for AGIs below $25k, 0.2% for AGIs $25k-50k, 0.2% for AGIs $50k-75k, 0.2% for AGIs $75k-100k)
Net capital gain/loss in AGI: +$2,257 (reported on 5.7% of returns)
Here:
+$2,257
State:
+$14,495
Profit/loss from business: +$11,467 (reported on 9.8% of returns)
Here:
+$11,467
State:
+$16,268
(% of AGI for various income ranges: 2.2% for AGIs below $25k, 3.3% for AGIs $25k-50k, 2.7% for AGIs $50k-75k, 5.8% for AGIs $75k-100k)
Taxable individual retirement arrangement distribution: $8,922 (reported on 7.4% of returns)
15436:
$8,922
Pennsylvania:
$14,550
(% of AGI for various income ranges: 2.2% for AGIs below $25k, 2.3% for AGIs $25k-50k, 3.8% for AGIs $75k-100k)
Total itemized deductions: $17,486 (20% of AGI, reported on 11.5% of returns)
Here:
$17,486
State:
$23,538
Here:
19.6% of AGI
State:
18.4% of AGI
(% of AGI for various income ranges: 4.9% for AGIs below $25k, 6.9% for AGIs $50k-75k, 5.5% for AGIs $75k-100k, 7.6% for AGIs $100k-200k)
Charity contributions: $4,055 (reported on 9.0% of returns)
Here:
$4,055
State:
$4,025
(% of AGI for various income ranges: 1.5% for AGIs $50k-75k, 0.8% for AGIs $75k-100k, 1.9% for AGIs $100k-200k)
Taxes paid: $5,307 (reported on 11.5% of returns)
15436:
$5,307
State:
$9,982
(% of AGI for various income ranges: 0.9% for AGIs below $25k, 1.8% for AGIs $50k-75k, 1.7% for AGIs $75k-100k, 2.8% for AGIs $100k-200k)
Earned income credit: $2,274 (reported on 18.9% of returns)
Here:
$2,274
State:
$2,106
(% of AGI for various income ranges: 5.7% for AGIs below $25k, 1.1% for AGIs $25k-50k)
Percentage of individuals using paid preparers for their 2012 taxes: 59.8%
Here:
60%
State:
53%
(% for various income ranges: 56.6% for AGIs below $25k, 62.5% for AGIs $25k-50k, 62.5% for AGIs $50k-75k, 66.7% for AGIs $75k-100k, 55.6% for AGIs $100k-200k)
Averages for the 2004 tax year for zip code 15436, filed in 2005:
Average Adjusted Gross Income (AGI) in 2004: $29,462 (Individual Income Tax Returns)
Here:
$29,462
State:
$48,049
Salary/wage: $27,786 (reported on 84.8% of returns)
Here:
$27,786
State:
$42,646
(% of AGI for various income ranges: 83.3% for AGIs below $10k, 75.2% for AGIs $10k-25k, 79.9% for AGIs $25k-50k, 84.2% for AGIs $50k-75k, 85.8% for AGIs $75k-100k, 70.1% for AGIs over 100k)
Taxable interest for individuals: $1,186 (reported on 35.4% of returns)
This zip code:
$1,186
Pennsylvania:
$1,657
(% of AGI for various income ranges: 4.4% for AGIs below $10k, 2.2% for AGIs $10k-25k, 1.6% for AGIs $25k-50k, 1.0% for AGIs $50k-75k, 0.4% for AGIs $75k-100k, 0.9% for AGIs over 100k)
Taxable dividends: $832 (reported on 13.6% of returns)
Here:
$832
State:
$3,566
(% of AGI for various income ranges: 0.7% for AGIs below $10k, 0.7% for AGIs $10k-25k, 0.3% for AGIs $25k-50k, 0.3% for AGIs $50k-75k, 0.1% for AGIs $75k-100k, 0.5% for AGIs over 100k)
Net capital gain/loss: +$532 (reported on 9.0% of returns)
Here:
+$532
State:
+$9,716
(% of AGI for various income ranges: -1.0% for AGIs below $10k, 0.2% for AGIs $10k-25k, 0.5% for AGIs $25k-50k, 0.1% for AGIs $50k-75k, -0.2% for AGIs $75k-100k)
Profit/loss from business: +$12,619 (reported on 11.3% of returns)
Here:
+$12,619
State:
+$14,267
(% of AGI for various income ranges: 7.1% for AGIs below $10k, 4.0% for AGIs $10k-25k, 4.7% for AGIs $25k-50k, 3.8% for AGIs $50k-75k, 10.8% for AGIs $75k-100k)
IRA payment deduction: $1,769 (reported on 1.1% of returns)
15436:
$1,769
Pennsylvania:
$2,903
Total itemized deductions: $14,388 (22% of AGI, reported on 10.9% of returns)
Here:
$14,388
State:
$18,804
Here:
22.3% of AGI
State:
19.5% of AGI
(% of AGI for various income ranges: 2.8% for AGIs $10k-25k, 3.6% for AGIs $25k-50k, 7.1% for AGIs $50k-75k, 6.0% for AGIs $75k-100k, 12.0% for AGIs over 100k)
Charity contributions deductions: $3,018 (4% of AGI, reported on 9.1% of returns)
Here:
$3,018
State:
$3,337
Here:
4.5% of AGI
State:
3.3% of AGI
(% of AGI for various income ranges: 0.3% for AGIs $10k-25k, 0.3% for AGIs $25k-50k, 1.2% for AGIs $50k-75k, 1.1% for AGIs $75k-100k, 3.2% for AGIs over 100k)
Total tax: $3,401 (reported on 69.5% of returns)
15436:
$3,401
State:
$8,008
(% of AGI for various income ranges: 2.6% for AGIs below $10k, 3.7% for AGIs $10k-25k, 6.6% for AGIs $25k-50k, 8.8% for AGIs $50k-75k, 10.6% for AGIs $75k-100k, 16.6% for AGIs over 100k)
Earned income credit: $1,763 (reported on 21.6% of returns)
Here:
$1,763
State:
$1,643
Percentage of individuals using paid preparers for their 2004 taxes: 59.2%
Here:
59%
State:
56%
(% for various income ranges: 53.0% for AGIs below $10k, 58.5% for AGIs $10k-25k, 59.5% for AGIs $25k-50k, 65.4% for AGIs $50k-75k, 69.4% for AGIs $75k-100k, 79.3% for AGIs over 100k)
Household received Food Stamps/SNAP in the past 12 months: 346 Household did not receive Food Stamps/SNAP in the past 12 months: 802
Women who had a birth in the past 12 months: 33 (31 now married, 3 unmarried) Women who did not have a birth in the past 12 months: 418 (208 now married, 208 unmarried)
Housing units in zip code 15436 with a mortgage: 309 (50 second mortgage, 16 both second mortgage and home equity loan) Houses without a mortgage: 6
Median monthly owner costs for units with a mortgage: $1,130 Median monthly owner costs for units without a mortgage: $483
Residents with income below the poverty level in 2022:
This zip code:
21.6%
Whole state:
11.8%
Residents with income below 50% of the poverty level in 2022:
This zip code:
13.3%
Whole state:
6.1%
Median number of rooms in houses and condos:
Here:
6.0
State:
6.8
Median number of rooms in apartments:
Here:
4.9
State:
4.3
Notable locations in this zip code not listed on our city pages
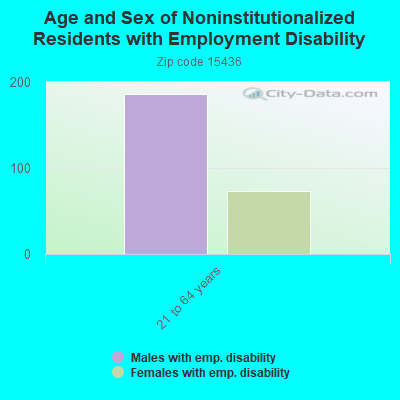
In group quarters: 5 (-1 institutionalized population)
Size of family households: 322 2-persons, 157 3-persons, 98 4-persons, 31 5-persons, 16 6-persons
Size of nonfamily households: 398 1-person, 119 2-persons
292 married couples with children.
131 single-parent households (8 men, 123 women).
98.9% of residents of 15436 zip code speak English at home.
0.5% of residents speak other Indo-European language at home (55% very well, 45% well).
0.2% of residents speak Asian or Pacific Island language at home (100% very well).
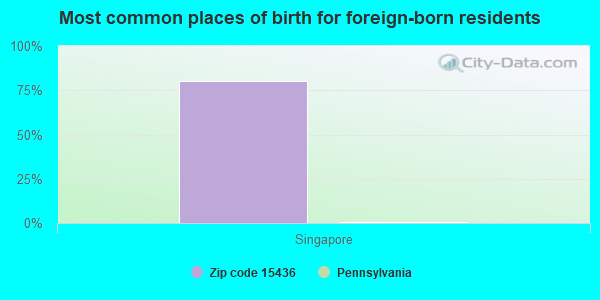
Foreign born population: 5 (0.2%) (100.0% of them are naturalized citizens)
This zip code:
0.2%
Whole state:
7.5%
80%Singapore
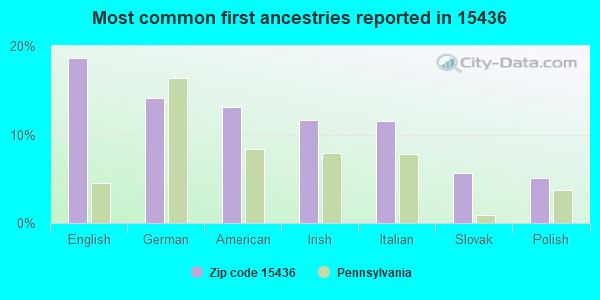
19%English
14%German
13%American
12%Irish
11%Italian
6%Slovak
5%Polish
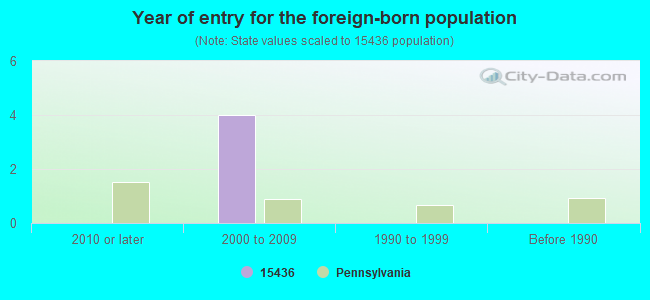
Year of entry for the foreign-born population
02010 or later
42000 to 2009
01990 to 1999
0Before 1990
Facilities with environmental interests located in this zip code:
ATT FAIRCHANCE PA6870 (3 MILES SOUTHEAST OF FAIRCHANCE in FAIRCHANCE, PA)
Large Quantity Generators, more that 1000 kg of hazardous waste/month (Resource Conservation and Recovery Act (tracking hazardous waste)) - notification (Resource Conservation and Recovery Act (tracking hazardous waste)) Organizations: OPERNAME (CONTACT/OPERATOR)
, AT & T LONG LINES (CONTACT/OWNER)
, AT&T COMMUNICATIONS (CONTACT/OWNER)
Alternative names: AT&T-FAIRCHANCE-PA6870, AT & T LONG LINES - EQUIP ENGR
A L WILSON EL SCH (25 S MAIN ST in FAIRCHANCE, PA)
(National Center for Education Statistics) - STATE ID-2115 Organizations: ALBERT GALLATIN AREA SD (SCHOOL DISTRICT)
BERKLEY MEDICAL RESOURCES INC (700 MT VIEW DRIVE in FAIRCHANCE, PA)
National Pollutant Discharge Elimination System NON-MAJOR (Tracking pollutant discharge elimination systems) - permit Business SIC classification: NONWOVEN FABRICS
Housing units lacking complete plumbing facilities: 2.8% Housing units lacking complete kitchen facilities: 2.7%
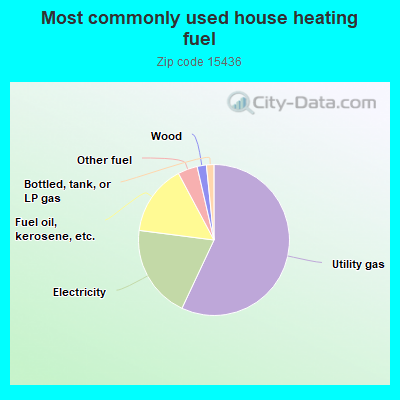
57.1%Utility gas
20.1%Electricity
15.2%Fuel oil, kerosene, etc.
4.2%Other fuel
2.0%Wood
1.6%Bottled, tank, or LP gas
Population in 1990: 1,918. Population change in the 1990s: +1,358 (+70.8%).
Place of birth for U.S.-born residents:
This state: 1,945
Northeast: 55
Midwest: 52
South: 279
West: 23
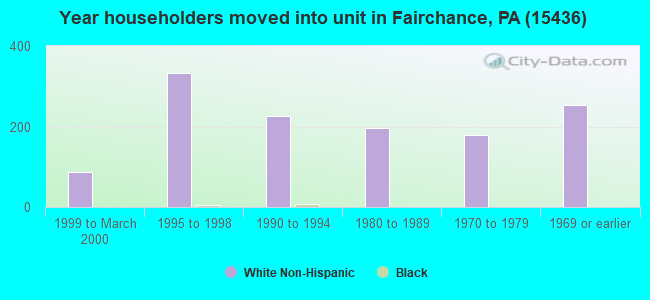
71% of the 15436 zip code residents lived in the same house 5 years ago. Out of people who lived in different houses, 83% lived in this county. Out of people who lived in different counties, 50% lived in Pennsylvania.
91% of the 15436 zip code residents lived in the same house 1 year ago. Out of people who lived in different houses, 52% moved from this county. Out of people who lived in different houses, 13% moved from different county within same state. Out of people who lived in different houses, 35% moved from different state.
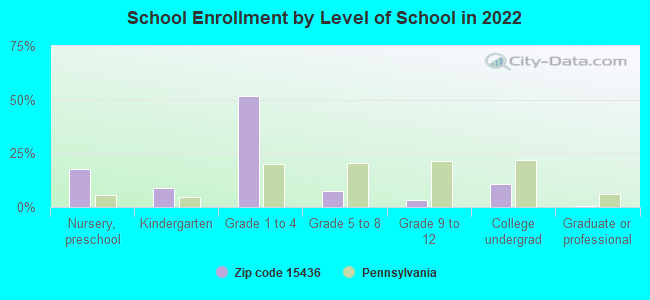
Private vs. public school enrollment:
Students in private schools in grades 1 to 8 (elementary and middle school): 14
Here:
6.3%
Pennsylvania:
15.7%
Students in private schools in grades 9 to 12 (high school):
Here:
0.0%
Pennsylvania:
13.4%
Students in private undergraduate colleges: 10
Here:
22.3%
Pennsylvania:
39.8%
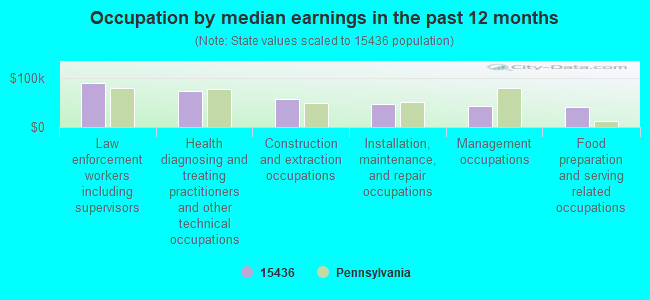
Occupation by median earnings in the past 12 months ($)
88,906Law enforcement workers including supervisors
72,460Health diagnosing and treating practitioners and other technical occupations
57,544Construction and extraction occupations
45,727Installation, maintenance, and repair occupations
43,072Management occupations
40,619Food preparation and serving related occupations
Companies with federal contracts located in this zip code:
MOUNTAIN RIDGE GOLF CARS (80 MORGANTOWN ST in FAIRCHANCE, PA; small business)
$9,215 with Navy for Lease or Rental of Equipment -- Recreational and Athletic Equipment. Signed on 2005-04-25. Completion date: 2005-05-31.
Top industries in this zip code by the number of employees in 2005:
Health Care and Social Assistance: Ambulance Services (20-49 employees: 1 establishment)
Accommodation and Food Services: Full-Service Restaurants (5-9: 2, 1-4: 1)
Construction: Commercial and Institutional Building Construction (10-19: 1)
Accommodation and Food Services: Drinking Places (Alcoholic Beverages) (10-19: 1)
Health Care and Social Assistance: Homes for the Elderly (10-19: 1)
Finance and Insurance: Commercial Banking (10-19: 1)
Other Services (except Public Administration): Religious Organizations (5-9: 1, 1-4: 3)
Construction: New Single-Family Housing Construction (except Operative Builders) (5-9: 1, 1-4: 1)
People in group quarters in 2010:
20 people in group homes intended for adults
People in group quarters in 2000:
19 people in nursing homes
15 people in other noninstitutional group quarters
Fatal accident statistics in 2011:
Fatal accident count: 1
Vehicles involved in fatal accidents: 1
Fatal accidents caused by drunken drivers: 1
Fatalities: 1
Persons involved in fatal accidents: 1
Pedestrians involved in fatal accidents: 0
Home Mortgage Disclosure Act Aggregated Statistics For Year 2009 (Based on 2 partial tracts)
A) FHA, FSA/RHS & VA Home Purchase Loans
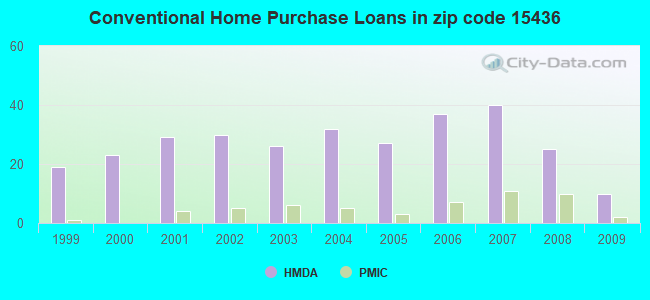
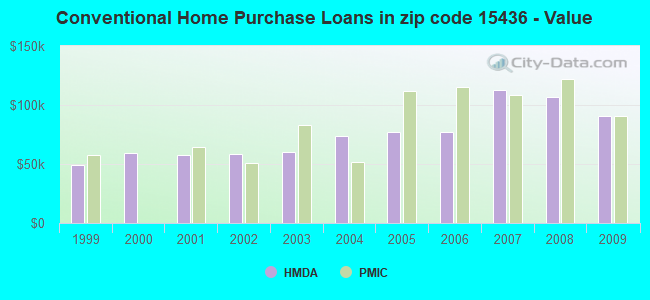
B) Conventional Home Purchase Loans
C) Refinancings
D) Home Improvement Loans
F) Non-occupant Loans on < 5 Family Dwellings (A B C & D)
G) Loans On Manufactured Home Dwelling (A B C & D)
Number
Average Value
Number
Average Value
Number
Average Value
Number
Average Value
Number
Average Value
Number
Average Value
LOANS ORIGINATED
9
$100,727
10
$91,084
37
$119,075
9
$57,058
1
$60,240
5
$69,998
APPLICATIONS APPROVED, NOT ACCEPTED
2
$158,145
0
$0
4
$62,218
2
$10,040
0
$0
0
$0
APPLICATIONS DENIED
3
$94,193
6
$50,323
38
$102,899
14
$34,067
4
$23,668
4
$60,602
APPLICATIONS WITHDRAWN
1
$53,790
3
$91,083
14
$115,571
2
$71,005
1
$5,740
0
$0
FILES CLOSED FOR INCOMPLETENESS
1
$99,690
0
$0
5
$87,068
1
$7,170
0
$0
0
$0
Aggregated Statistics For Year 2008 (Based on 2 partial tracts)
A) FHA, FSA/RHS & VA Home Purchase Loans
B) Conventional Home Purchase Loans
C) Refinancings
D) Home Improvement Loans
E) Loans on Dwellings For 5+ Families
F) Non-occupant Loans on < 5 Family Dwellings (A B C & D)
G) Loans On Manufactured Home Dwelling (A B C & D)
Number
Average Value
Number
Average Value
Number
Average Value
Number
Average Value
Number
Average Value
Number
Average Value
Number
Average Value
LOANS ORIGINATED
9
$115,549
25
$106,949
46
$84,661
21
$39,719
1
$167,110
6
$90,248
9
$66,221
APPLICATIONS APPROVED, NOT ACCEPTED
1
$168,540
4
$87,140
6
$99,930
1
$62,400
0
$0
0
$0
1
$148,460
APPLICATIONS DENIED
1
$103,280
9
$64,548
34
$91,527
18
$53,551
0
$0
1
$71,720
12
$63,412
APPLICATIONS WITHDRAWN
1
$147,030
5
$116,474
13
$108,518
2
$15,420
0
$0
1
$21,520
2
$72,435
FILES CLOSED FOR INCOMPLETENESS
0
$0
1
$83,910
1
$76,020
1
$46,620
0
$0
1
$14,340
0
$0
Aggregated Statistics For Year 2007 (Based on 2 partial tracts)
A) FHA, FSA/RHS & VA Home Purchase Loans
B) Conventional Home Purchase Loans
C) Refinancings
D) Home Improvement Loans
F) Non-occupant Loans on < 5 Family Dwellings (A B C & D)
G) Loans On Manufactured Home Dwelling (A B C & D)
Number
Average Value
Number
Average Value
Number
Average Value
Number
Average Value
Number
Average Value
Number
Average Value
LOANS ORIGINATED
5
$72,006
40
$112,403
52
$79,954
26
$28,192
9
$75,147
9
$43,670
APPLICATIONS APPROVED, NOT ACCEPTED
0
$0
4
$118,518
9
$82,797
3
$42,313
0
$0
0
$0
APPLICATIONS DENIED
1
$46,620
20
$77,530
75
$75,316
26
$45,046
1
$68,130
22
$48,737
APPLICATIONS WITHDRAWN
0
$0
7
$87,703
30
$85,395
3
$46,857
1
$167,110
3
$56,660
FILES CLOSED FOR INCOMPLETENESS
0
$0
1
$154,920
1
$268,950
0
$0
1
$204,400
0
$0
Aggregated Statistics For Year 2006 (Based on 2 partial tracts)
A) FHA, FSA/RHS & VA Home Purchase Loans
B) Conventional Home Purchase Loans
C) Refinancings
D) Home Improvement Loans
F) Non-occupant Loans on < 5 Family Dwellings (A B C & D)
G) Loans On Manufactured Home Dwelling (A B C & D)
Number
Average Value
Number
Average Value
Number
Average Value
Number
Average Value
Number
Average Value
Number
Average Value
LOANS ORIGINATED
5
$78,318
37
$77,070
49
$64,197
27
$22,977
9
$41,917
10
$54,722
APPLICATIONS APPROVED, NOT ACCEPTED
0
$0
8
$61,859
19
$67,077
3
$52,117
1
$48,770
1
$50,200
APPLICATIONS DENIED
1
$83,200
12
$94,909
96
$85,765
31
$31,557
6
$45,662
16
$64,593
APPLICATIONS WITHDRAWN
0
$0
2
$97,180
40
$84,791
2
$39,085
0
$0
1
$17,930
FILES CLOSED FOR INCOMPLETENESS
0
$0
1
$19,360
6
$82,837
1
$86,060
0
$0
0
$0
Aggregated Statistics For Year 2005 (Based on 2 partial tracts)
A) FHA, FSA/RHS & VA Home Purchase Loans
B) Conventional Home Purchase Loans
C) Refinancings
D) Home Improvement Loans
F) Non-occupant Loans on < 5 Family Dwellings (A B C & D)
G) Loans On Manufactured Home Dwelling (A B C & D)
Number
Average Value
Number
Average Value
Number
Average Value
Number
Average Value
Number
Average Value
Number
Average Value
LOANS ORIGINATED
2
$77,460
27
$77,086
51
$76,276
24
$27,463
6
$34,665
9
$45,024
APPLICATIONS APPROVED, NOT ACCEPTED
1
$103,280
2
$97,180
16
$83,106
1
$46,620
0
$0
2
$93,955
APPLICATIONS DENIED
1
$119,770
16
$49,846
106
$73,547
32
$33,171
2
$47,335
24
$54,985
APPLICATIONS WITHDRAWN
0
$0
9
$71,321
57
$79,018
9
$115,390
1
$57,380
7
$83,606
FILES CLOSED FOR INCOMPLETENESS
0
$0
1
$67,420
10
$84,630
2
$53,790
1
$95,390
0
$0
Aggregated Statistics For Year 2004 (Based on 2 partial tracts)
A) FHA, FSA/RHS & VA Home Purchase Loans
B) Conventional Home Purchase Loans
C) Refinancings
D) Home Improvement Loans
E) Loans on Dwellings For 5+ Families
F) Non-occupant Loans on < 5 Family Dwellings (A B C & D)
G) Loans On Manufactured Home Dwelling (A B C & D)
Number
Average Value
Number
Average Value
Number
Average Value
Number
Average Value
Number
Average Value
Number
Average Value
Number
Average Value
LOANS ORIGINATED
6
$104,592
32
$73,446
58
$70,372
22
$28,623
0
$0
5
$76,454
7
$67,007
APPLICATIONS APPROVED, NOT ACCEPTED
0
$0
4
$86,422
17
$81,676
7
$17,520
0
$0
0
$0
5
$57,662
APPLICATIONS DENIED
0
$0
6
$43,750
108
$78,281
28
$22,822
1
$28,690
1
$168,540
16
$53,028
APPLICATIONS WITHDRAWN
0
$0
5
$62,110
55
$89,194
4
$133,220
0
$0
1
$32,990
10
$63,329
FILES CLOSED FOR INCOMPLETENESS
0
$0
0
$0
22
$105,820
1
$101,840
0
$0
0
$0
0
$0
Aggregated Statistics For Year 2003 (Based on 2 partial tracts)
A) FHA, FSA/RHS & VA Home Purchase Loans
B) Conventional Home Purchase Loans
C) Refinancings
D) Home Improvement Loans
F) Non-occupant Loans on < 5 Family Dwellings (A B C & D)
Number
Average Value
Number
Average Value
Number
Average Value
Number
Average Value
Number
Average Value
LOANS ORIGINATED
4
$100,408
26
$60,438
105
$72,827
25
$25,246
6
$32,035
APPLICATIONS APPROVED, NOT ACCEPTED
0
$0
6
$66,460
18
$59,767
6
$17,930
1
$30,120
APPLICATIONS DENIED
1
$56,660
8
$24,205
84
$75,110
25
$15,061
1
$32,990
APPLICATIONS WITHDRAWN
0
$0
8
$68,941
60
$78,294
3
$21,993
0
$0
FILES CLOSED FOR INCOMPLETENESS
0
$0
1
$76,740
5
$75,020
0
$0
0
$0
Aggregated Statistics For Year 2002 (Based on 2 partial tracts)
A) FHA, FSA/RHS & VA Home Purchase Loans
B) Conventional Home Purchase Loans
C) Refinancings
D) Home Improvement Loans
F) Non-occupant Loans on < 5 Family Dwellings (A B C & D)
Number
Average Value
Number
Average Value
Number
Average Value
Number
Average Value
Number
Average Value
LOANS ORIGINATED
3
$59,290
30
$58,786
65
$70,286
22
$23,276
7
$29,200
APPLICATIONS APPROVED, NOT ACCEPTED
0
$0
6
$63,233
26
$72,630
6
$11,833
0
$0
APPLICATIONS DENIED
0
$0
19
$36,199
77
$60,459
20
$19,759
1
$11,480
APPLICATIONS WITHDRAWN
0
$0
8
$66,161
55
$64,248
4
$25,102
0
$0
FILES CLOSED FOR INCOMPLETENESS
0
$0
2
$163,165
10
$64,405
0
$0
1
$32,270
Aggregated Statistics For Year 2001 (Based on 2 partial tracts)
A) FHA, FSA/RHS & VA Home Purchase Loans
B) Conventional Home Purchase Loans
C) Refinancings
D) Home Improvement Loans
F) Non-occupant Loans on < 5 Family Dwellings (A B C & D)
Number
Average Value
Number
Average Value
Number
Average Value
Number
Average Value
Number
Average Value
LOANS ORIGINATED
7
$79,200
29
$58,019
72
$62,098
24
$16,795
5
$27,254
APPLICATIONS APPROVED, NOT ACCEPTED
0
$0
2
$65,980
19
$59,603
8
$18,109
1
$39,450
APPLICATIONS DENIED
1
$54,510
20
$46,152
60
$63,209
12
$19,424
1
$30,120
APPLICATIONS WITHDRAWN
0
$0
8
$50,472
22
$56,300
5
$17,930
1
$96,100
FILES CLOSED FOR INCOMPLETENESS
0
$0
1
$52,360
4
$85,168
0
$0
0
$0
Aggregated Statistics For Year 2000 (Based on 2 partial tracts)
A) FHA, FSA/RHS & VA Home Purchase Loans
B) Conventional Home Purchase Loans
C) Refinancings
D) Home Improvement Loans
E) Loans on Dwellings For 5+ Families
F) Non-occupant Loans on < 5 Family Dwellings (A B C & D)
Number
Average Value
Number
Average Value
Number
Average Value
Number
Average Value
Number
Average Value
Number
Average Value
LOANS ORIGINATED
3
$62,637
23
$58,904
29
$42,710
20
$11,726
0
$0
8
$32,542
APPLICATIONS APPROVED, NOT ACCEPTED
0
$0
6
$39,087
17
$51,892
6
$17,692
0
$0
0
$0
APPLICATIONS DENIED
1
$50,200
35
$39,794
37
$54,081
12
$37,294
1
$27,970
1
$8,610
APPLICATIONS WITHDRAWN
1
$46,620
5
$32,992
15
$59,719
1
$14,340
0
$0
0
$0
FILES CLOSED FOR INCOMPLETENESS
0
$0
1
$35,860
3
$62,397
0
$0
0
$0
0
$0
Aggregated Statistics For Year 1999 (Based on 1 partial tract)
A) FHA, FSA/RHS & VA Home Purchase Loans
B) Conventional Home Purchase Loans
C) Refinancings
D) Home Improvement Loans
F) Non-occupant Loans on < 5 Family Dwellings (A B C & D)


 Nearest zip codes: 15445, 15401, 15478, 15484, 15472, 15437.