Estimated zip code population in 2022: 29,808 Zip code population in 2010: 32,288 Zip code population in 2000: 36,374
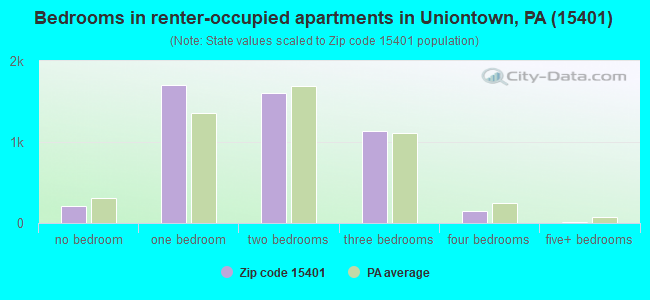
Houses and condos: 15,391 Renter-occupied apartments: 4,794
% of renters here:
34%
State:
31%
March 2022 cost of living index in zip code 15401: 89.3 (less than average, U.S. average is 100)
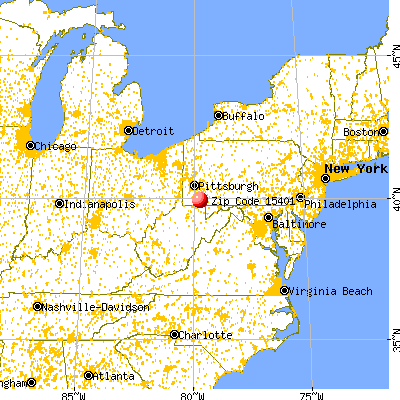
Land area: 58.3 sq. mi. Water area: 0.1 sq. mi.
Population density: 511 people per square mile
(low).
OSM Map
General Map
Google Map
MSN Map
OSM Map
General Map
Google Map
MSN Map
OSM Map
General Map
Google Map
MSN Map
OSM Map
General Map
Google Map
MSN Map
Please wait while loading the map...
Real estate property taxes paid for housing units in 2022:
This zip code:
1.1% ($1,533)
Pennsylvania:
1.3% ($3,094)
Median real estate property taxes paid for housing units with mortgages in 2022: $1,706 (1.0%) Median real estate property taxes paid for housing units with no mortgage in 2022: $1,343 (1.2%)
Averages for the 2020 tax year for zip code 15401, filed in 2021:
Average Adjusted Gross Income (AGI) in 2020: $55,616 (Individual Income Tax Returns)
Here:
$55,616
State:
$75,707
Salary/wage: $45,267 (reported on 78.4% of returns)
Here:
$45,267
State:
$62,806
(% of AGI for various income ranges: 972.3% for AGIs below $25k, 3201.6% for AGIs $25k-50k, 5783.6% for AGIs $50k-75k, 8719.2% for AGIs $75k-100k, 15021.4% for AGIs $100k-200k, 72701.1% for AGIs over 200k)
Taxable interest for individuals: $1,674 (reported on 26.4% of returns)
This zip code:
$1,674
Pennsylvania:
$1,633
(% of AGI for various income ranges: 16.4% for AGIs below $25k, 16.9% for AGIs $25k-50k, 41.9% for AGIs $50k-75k, 95.6% for AGIs $75k-100k, 154.8% for AGIs $100k-200k, 2507.8% for AGIs over 200k)
Ordinary dividends: $4,927 (reported on 15.5% of returns)
Here:
$4,927
State:
$7,382
(% of AGI for various income ranges: 16.4% for AGIs below $25k, 20.5% for AGIs $25k-50k, 57.9% for AGIs $50k-75k, 88.5% for AGIs $75k-100k, 274.0% for AGIs $100k-200k, 6012.2% for AGIs over 200k)
Net capital gain/loss in AGI: +$12,835 (reported on 12.0% of returns)
Here:
+$12,835
State:
+$23,522
(% of AGI for various income ranges: 7.3% for AGIs below $25k, 19.4% for AGIs $25k-50k, 49.2% for AGIs $50k-75k, 126.0% for AGIs $75k-100k, 452.7% for AGIs $100k-200k, 16814.4% for AGIs over 200k)
Profit/loss from business: +$12,520 (reported on 10.5% of returns)
Here:
+$12,520
State:
+$16,274
(% of AGI for various income ranges: 64.4% for AGIs below $25k, 79.5% for AGIs $25k-50k, 111.9% for AGIs $50k-75k, 178.7% for AGIs $75k-100k, 465.1% for AGIs $100k-200k, 6842.2% for AGIs over 200k)
Taxable individual retirement arrangement distribution: $16,378 (reported on 10.0% of returns)
15401:
$16,378
Pennsylvania:
$18,583
(% of AGI for various income ranges: 56.9% for AGIs below $25k, 86.1% for AGIs $25k-50k, 195.4% for AGIs $50k-75k, 349.4% for AGIs $75k-100k, 813.4% for AGIs $100k-200k, 5255.6% for AGIs over 200k)
Self-employed (Keogh) retirement plans: $20,550 (reported on 0.1% of returns)
15401:
$20,550
Pennsylvania:
$25,407
(% of AGI for various income ranges: 40.3% for AGIs $100k-200k)
Total itemized deductions: $44,300 (reported on 2.8% of returns)
Here:
$44,300
State:
$34,850
(% of AGI for various income ranges: 12.4% for AGIs below $25k, 37.8% for AGIs $25k-50k, 111.7% for AGIs $50k-75k, 154.4% for AGIs $75k-100k, 384.9% for AGIs $100k-200k, 10613.3% for AGIs over 200k)
Charity contributions: $12,065 (reported on 2.1% of returns)
Here:
$12,065
State:
$12,392
(% of AGI for various income ranges: 7.0% for AGIs $25k-50k, 14.4% for AGIs $50k-75k, 25.4% for AGIs $75k-100k, 108.3% for AGIs $100k-200k, 2205.6% for AGIs over 200k)
Taxes paid: $6,861 (reported on 2.8% of returns)
15401:
$6,861
State:
$8,200
(% of AGI for various income ranges: 6.5% for AGIs $25k-50k, 20.5% for AGIs $50k-75k, 39.5% for AGIs $75k-100k, 95.9% for AGIs $100k-200k, 1095.6% for AGIs over 200k)
Earned income credit: $2,130 (reported on 17.9% of returns)
Here:
$2,130
State:
$2,100
(% of AGI for various income ranges: 88.1% for AGIs below $25k, 66.3% for AGIs $25k-50k)
Percentage of individuals using paid preparers for their 2020 taxes: 93.4%
Here:
93%
State:
92%
(% for various income ranges: 92.9% for AGIs below $25k, 94.7% for AGIs $25k-50k, 93.7% for AGIs $50k-75k, 93.5% for AGIs $75k-100k, 92.4% for AGIs $100k-200k, 91.7% for AGIs over 200k)
Averages for the 2012 tax year for zip code 15401, filed in 2013:
Average Adjusted Gross Income (AGI) in 2012: $47,625 (Individual Income Tax Returns)
Here:
$47,625
State:
$61,346
Salary/wage: $37,871 (reported on 81.3% of returns)
Here:
$37,871
State:
$51,902
(% of AGI for various income ranges: 71.6% for AGIs below $25k, 76.5% for AGIs $25k-50k, 73.5% for AGIs $50k-75k, 74.3% for AGIs $75k-100k, 69.3% for AGIs $100k-200k, 31.2% for AGIs over 200k)
Taxable interest for individuals: $1,870 (reported on 30.4% of returns)
This zip code:
$1,870
Pennsylvania:
$1,588
(% of AGI for various income ranges: 1.6% for AGIs below $25k, 0.9% for AGIs $25k-50k, 0.7% for AGIs $50k-75k, 1.0% for AGIs $75k-100k, 0.8% for AGIs $100k-200k, 2.2% for AGIs over 200k)
Ordinary dividends: $4,966 (reported on 18.5% of returns)
Here:
$4,966
State:
$5,827
(% of AGI for various income ranges: 1.3% for AGIs below $25k, 1.0% for AGIs $25k-50k, 0.9% for AGIs $50k-75k, 1.1% for AGIs $75k-100k, 1.4% for AGIs $100k-200k, 5.2% for AGIs over 200k)
Net capital gain/loss in AGI: +$13,626 (reported on 11.5% of returns)
Here:
+$13,626
State:
+$14,495
(% of AGI for various income ranges: 0.3% for AGIs $25k-50k, 0.4% for AGIs $50k-75k, 0.6% for AGIs $75k-100k, 1.3% for AGIs $100k-200k, 14.2% for AGIs over 200k)
Profit/loss from business: +$15,777 (reported on 10.8% of returns)
Here:
+$15,777
State:
+$16,268
(% of AGI for various income ranges: 4.2% for AGIs below $25k, 2.3% for AGIs $25k-50k, 2.0% for AGIs $50k-75k, 2.8% for AGIs $75k-100k, 4.1% for AGIs $100k-200k, 5.7% for AGIs over 200k)
Taxable individual retirement arrangement distribution: $13,043 (reported on 10.3% of returns)
15401:
$13,043
Pennsylvania:
$14,550
(% of AGI for various income ranges: 2.9% for AGIs below $25k, 2.0% for AGIs $25k-50k, 2.4% for AGIs $50k-75k, 2.8% for AGIs $75k-100k, 4.1% for AGIs $100k-200k, 2.6% for AGIs over 200k)
Self-employment retirement plans: $18,350 (reported on 0.3% of returns)
15401:
$18,350
Pennsylvania:
$20,922
Total itemized deductions: $20,987 (16% of AGI, reported on 16.4% of returns)
Here:
$20,987
State:
$23,538
Here:
16.3% of AGI
State:
18.4% of AGI
(% of AGI for various income ranges: 4.7% for AGIs below $25k, 4.3% for AGIs $25k-50k, 6.3% for AGIs $50k-75k, 7.2% for AGIs $75k-100k, 9.9% for AGIs $100k-200k, 9.1% for AGIs over 200k)
Charity contributions: $3,654 (reported on 13.3% of returns)
Here:
$3,654
State:
$4,025
(% of AGI for various income ranges: 0.3% for AGIs below $25k, 0.5% for AGIs $25k-50k, 0.9% for AGIs $50k-75k, 1.1% for AGIs $75k-100k, 1.6% for AGIs $100k-200k, 1.3% for AGIs over 200k)
Taxes paid: $7,491 (reported on 16.3% of returns)
15401:
$7,491
State:
$9,982
(% of AGI for various income ranges: 0.6% for AGIs below $25k, 1.0% for AGIs $25k-50k, 1.7% for AGIs $50k-75k, 2.4% for AGIs $75k-100k, 4.0% for AGIs $100k-200k, 4.3% for AGIs over 200k)
Earned income credit: $2,021 (reported on 21.1% of returns)
Here:
$2,021
State:
$2,106
(% of AGI for various income ranges: 6.4% for AGIs below $25k, 0.9% for AGIs $25k-50k)
Percentage of individuals using paid preparers for their 2012 taxes: 57.1%
Here:
57%
State:
53%
(% for various income ranges: 52.4% for AGIs below $25k, 55.9% for AGIs $25k-50k, 61.1% for AGIs $50k-75k, 65.2% for AGIs $75k-100k, 67.9% for AGIs $100k-200k, 88.0% for AGIs over 200k)
Averages for the 2004 tax year for zip code 15401, filed in 2005:
Average Adjusted Gross Income (AGI) in 2004: $37,118 (Individual Income Tax Returns)
Here:
$37,118
State:
$48,049
Salary/wage: $31,915 (reported on 81.0% of returns)
Here:
$31,915
State:
$42,646
(% of AGI for various income ranges: 89.1% for AGIs below $10k, 70.9% for AGIs $10k-25k, 76.9% for AGIs $25k-50k, 79.7% for AGIs $50k-75k, 77.9% for AGIs $75k-100k, 51.5% for AGIs over 100k)
Taxable interest for individuals: $2,143 (reported on 44.2% of returns)
This zip code:
$2,143
Pennsylvania:
$1,657
(% of AGI for various income ranges: 5.9% for AGIs below $10k, 3.7% for AGIs $10k-25k, 2.3% for AGIs $25k-50k, 1.9% for AGIs $50k-75k, 1.8% for AGIs $75k-100k, 2.7% for AGIs over 100k)
Taxable dividends: $3,879 (reported on 22.6% of returns)
Here:
$3,879
State:
$3,566
(% of AGI for various income ranges: 3.5% for AGIs below $10k, 1.4% for AGIs $10k-25k, 1.0% for AGIs $25k-50k, 0.8% for AGIs $50k-75k, 1.1% for AGIs $75k-100k, 5.4% for AGIs over 100k)
Net capital gain/loss: +$7,742 (reported on 15.9% of returns)
Here:
+$7,742
State:
+$9,716
(% of AGI for various income ranges: -0.7% for AGIs below $10k, 0.6% for AGIs $10k-25k, 0.5% for AGIs $25k-50k, 0.8% for AGIs $50k-75k, 1.6% for AGIs $75k-100k, 9.4% for AGIs over 100k)
Profit/loss from business: +$13,595 (reported on 11.0% of returns)
Here:
+$13,595
State:
+$14,267
(% of AGI for various income ranges: 6.9% for AGIs below $10k, 3.7% for AGIs $10k-25k, 2.5% for AGIs $25k-50k, 1.8% for AGIs $50k-75k, 3.3% for AGIs $75k-100k, 7.0% for AGIs over 100k)
IRA payment deduction: $2,635 (reported on 2.8% of returns)
15401:
$2,635
Pennsylvania:
$2,903
(% of AGI for various income ranges: 0.3% for AGIs $10k-25k, 0.3% for AGIs $25k-50k, 0.3% for AGIs $50k-75k, 0.1% for AGIs $75k-100k, 0.1% for AGIs over 100k)
Self-employed pension: $13,176 (reported on 0.5% of returns)
Here:
$13,176
Pennsylvania:
$14,674
(% of AGI for various income ranges: 0.1% for AGIs $50k-75k, 0.1% for AGIs $75k-100k, 0.5% for AGIs over 100k)
Total itemized deductions: $16,389 (17% of AGI, reported on 16.3% of returns)
Here:
$16,389
State:
$18,804
Here:
17.0% of AGI
State:
19.5% of AGI
(% of AGI for various income ranges: 4.3% for AGIs below $10k, 4.2% for AGIs $10k-25k, 5.2% for AGIs $25k-50k, 7.4% for AGIs $50k-75k, 10.2% for AGIs $75k-100k, 9.0% for AGIs over 100k)
Charity contributions deductions: $3,323 (3% of AGI, reported on 14.2% of returns)
Here:
$3,323
State:
$3,337
Here:
3.2% of AGI
State:
3.3% of AGI
(% of AGI for various income ranges: 0.3% for AGIs below $10k, 0.4% for AGIs $10k-25k, 0.7% for AGIs $25k-50k, 1.1% for AGIs $50k-75k, 1.8% for AGIs $75k-100k, 2.1% for AGIs over 100k)
Total tax: $6,085 (reported on 68.9% of returns)
15401:
$6,085
State:
$8,008
(% of AGI for various income ranges: 2.3% for AGIs below $10k, 3.9% for AGIs $10k-25k, 6.8% for AGIs $25k-50k, 9.3% for AGIs $50k-75k, 11.1% for AGIs $75k-100k, 20.1% for AGIs over 100k)
Earned income credit: $1,644 (reported on 19.1% of returns)
Here:
$1,644
State:
$1,643
Percentage of individuals using paid preparers for their 2004 taxes: 58.4%
Here:
58%
State:
56%
(% for various income ranges: 52.2% for AGIs below $10k, 59.3% for AGIs $10k-25k, 57.5% for AGIs $25k-50k, 62.3% for AGIs $50k-75k, 63.4% for AGIs $75k-100k, 73.8% for AGIs over 100k)
Likely homosexual households (counted as self-reported same-sex unmarried-partner households)
Lesbian couples: 0.1% of all households
Gay men: 0.1% of all households
Household received Food Stamps/SNAP in the past 12 months: 3,662 Household did not receive Food Stamps/SNAP in the past 12 months: 10,397
Women who had a birth in the past 12 months: 447 (223 now married, 204 unmarried) Women who did not have a birth in the past 12 months: 5,875 (2,203 now married, 3,675 unmarried)
Housing units in zip code 15401 with a mortgage: 4,805 (456 second mortgage, 21 home equity loan, 407 both second mortgage and home equity loan) Houses without a mortgage: 250
Median monthly owner costs for units with a mortgage: $1,243 Median monthly owner costs for units without a mortgage: $513
Residents with income below the poverty level in 2022:
This zip code:
18.6%
Whole state:
11.8%
Residents with income below 50% of the poverty level in 2022:
This zip code:
9.7%
Whole state:
6.1%
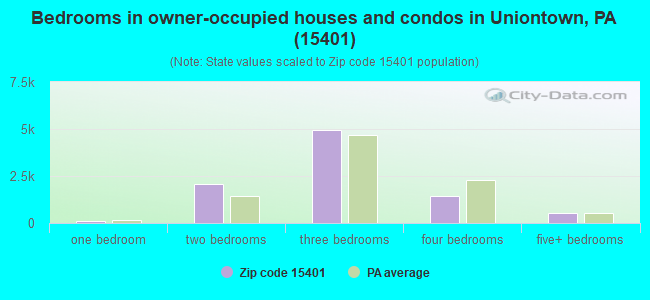
Median number of rooms in houses and condos:
Here:
6.6
State:
6.8
Median number of rooms in apartments:
Here:
4.4
State:
4.3
Notable locations in this zip code not listed on our city pages
Notable locations in zip code 15401: Springdale Golf Course (A), Colonial Golf Course (B), Fayette County Home (C), Saint Basil Home (D), South Union Volunteer Fire Company Station 43 (E), Collier Volunteer Fire Department Station 9 (F), Uniontown Fire Department Station 40 Central Station (G), Uniontown Fire Department Station 40 East End (H). Display/hide their locations on the map
Churches in zip code 15401 include: Hope Chapel (A), Walnut Hill Church (B), Everybodys Mission (C), Searights Church (D), Tent Church (E), Sandy Hill Church (F). Display/hide their locations on the map
Cemeteries: Sylvan Heights Memorial Gardens (1), Sylvan Heights Cemetery (2), Calvary Cemetery (3), Oak Lawn Cemetery (4), Oak Hill Cemetery (5), Oak Grove Cemetery (6), Little White Rock Cemetery (7). Display/hide their locations on the map
Reservoirs: Patsys Lake (A), Hutchinson Reservoir Number Three (B), Hutchinson Reservoir Number Two (C), Dunlap Creek Watershed Reservoir (D), Pa-470 Reservoir (E). Display/hide their locations on the map
Streams, rivers, and creeks: Bennington Spring Run (A), Jennings Run (B), Fans Run (C), Craig Branch (D), Cove Run (E), Lick Run (F), Bute Run (G), Shutes Run (H), Burnt Cabin Branch (I). Display/hide their locations on the map
3,648 married couples with children.
1,525 single-parent households (429 men, 1,096 women).
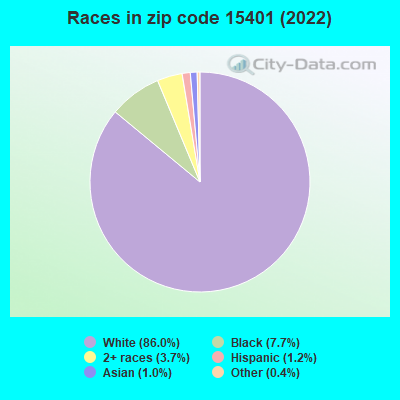
96.3% of residents of 15401 zip code speak English at home.
1.4% of residents speak Spanish at home (64% very well, 17% well, 8% not well, 12% not at all).
1.1% of residents speak other Indo-European language at home (100% very well).
0.5% of residents speak Asian or Pacific Island language at home (82% very well, 18% well).
0.5% of residents speak other language at home (89% very well, 11% well).
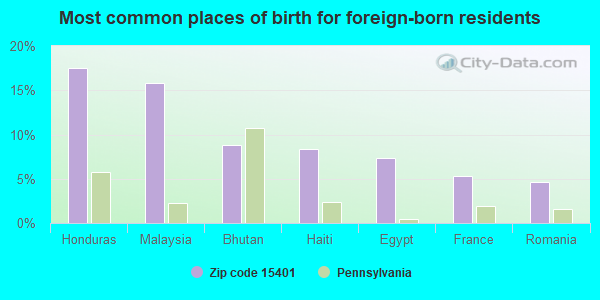
Foreign born population: 810 (2.7%) (49.2% of them are naturalized citizens)
Facilities with environmental interests located in this zip code:
AMERICAN CELLULAR CORPORATION (614 OLD PITTSBURGH ROAD in UNIONTOWN, PA)
ENFORCEMENT/COMPLIANCE ACTIVITY (Integrated Compliance Information System) - ICIS-HQ-2002-6002, FORMAL ENFORCEMENT ACTION (Integrated Compliance Information System) - ICIS-HQ-2002-6002, FORMAL ENFORCEMENT ACTION Business SIC classification: RADIOTELEPHONE COMMUNICATIONS; TELEPHONE COMMUNICATIONS, EXCEPT RADIOTELEPHONE
ARCTIC COVE RESTAURANT (ROUTE 51 in UNIONTOWN, PA)
STATE MASTER (Pennsylvania database) - PCS-PA0097942, National Pollutant Discharge Elimination System Permit National Pollutant Discharge Elimination System NON-MAJOR (Tracking pollutant discharge elimination systems) - permit Business SIC classification: SEWERAGE SYSTEMS Alternative names: ARCTIC CV RESTAURANT, DUNLAP INC
BENNINGTON PLACE SUBDIV (93 BELMEADE TERRACE in UNIONTOWN, PA)
STATE MASTER (Pennsylvania database) - PCS-PA0217662, National Pollutant Discharge Elimination System Permit National Pollutant Discharge Elimination System NON-MAJOR (Tracking pollutant discharge elimination systems) - permit Business SIC classification: SEWERAGE SYSTEMS Alternative names: ANGELO AND NANCY POLI, ANGELO POLI, BENNINGTON SUBDIV, POLI, ANGELO & NANCY
ALBERT GALLATIN SENIOR HIGH SCHOOL (1119 TOWNSHIP DRIVE in UNIONTOWN, PA)
(Geographic Names Information System) (National Center for Education Statistics) - STATE ID-6001 Organizations: ALBERT GALLATIN AREA SD (SCHOOL DISTRICT)
Alternative names: ALBERT GALLATIN AREA SHS
BEN FRANKLIN SCH ( in UNIONTOWN, PA)
(National Center for Education Statistics) - STATE ID-2182 Organizations: UNIONTOWN AREA SD (SCHOOL DISTRICT)
ASHLAND BRANDED MARKETING INC-FAC#956000 (ROUTE #6 in UNIONTOWN, PA)
HAZARDOUS WASTE BIENNIAL REPORTER (Resource Conservation and Recovery Act (tracking hazardous waste)) Small Quantity Generators, between 100 kg and 1000 kg of hazardous waste/month (Resource Conservation and Recovery Act (tracking hazardous waste)) - notification (Resource Conservation and Recovery Act (tracking hazardous waste)) Alternative names: ASHLAND BRAND TER 956 000, ASHLAND BRANDED #956-000
ALLEGHENY POWER UNIONTOWN SVC CTR (RTE 21 EXIT MCCLELLANDTOWN RD in UNIONTOWN, PA)
Conditionally Exempt Small Quantity Generators, less than 100 kg/month of hazardous waste (Resource Conservation and Recovery Act (tracking hazardous waste)) - notification Business NAICS classification: ELECTRIC POWER DISTRIBUTION. Organizations: WEST PENN POWER CO DBA ALLEGHENY POWER (CONTACT/OPERATOR)
, WEST PENN POWER COMPANY (CONTACT/OWNER)
, THE WORK LAND & CATTLE CO (CONTACT/OWNER)
Alternative names: WPP CO LAUREL DIV UNIONTOWN
AMOCO 84700 (53 WEST FAYETTE STREETA in UNIONTOWN, PA)
Small Quantity Generators, between 100 kg and 1000 kg of hazardous waste/month (Resource Conservation and Recovery Act (tracking hazardous waste)) - notification Small Quantity Generators, between 100 kg and 1000 kg of hazardous waste/month (Resource Conservation and Recovery Act (tracking hazardous waste)) - notification Organizations: AMOCO OIL COMPANY (CONTACT/OWNER)
, TOSCO REFINING LP (CONTACT/OWNER)
Alternative names: AMOCO 1364 TANKS, AMOCO 84700 TANKS, TOSCO 2634228 76 GAS STA
ATLANTIC SERVICE STATION (55 MORGANTOWN ST-TANKS in UNIONTOWN, PA)
Conditionally Exempt Small Quantity Generators, less than 100 kg/month of hazardous waste (Resource Conservation and Recovery Act (tracking hazardous waste)) - notification Organizations: OPERNAME (CONTACT/OPERATOR)
, ATLANTIC REFINING & MARKETING (CONTACT/OWNER)
AMOCO 440 TANKS (53 W FAYETTE ST TANKS in UNIONTOWN, PA)
Small Quantity Generators, between 100 kg and 1000 kg of hazardous waste/month (Resource Conservation and Recovery Act (tracking hazardous waste)) - notification Organizations: AMOCO OIL COMPANY (CONTACT/OWNER)
BILLS BODY SHOP (600 N GALLATIN AVE in UNIONTOWN, PA)
Conditionally Exempt Small Quantity Generators, less than 100 kg/month of hazardous waste (Resource Conservation and Recovery Act (tracking hazardous waste)) - notification
BLACKIES TRANSMISSION SERVICE (RD #6 BOX 406 in UNIONTOWN, PA)
Small Quantity Generators, between 100 kg and 1000 kg of hazardous waste/month (Resource Conservation and Recovery Act (tracking hazardous waste)) - notification Organizations: FRED RANALDI (CONTACT/OWNER)
AUSTRALIAN RECOVERY TECHNOLOGIES (RT 166 GERMAN TWP in RALPH, PA)
AIR MAJOR (AIRS/AFS) Business SIC classification: BITUMINOUS COAL AND LIGNITE SURFACE MINING
Housing units lacking complete plumbing facilities: 2.9% Housing units lacking complete kitchen facilities: 4.7%
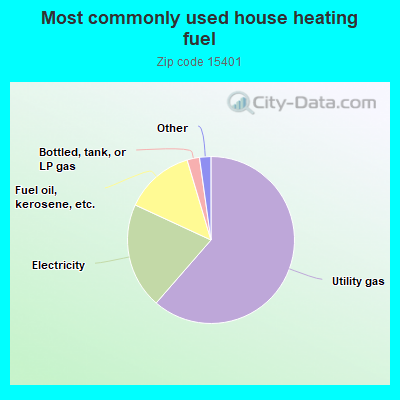
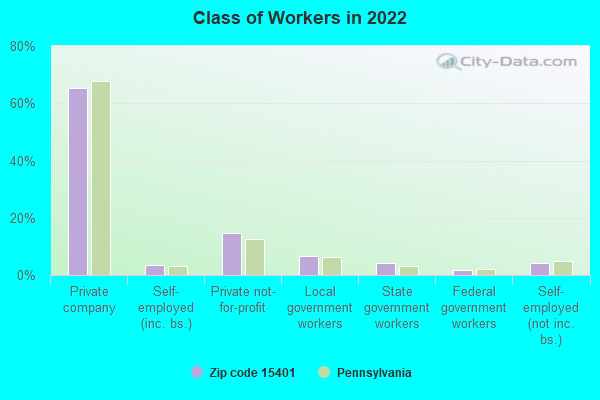
61.4%Utility gas
20.5%Electricity
13.5%Fuel oil, kerosene, etc.
2.4%Bottled, tank, or LP gas
0.9%Wood
0.7%Other fuel
Population in 1990: 34,582. Population change in the 1990s: +1,792 (+5.2%).
Place of birth for U.S.-born residents:
This state: 24,177
Northeast: 823
Midwest: 693
South: 2,661
West: 480
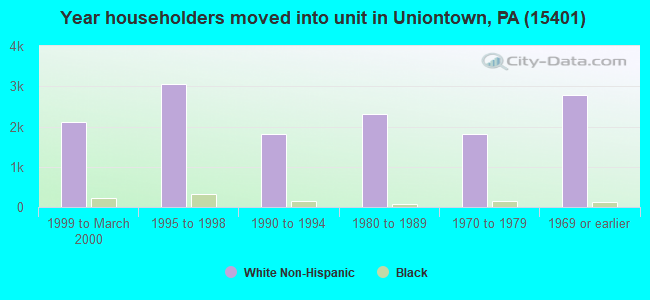
65% of the 15401 zip code residents lived in the same house 5 years ago. Out of people who lived in different houses, 77% lived in this county. Out of people who lived in different counties, 50% lived in Pennsylvania.
89% of the 15401 zip code residents lived in the same house 1 year ago. Out of people who lived in different houses, 73% moved from this county. Out of people who lived in different houses, 14% moved from different county within same state. Out of people who lived in different houses, 10% moved from different state. Out of people who lived in different houses, 2% moved from abroad.
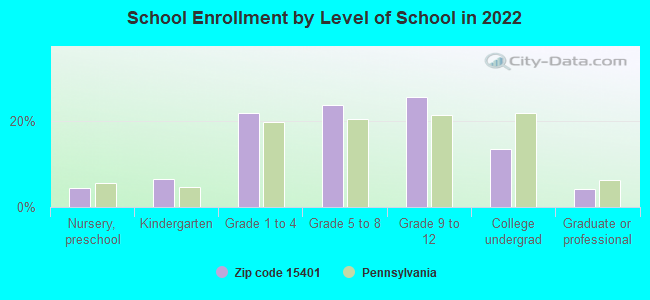
Private vs. public school enrollment:
Students in private schools in grades 1 to 8 (elementary and middle school): 335
Here:
13.7%
Pennsylvania:
15.7%
Students in private schools in grades 9 to 12 (high school): 83
Here:
6.1%
Pennsylvania:
13.4%
Students in private undergraduate colleges: 195
Here:
26.9%
Pennsylvania:
39.8%
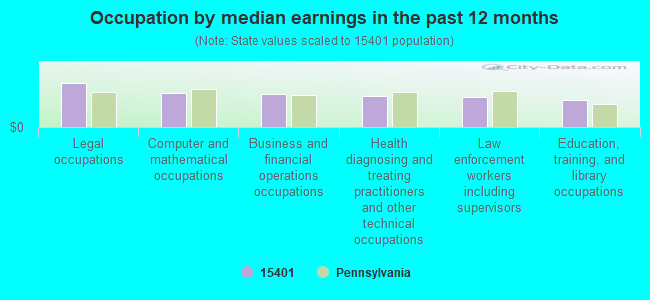
Occupation by median earnings in the past 12 months ($)
104,613Legal occupations
80,544Computer and mathematical occupations
78,341Business and financial operations occupations
72,926Health diagnosing and treating practitioners and other technical occupations
70,864Law enforcement workers including supervisors
63,748Education, training, and library occupations
Companies with federal contracts located in this zip code (UNIONTOWN, PA):
FIKE'S DAIRY INC (47 W CRAIG ST; small business) : $348,372 in 12 contractsfrom 2004 to 2006
Contracts for Dairy Foods and Eggs by Defense Commissary Agency Signed by year:2000: $0; 2001: $0; 2002: $0; 2003: $0; 2004: $72,494; 2005: $202,229; 2006: $73,649.
Biggest contracts:
$85,696 with Defense Commissary Agency for Dairy Foods and Eggs. Signed on 2005-10-01. Completion date: 2005-11-30.
$72,494, same as above.Signed on 2004-10-01. Completion date: 2005-03-31.
$26,629, same as above.Signed on 2006-01-01. Completion date: 2006-01-31.
$25,306, same as above.Signed on 2006-04-01. Completion date: 2006-05-31.
FAIRFIELD INN (283 MCCLELLANDTOWN RD)
$340,472 with Army for Lodging - Hotel/Motel. Signed on 2002-01-25. Completion date: 2003-01-24.
CROWN AMERICAN ASSOCIATES (A P (700 W MAIN ST; small business) : $29,100 in 2 contractsin 2004
$28,920 with Army for Lodging - Hotel/Motel. Signed on 2004-11-04. Completion date: 2004-12-04.
$180, same as above.Signed on 2004-12-02. Completion date: 2004-12-04.
GARY N ALTMAN (206 DERRICK AVENUE; small business) : -$3,675 in 4 contractsfrom 2003 to 2004
$0 with U.S. Army Corps of Engineers - civil program financing only for Other Professional Services. Signed on 2003-08-06. Completion date: 2001-04-06.
-$200 with Army for Other Professional Services. Signed on 2004-09-15. Completion date: 2001-04-06.
-$200 with U.S. Army Corps of Engineers - civil program financing only for Other Professional Services. Signed on 2004-09-15. Completion date: 2001-04-06.
-$3,275, same as above.Signed on 2003-08-06. Completion date: 2001-04-06.
Top industries in this zip code by the number of employees in 2005:
Health Care and Social Assistance: General Medical and Surgical Hospitals (over 1000 employees: 1 establishment)
2004 - 2018 National Fire Incident Reporting System (NFIRS) incidents
Based on the data from the years 2004 - 2018 the average number of fires per year is 70. The highest number of reported fire incidents - 163 took place in 2009, and the least - 6 in 2008. The data has a decreasing trend.
When looking into fire subcategories, the most incidents belonged to: Structure Fires (57.4%), and Outside Fires (22.5%).
Fire incident types reported to NFIRS in Zip Code 15401


 Nearest zip codes: 15472, 15484, 15449, 15445, 15489, 15436.
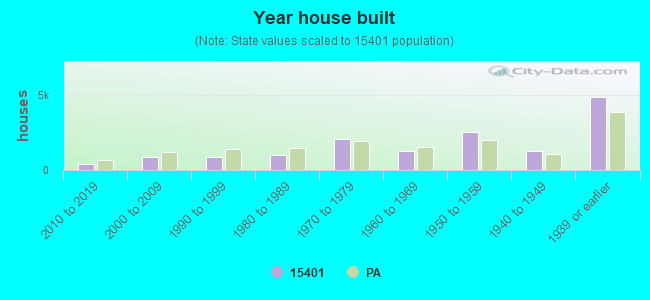


 Based on the data from the years 2004 - 2018 the average number of fires per year is 70. The highest number of reported fire incidents - 163 took place in 2009, and the least - 6 in 2008. The data has a decreasing trend.
 When looking into fire subcategories, the most incidents belonged to: Structure Fires (57.4%), and Outside Fires (22.5%).