Estimated zip code population in 2022: 164
Zip code population in 2010: 349
Zip code population in 2000: 333
March 2022 cost of living index in zip code 15440: 88.1
(less than average, U.S. average is 100)
Land area: 15.2
sq. mi.
Water area: 0.0
sq. mi.
| Population density: 11 people per square mile | | (very low). |
![Age and Sex of Residents in zip code 15440]()
- OSM Map
- General Map
- Google Map
- MSN Map
- OSM Map
- General Map
- Google Map
- MSN Map
- OSM Map
- General Map
- Google Map
- MSN Map
- OSM Map
- General Map
- Google Map
- MSN Map
Please wait while loading the map...
Business Search - 14 Million verified businesses
| Males: 73 |  (44.8%) (44.8%) |
| Females: 90 |  (55.2%) (55.2%) |
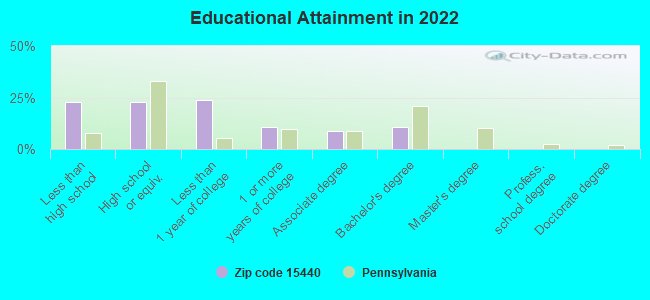
For population 25 years and over in 15440:
- High school or higher: 77.9%
- Bachelor's degree or higher: 10.7%
- Graduate or professional degree: 0.0%
- Mean travel time to work (commute): 46.5 minutes
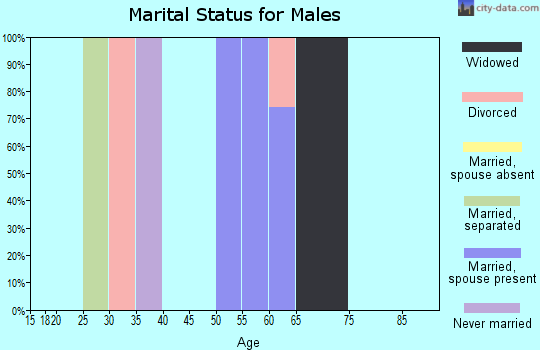
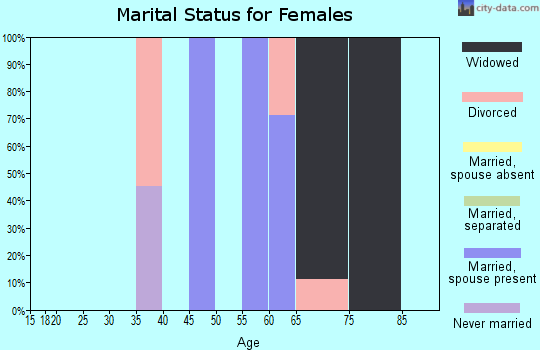
For population 15 years and over in 15440:
- Never married: 19.1%
- Now married: 74.7%
- Separated: 0.0%
- Widowed: 0.0%
- Divorced: 6.2%
Zip code 15440 compared to state average:
- Median household income significantly below state average.
- Median house value significantly below state average.
- Unemployed percentage significantly below state average.
- Black race population percentage significantly below state average.
- Hispanic race population percentage significantly below state average.
- Foreign-born population percentage significantly below state average.
- Renting percentage significantly below state average.
- Length of stay since moving in significantly above state average.
- Number of college students significantly below state average.
- Percentage of population with a bachelor's degree or higher significantly below state average.
Data:
100%
rural population.
Median resident age:| This zip code: | 42.9 years |
| Pennsylvania median age: | 40.9 years |
Average household size:| This zip code: | 2.6 people |
| Pennsylvania: | 2.4 people |
Averages for the 2020 tax year for zip code 15440, filed in 2021:
Average Adjusted Gross Income (AGI) in 2020: $51,480 (Individual Income Tax Returns)
| Here: | $51,480 |
| State: | $75,707 |
Salary/wage: $46,655 (reported on 73.3% of returns)
| Here: | $46,655 |
| State: | $62,806 |
(% of AGI for various income ranges: 1066.7% for AGIs below $25k, 3060.0% for AGIs $25k-50k, 9735.0% for AGIs $50k-75k)
Taxable interest for individuals: $150 (reported on 26.7% of returns)
| This zip code: | $150 |
| Pennsylvania: | $1,633 |
(% of AGI for various income ranges: 15.0% for AGIs $50k-75k)
Percentage of individuals using paid preparers for their 2020 taxes: 80.0%
(% for various income ranges: 80.0% for AGIs below $25k, 75.0% for AGIs $25k-50k, 125.0% for AGIs $50k-75k, 0.0% for AGIs $100k-200k)
Averages for the 2012 tax year for zip code 15440, filed in 2013:
Average Adjusted Gross Income (AGI) in 2012: $40,171 (Individual Income Tax Returns)
| Here: | $40,171 |
| State: | $61,346 |
Salary/wage: $44,064 (reported on 78.6% of returns)
| Here: | $44,064 |
| State: | $51,902 |
(% of AGI for various income ranges: 71.4% for AGIs below $25k, 82.9% for AGIs $25k-50k, 88.4% for AGIs $50k-75k, 90.6% for AGIs $75k-100k)
Taxable interest for individuals: $175 (reported on 28.6% of returns)
| This zip code: | $175 |
| Pennsylvania: | $1,588 |
Total itemized deductions: $21,750 (23% of AGI, reported on 14.3% of returns)
| Here: | $21,750 |
| State: | $23,538 |
| Here: | 23.0% of AGI |
| State: | 18.4% of AGI |
Taxes paid: $5,900 (reported on 14.3% of returns)
Earned income credit: $1,467 (reported on 21.4% of returns)
(% of AGI for various income ranges: 7.8% for AGIs below $25k)
Percentage of individuals using paid preparers for their 2012 taxes: 64.3%
(% for various income ranges: 60.0% for AGIs below $25k, 50.0% for AGIs $25k-50k, 133.3% for AGIs $50k-75k)
Averages for the 2004 tax year for zip code 15440, filed in 2005:
Average Adjusted Gross Income (AGI) in 2004: $27,929 (Individual Income Tax Returns)
| Here: | $27,929 |
| State: | $48,049 |
Salary/wage: $24,638 (reported on 90.7% of returns)
| Here: | $24,638 |
| State: | $42,646 |
(% of AGI for various income ranges: 103.3% for AGIs below $10k, 76.0% for AGIs $10k-25k, 83.4% for AGIs $25k-50k, 76.7% for AGIs $50k-75k)
Taxable interest for individuals: $122 (reported on 35.0% of returns)
| This zip code: | $122 |
| Pennsylvania: | $1,657 |
Total tax: $2,841 (reported on 62.9% of returns)
Earned income credit: $1,029 (reported on 24.3% of returns)
Percentage of individuals using paid preparers for their 2004 taxes: 65.0%
(% for various income ranges: 44.8% for AGIs below $10k, 71.1% for AGIs $10k-25k, 69.6% for AGIs $25k-50k, 70.0% for AGIs $50k-75k)
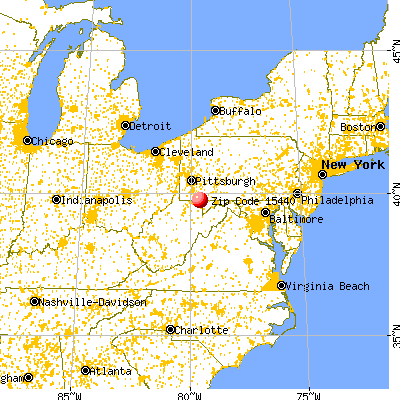
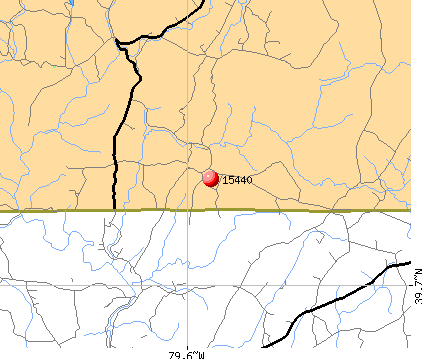
![15440 map]() Nearest zip codes: 15437
Nearest zip codes: 15437,
26525,
15421,
15436,
15445,
15459.
Percentage of family households:| This zip code: | 45.0% |
| Pennsylvania: | 42.6% |
Percentage of households with unmarried partners:| This zip code: | 10.0% |
| Pennsylvania: | 46.5% |
No gay or lesbian households reported
Household received Food Stamps/SNAP in the past 12 months: 11
Household did not receive Food Stamps/SNAP in the past 12 months: 51
Women who did not have a birth in the past 12 months: 49 (22 now married, 27 unmarried)
Housing units in zip code 15440 with a mortgage: 18
Median number of rooms in houses and condos:

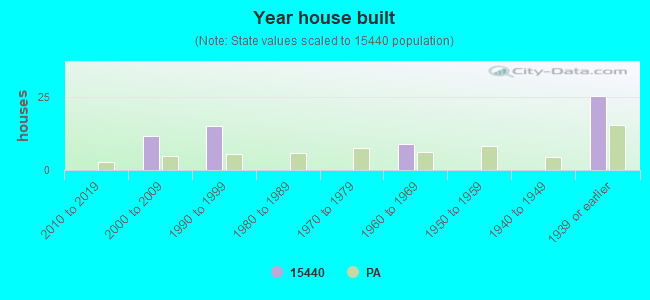
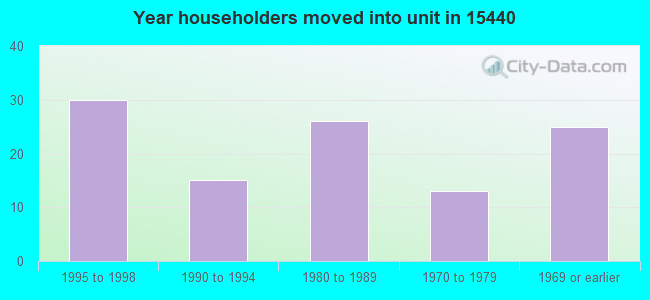
- Year house built (houses)
- 02020 or later
- 02010 to 2019
- 122000 to 2009
- 151990 to 1999
- 01980 to 1989
- 01970 to 1979
- 91960 to 1969
- 01950 to 1959
- 01940 to 1949
- 261939 or earlier
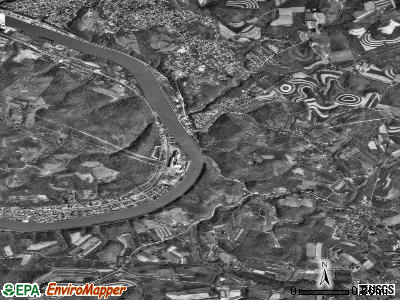
![Zip code 15440 satellite photo by USGS]()
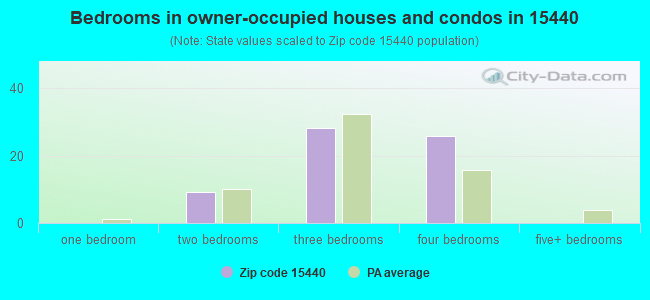
- Bedrooms in owner-occupied houses and condos in 15440
- 0no bedroom
- 01 bedroom
- 92 bedrooms
- 283 bedrooms
- 264 bedrooms
- 05+ bedrooms
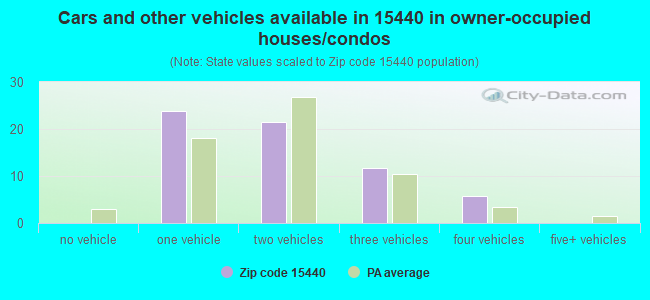
- Cars and other vehicles available in 15440 in owner-occupied houses/condos
- 0no vehicle
- 241 vehicle
- 222 vehicles
- 123 vehicles
- 64 vehicles
- 05+ vehicles
Zip code 15440 household income distribution in 2022
![Zip code 15440 household income distribution in 2022]()
- 9$20,000 to $24,999
- 15$30,000 to $34,999
- 10$60,000 to $74,999
- 5$75,000 to $99,999
- 11$100,000 to $124,999
- 12$200,000 or more
Estimate of home value of owner-occupied houses/condos in 2022 in zip code 15440
![Estimate of home value of owner-occupied houses/condos in 2022 in zip code 15440]()
- 12$15,000 to $19,999
- 8$50,000 to $59,999
- 8$100,000 to $124,999
- 5$175,000 to $199,999
- 13$400,000 to $499,999
- 14$1,000,000 to $1,499,999
Estimated median house (or condo) value in 2022 for:
- White Non-Hispanic householders: $249,484
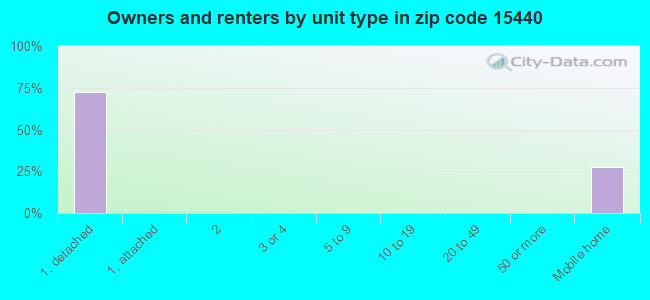
Housing units in structures:
- One, detached: 45
- Mobile homes: 16
Means of transportation to work in zip code 15440
![Means of transportation to work in zip code 15440]()
- 76.6%45Drove a car alone
- 18.7%11Walked
Travel time to work (commute) in zip code 15440
![Travel time to work (commute) in zip code 15440]()
- 11Less than 5 minutes
- 520 to 24 minutes
- 540 to 44 minutes
- 2160 to 89 minutes
- 1190 or more minutes
Percentage of zip code residents living and working in this county: 53.4%
Household type by relationship:
Households: 164
- Male householders: 9 (9 living alone), Female householders: 55 (0 living alone)
53 spouses (53 opposite-sex spouses), 0 unmarried partners, (0 opposite-sex unmarried partners), 48 children (48 natural, 0 adopted, 0 stepchildren), 0 grandchildren, 0 brothers or sisters, 0 parents, 0 foster children, 0 other relatives, 0 non-relatives
Size of family households: 30 2-persons, 22 4-persons
Size of nonfamily households: 9 1-person
49 married couples with children.
0 single-parent households ().
All residents speak English at home
Foreign born population: 0 (0.0%)

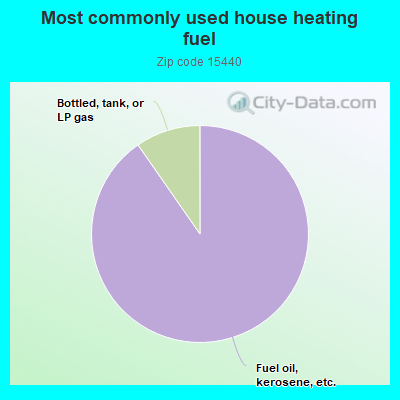
- 90.6%Fuel oil, kerosene, etc.
- 9.7%Bottled, tank, or LP gas
Population in 1990: 94. Population change in the 1990s: +239 (+254.3%).
Place of birth for U.S.-born residents:
- This state: 93
- Midwest: 14
- South: 57
78% of the 15440 zip code residents lived in the same house 5 years ago.
Out of people who lived in different houses, 58% lived in this county.
100% of the 15440 zip code residents lived in the same house 1 year ago.
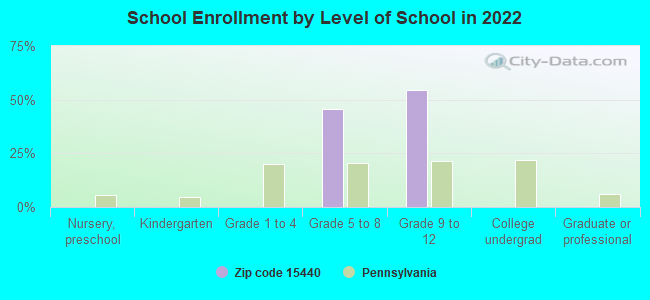
Private vs. public school enrollment:
Students in private schools in grades 1 to 8 (elementary and middle school): 11
| Here: | 100.0% |
| Pennsylvania: | 15.7% |
| Here: | 0.0% |
| Pennsylvania: | 13.4% |
Top industries in this zip code by the number of employees in 2005:
- Construction: Masonry Contractors (1-4 employees: 1 establishment)
- Other Services (except Public Administration): Religious Organizations (1-4: 1)
Home Mortgage Disclosure Act Aggregated Statistics For Year 2009
(Based on 4 partial tracts)
|
| A) FHA, FSA/RHS & VA
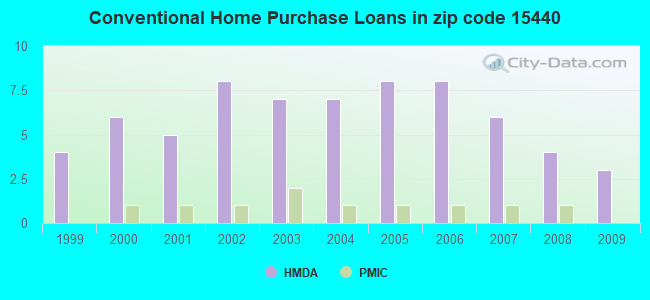
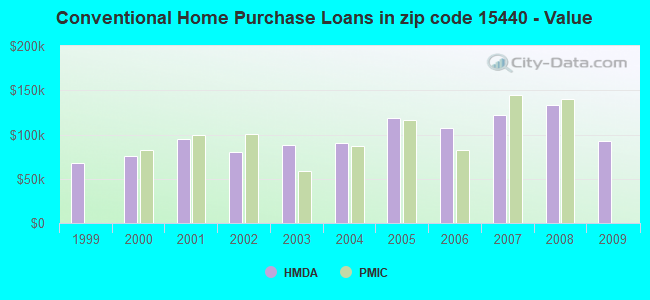
Home Purchase Loans | B) Conventional
Home Purchase Loans | C) Refinancings
| D) Home Improvement Loans
| F) Non-occupant Loans on
< 5 Family Dwellings (A B C & D) | G) Loans On Manufactured
Home Dwelling (A B C & D) |
|---|
| Number | Average Value | Number | Average Value | Number | Average Value | Number | Average Value | Number | Average Value | Number | Average Value |
|---|
| LOANS ORIGINATED | 1 | $99,930 | 3 | $92,467 | 11 | $121,965 | 3 | $46,717 | 1 | $195,050 | 2 | $41,175 |
| APPLICATIONS APPROVED, NOT ACCEPTED | 0 | $0 | 0 | $0 | 1 | $56,350 | 0 | $0 | 0 | $0 | 0 | $0 |
| APPLICATIONS DENIED | 0 | $0 | 1 | $45,150 | 6 | $138,902 | 2 | $24,380 | 1 | $125,220 | 1 | $67,790 |
| APPLICATIONS WITHDRAWN | 0 | $0 | 0 | $0 | 3 | $125,017 | 0 | $0 | 0 | $0 | 0 | $0 |
| FILES CLOSED FOR INCOMPLETENESS | 0 | $0 | 0 | $0 | 0 | $0 | 0 | $0 | 0 | $0 | 0 | $0 |
Aggregated Statistics For Year 2008
(Based on 4 partial tracts)
|
| A) FHA, FSA/RHS & VA
Home Purchase Loans | B) Conventional
Home Purchase Loans | C) Refinancings
| D) Home Improvement Loans
| F) Non-occupant Loans on
< 5 Family Dwellings (A B C & D) | G) Loans On Manufactured
Home Dwelling (A B C & D) |
|---|
| Number | Average Value | Number | Average Value | Number | Average Value | Number | Average Value | Number | Average Value | Number | Average Value |
|---|
| LOANS ORIGINATED | 1 | $77,180 | 4 | $133,192 | 9 | $106,902 | 4 | $46,775 | 1 | $212,990 | 2 | $66,700 |
| APPLICATIONS APPROVED, NOT ACCEPTED | 0 | $0 | 1 | $77,300 | 1 | $100,770 | 0 | $0 | 0 | $0 | 0 | $0 |
| APPLICATIONS DENIED | 0 | $0 | 1 | $101,980 | 8 | $109,324 | 4 | $49,032 | 0 | $0 | 2 | $84,640 |
| APPLICATIONS WITHDRAWN | 0 | $0 | 0 | $0 | 3 | $118,917 | 0 | $0 | 0 | $0 | 0 | $0 |
| FILES CLOSED FOR INCOMPLETENESS | 0 | $0 | 0 | $0 | 1 | $75,490 | 0 | $0 | 0 | $0 | 0 | $0 |
Aggregated Statistics For Year 2007
(Based on 4 partial tracts)
|
| A) FHA, FSA/RHS & VA
Home Purchase Loans | B) Conventional
Home Purchase Loans | C) Refinancings
| D) Home Improvement Loans
| F) Non-occupant Loans on
< 5 Family Dwellings (A B C & D) | G) Loans On Manufactured
Home Dwelling (A B C & D) |
|---|
| Number | Average Value | Number | Average Value | Number | Average Value | Number | Average Value | Number | Average Value | Number | Average Value |
|---|
| LOANS ORIGINATED | 1 | $99,330 | 6 | $121,583 | 8 | $118,654 | 5 | $45,728 | 3 | $104,627 | 3 | $66,300 |
| APPLICATIONS APPROVED, NOT ACCEPTED | 0 | $0 | 1 | $120,760 | 2 | $118,175 | 0 | $0 | 0 | $0 | 0 | $0 |
| APPLICATIONS DENIED | 0 | $0 | 2 | $80,125 | 12 | $102,912 | 4 | $67,062 | 1 | $99,570 | 3 | $89,137 |
| APPLICATIONS WITHDRAWN | 0 | $0 | 1 | $98,130 | 3 | $99,610 | 1 | $49,600 | 1 | $63,690 | 0 | $0 |
| FILES CLOSED FOR INCOMPLETENESS | 0 | $0 | 0 | $0 | 1 | $117,630 | 0 | $0 | 0 | $0 | 0 | $0 |
Aggregated Statistics For Year 2006
(Based on 4 partial tracts)
|
| B) Conventional
Home Purchase Loans | C) Refinancings
| D) Home Improvement Loans
| F) Non-occupant Loans on
< 5 Family Dwellings (A B C & D) | G) Loans On Manufactured
Home Dwelling (A B C & D) |
|---|
| Number | Average Value | Number | Average Value | Number | Average Value | Number | Average Value | Number | Average Value |
|---|
| LOANS ORIGINATED | 8 | $107,066 | 11 | $115,628 | 6 | $36,140 | 4 | $90,782 | 3 | $67,183 |
| APPLICATIONS APPROVED, NOT ACCEPTED | 2 | $101,495 | 2 | $202,330 | 0 | $0 | 1 | $120,760 | 0 | $0 |
| APPLICATIONS DENIED | 2 | $113,720 | 13 | $105,683 | 4 | $56,468 | 1 | $95,840 | 3 | $80,227 |
| APPLICATIONS WITHDRAWN | 1 | $172,050 | 5 | $178,000 | 1 | $33,710 | 0 | $0 | 0 | $0 |
| FILES CLOSED FOR INCOMPLETENESS | 0 | $0 | 1 | $126,180 | 0 | $0 | 0 | $0 | 0 | $0 |
Aggregated Statistics For Year 2005
(Based on 4 partial tracts)
|
| B) Conventional
Home Purchase Loans | C) Refinancings
| D) Home Improvement Loans
| F) Non-occupant Loans on
< 5 Family Dwellings (A B C & D) | G) Loans On Manufactured
Home Dwelling (A B C & D) |
|---|
| Number | Average Value | Number | Average Value | Number | Average Value | Number | Average Value | Number | Average Value |
|---|
| LOANS ORIGINATED | 8 | $118,248 | 12 | $89,267 | 6 | $30,442 | 3 | $102,863 | 3 | $38,127 |
| APPLICATIONS APPROVED, NOT ACCEPTED | 1 | $61,520 | 3 | $105,110 | 1 | $50,930 | 0 | $0 | 1 | $47,680 |
| APPLICATIONS DENIED | 2 | $85,665 | 17 | $87,212 | 6 | $35,237 | 1 | $126,060 | 5 | $65,956 |
| APPLICATIONS WITHDRAWN | 1 | $54,660 | 8 | $113,176 | 1 | $122,450 | 0 | $0 | 1 | $105,710 |
| FILES CLOSED FOR INCOMPLETENESS | 0 | $0 | 2 | $92,105 | 0 | $0 | 0 | $0 | 0 | $0 |
Aggregated Statistics For Year 2004
(Based on 4 partial tracts)
|
| B) Conventional
Home Purchase Loans | C) Refinancings
| D) Home Improvement Loans
| F) Non-occupant Loans on
< 5 Family Dwellings (A B C & D) | G) Loans On Manufactured
Home Dwelling (A B C & D) |
|---|
| Number | Average Value | Number | Average Value | Number | Average Value | Number | Average Value | Number | Average Value |
|---|
| LOANS ORIGINATED | 7 | $90,249 | 14 | $76,661 | 7 | $37,634 | 2 | $82,955 | 1 | $55,620 |
| APPLICATIONS APPROVED, NOT ACCEPTED | 2 | $98,245 | 5 | $77,394 | 1 | $33,590 | 1 | $44,790 | 1 | $68,990 |
| APPLICATIONS DENIED | 3 | $79,743 | 18 | $81,671 | 3 | $30,220 | 1 | $88,980 | 4 | $61,345 |
| APPLICATIONS WITHDRAWN | 2 | $81,870 | 10 | $97,223 | 1 | $22,270 | 0 | $0 | 2 | $63,210 |
| FILES CLOSED FOR INCOMPLETENESS | 0 | $0 | 3 | $100,293 | 0 | $0 | 0 | $0 | 0 | $0 |
Aggregated Statistics For Year 2003
(Based on 4 partial tracts)
|
| B) Conventional
Home Purchase Loans | C) Refinancings
| D) Home Improvement Loans
| F) Non-occupant Loans on
< 5 Family Dwellings (A B C & D) |
|---|
| Number | Average Value | Number | Average Value | Number | Average Value | Number | Average Value |
|---|
| LOANS ORIGINATED | 7 | $87,874 | 24 | $88,504 | 7 | $33,420 | 3 | $97,323 |
| APPLICATIONS APPROVED, NOT ACCEPTED | 1 | $58,510 | 5 | $98,608 | 2 | $33,590 | 0 | $0 |
| APPLICATIONS DENIED | 2 | $57,490 | 16 | $91,926 | 4 | $36,090 | 1 | $77,780 |
| APPLICATIONS WITHDRAWN | 0 | $0 | 8 | $100,248 | 0 | $0 | 0 | $0 |
| FILES CLOSED FOR INCOMPLETENESS | 0 | $0 | 1 | $234,180 | 0 | $0 | 0 | $0 |
Aggregated Statistics For Year 2002
(Based on 4 partial tracts)
|
| B) Conventional
Home Purchase Loans | C) Refinancings
| D) Home Improvement Loans
| F) Non-occupant Loans on
< 5 Family Dwellings (A B C & D) |
|---|
| Number | Average Value | Number | Average Value | Number | Average Value | Number | Average Value |
|---|
| LOANS ORIGINATED | 8 | $79,840 | 15 | $81,350 | 6 | $24,802 | 2 | $78,440 |
| APPLICATIONS APPROVED, NOT ACCEPTED | 0 | $0 | 5 | $81,920 | 1 | $32,390 | 0 | $0 |
| APPLICATIONS DENIED | 2 | $47,620 | 14 | $76,652 | 3 | $32,507 | 1 | $52,010 |
| APPLICATIONS WITHDRAWN | 1 | $98,490 | 11 | $78,249 | 1 | $31,060 | 1 | $32,510 |
| FILES CLOSED FOR INCOMPLETENESS | 0 | $0 | 1 | $109,080 | 0 | $0 | 0 | $0 |
Aggregated Statistics For Year 2001
(Based on 4 partial tracts)
|
| B) Conventional
Home Purchase Loans | C) Refinancings
| D) Home Improvement Loans
| F) Non-occupant Loans on
< 5 Family Dwellings (A B C & D) |
|---|
| Number | Average Value | Number | Average Value | Number | Average Value | Number | Average Value |
|---|
| LOANS ORIGINATED | 5 | $95,092 | 15 | $63,836 | 4 | $26,488 | 1 | $99,330 |
| APPLICATIONS APPROVED, NOT ACCEPTED | 2 | $39,070 | 5 | $66,582 | 1 | $31,060 | 0 | $0 |
| APPLICATIONS DENIED | 4 | $47,678 | 13 | $72,101 | 3 | $23,640 | 0 | $0 |
| APPLICATIONS WITHDRAWN | 0 | $0 | 5 | $66,316 | 0 | $0 | 0 | $0 |
| FILES CLOSED FOR INCOMPLETENESS | 0 | $0 | 1 | $84,400 | 0 | $0 | 0 | $0 |
Aggregated Statistics For Year 2000
(Based on 4 partial tracts)
|
| B) Conventional
Home Purchase Loans | C) Refinancings
| D) Home Improvement Loans
| F) Non-occupant Loans on
< 5 Family Dwellings (A B C & D) |
|---|
| Number | Average Value | Number | Average Value | Number | Average Value | Number | Average Value |
|---|
| LOANS ORIGINATED | 6 | $75,612 | 10 | $59,261 | 6 | $15,492 | 1 | $110,170 |
| APPLICATIONS APPROVED, NOT ACCEPTED | 2 | $52,855 | 4 | $56,408 | 1 | $13,360 | 0 | $0 |
| APPLICATIONS DENIED | 3 | $57,310 | 10 | $67,207 | 4 | $13,938 | 1 | $12,880 |
| APPLICATIONS WITHDRAWN | 1 | $87,770 | 3 | $90,340 | 1 | $15,170 | 0 | $0 |
| FILES CLOSED FOR INCOMPLETENESS | 0 | $0 | 1 | $77,180 | 0 | $0 | 0 | $0 |
Aggregated Statistics For Year 1999
(Based on 2 partial tracts)
|
| B) Conventional
Home Purchase Loans | C) Refinancings
| D) Home Improvement Loans
| F) Non-occupant Loans on
< 5 Family Dwellings (A B C & D) |
|---|
| Number | Average Value | Number | Average Value | Number | Average Value | Number | Average Value |
|---|
| LOANS ORIGINATED | 4 | $68,182 | 5 | $58,346 | 3 | $17,990 | 1 | $39,910 |
| APPLICATIONS APPROVED, NOT ACCEPTED | 1 | $38,880 | 1 | $70,740 | 0 | $0 | 0 | $0 |
| APPLICATIONS DENIED | 2 | $70,650 | 5 | $61,530 | 2 | $16,560 | 0 | $0 |
| APPLICATIONS WITHDRAWN | 1 | $59,320 | 2 | $82,395 | 0 | $0 | 0 | $0 |
| FILES CLOSED FOR INCOMPLETENESS | 0 | $0 | 0 | $0 | 0 | $0 | 0 | $0 |
Private Mortgage Insurance Companies Aggregated Statistics For Year 2008
(Based on 4 partial tracts)
|
| A) Conventional
Home Purchase Loans | B) Refinancings
|
|---|
| Number | Average Value | Number | Average Value |
|---|
| LOANS ORIGINATED | 1 | $140,030 | 1 | $86,450 |
| APPLICATIONS APPROVED, NOT ACCEPTED | 1 | $77,900 | 0 | $0 |
| APPLICATIONS DENIED | 0 | $0 | 0 | $0 |
| APPLICATIONS WITHDRAWN | 0 | $0 | 0 | $0 |
| FILES CLOSED FOR INCOMPLETENESS | 0 | $0 | 0 | $0 |
Aggregated Statistics For Year 2007
(Based on 4 partial tracts)
|
| A) Conventional
Home Purchase Loans |
|---|
| Number | Average Value |
|---|
| LOANS ORIGINATED | 1 | $144,360 |
| APPLICATIONS APPROVED, NOT ACCEPTED | 0 | $0 |
| APPLICATIONS DENIED | 0 | $0 |
| APPLICATIONS WITHDRAWN | 0 | $0 |
| FILES CLOSED FOR INCOMPLETENESS | 0 | $0 |
Aggregated Statistics For Year 2006
(Based on 4 partial tracts)
|
| A) Conventional
Home Purchase Loans | B) Refinancings
|
|---|
| Number | Average Value | Number | Average Value |
|---|
| LOANS ORIGINATED | 1 | $82,110 | 1 | $104,630 |
| APPLICATIONS APPROVED, NOT ACCEPTED | 0 | $0 | 0 | $0 |
| APPLICATIONS DENIED | 0 | $0 | 0 | $0 |
| APPLICATIONS WITHDRAWN | 0 | $0 | 0 | $0 |
| FILES CLOSED FOR INCOMPLETENESS | 0 | $0 | 0 | $0 |
Aggregated Statistics For Year 2005
(Based on 4 partial tracts)
|
| A) Conventional
Home Purchase Loans | B) Refinancings
|
|---|
| Number | Average Value | Number | Average Value |
|---|
| LOANS ORIGINATED | 1 | $116,430 | 0 | $0 |
| APPLICATIONS APPROVED, NOT ACCEPTED | 0 | $0 | 1 | $113,900 |
| APPLICATIONS DENIED | 0 | $0 | 0 | $0 |
| APPLICATIONS WITHDRAWN | 0 | $0 | 0 | $0 |
| FILES CLOSED FOR INCOMPLETENESS | 0 | $0 | 0 | $0 |
Aggregated Statistics For Year 2004
(Based on 4 partial tracts)
|
| A) Conventional
Home Purchase Loans |
|---|
| Number | Average Value |
|---|
| LOANS ORIGINATED | 1 | $87,290 |
| APPLICATIONS APPROVED, NOT ACCEPTED | 0 | $0 |
| APPLICATIONS DENIED | 0 | $0 |
| APPLICATIONS WITHDRAWN | 0 | $0 |
| FILES CLOSED FOR INCOMPLETENESS | 0 | $0 |
Aggregated Statistics For Year 2003
(Based on 4 partial tracts)
|
| A) Conventional
Home Purchase Loans | B) Refinancings
|
|---|
| Number | Average Value | Number | Average Value |
|---|
| LOANS ORIGINATED | 2 | $58,515 | 1 | $84,280 |
| APPLICATIONS APPROVED, NOT ACCEPTED | 0 | $0 | 0 | $0 |
| APPLICATIONS DENIED | 0 | $0 | 0 | $0 |
| APPLICATIONS WITHDRAWN | 0 | $0 | 0 | $0 |
| FILES CLOSED FOR INCOMPLETENESS | 0 | $0 | 0 | $0 |
Aggregated Statistics For Year 2002
(Based on 4 partial tracts)
|
| A) Conventional
Home Purchase Loans | B) Refinancings
|
|---|
| Number | Average Value | Number | Average Value |
|---|
| LOANS ORIGINATED | 1 | $100,290 | 1 | $45,390 |
| APPLICATIONS APPROVED, NOT ACCEPTED | 0 | $0 | 0 | $0 |
| APPLICATIONS DENIED | 0 | $0 | 0 | $0 |
| APPLICATIONS WITHDRAWN | 0 | $0 | 0 | $0 |
| FILES CLOSED FOR INCOMPLETENESS | 0 | $0 | 0 | $0 |
Aggregated Statistics For Year 2001
(Based on 4 partial tracts)
|
| A) Conventional
Home Purchase Loans | B) Refinancings
|
|---|
| Number | Average Value | Number | Average Value |
|---|
| LOANS ORIGINATED | 1 | $99,090 | 1 | $46,720 |
| APPLICATIONS APPROVED, NOT ACCEPTED | 0 | $0 | 0 | $0 |
| APPLICATIONS DENIED | 0 | $0 | 0 | $0 |
| APPLICATIONS WITHDRAWN | 0 | $0 | 0 | $0 |
| FILES CLOSED FOR INCOMPLETENESS | 0 | $0 | 0 | $0 |
Aggregated Statistics For Year 2000
(Based on 4 partial tracts)
|
| A) Conventional
Home Purchase Loans |
|---|
| Number | Average Value |
|---|
| LOANS ORIGINATED | 1 | $82,110 |
| APPLICATIONS APPROVED, NOT ACCEPTED | 0 | $0 |
| APPLICATIONS DENIED | 0 | $0 |
| APPLICATIONS WITHDRAWN | 0 | $0 |
| FILES CLOSED FOR INCOMPLETENESS | 0 | $0 |
| Most common first names in zip code 15440 among deceased individuals |
| Name | Count | Lived (average) |
|---|
| James | 4 | 70.3 years |
| Robert | 4 | 68.7 years |
| Chester | 3 | 83.0 years |
| Charles | 3 | 84.6 years |
| John | 3 | 81.0 years |
| Elizabeth | 2 | 75.6 years |
| Donald | 2 | 65.5 years |
| Clifford | 2 | 79.0 years |
| June | 2 | 77.5 years |
| Martha | 2 | 77.0 years |
| Most common last names in zip code 15440 among deceased individuals |
| Last name | Count | Lived (average) |
|---|
| Rishel | 7 | 77.1 years |
| Dennis | 4 | 74.0 years |
| Haines | 4 | 81.3 years |
| Henckel | 4 | 68.8 years |
| Savage | 4 | 70.2 years |
| Seese | 4 | 83.4 years |
| Maust | 3 | 84.6 years |
| Johnson | 2 | 72.0 years |
| Baughman | 2 | 84.5 years |
| Gray | 2 | 67.5 years |


 Nearest zip codes: 15437, 26525, 15421, 15436, 15445, 15459.