Estimated zip code population in 2022: 3,384 Zip code population in 2010: 3,684 Zip code population in 2000: 3,740
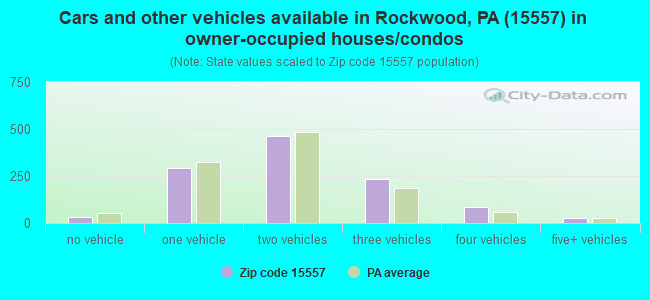
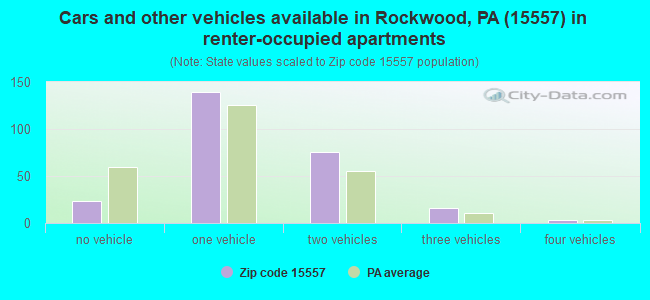
Houses and condos: 2,044 Renter-occupied apartments: 255
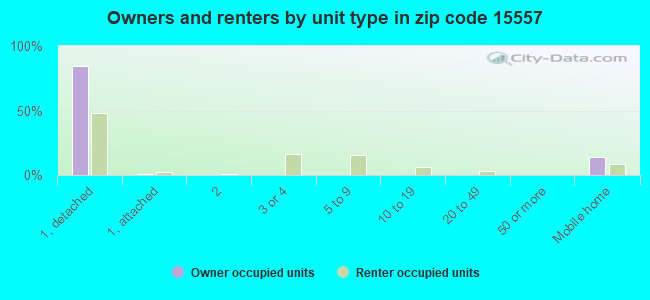
% of renters here:
18%
State:
31%
March 2022 cost of living index in zip code 15557: 90.7 (less than average, U.S. average is 100)
Land area: 90.8 sq. mi. Water area: 0.1 sq. mi.
Population density: 37 people per square mile
(very low).
OSM Map
General Map
Google Map
MSN Map
OSM Map
General Map
Google Map
MSN Map
OSM Map
General Map
Google Map
MSN Map
OSM Map
General Map
Google Map
MSN Map
Please wait while loading the map...
Real estate property taxes paid for housing units in 2022:
This zip code:
0.8% ($1,032)
Pennsylvania:
1.3% ($3,094)
Median real estate property taxes paid for housing units with mortgages in 2022: $1,129 (0.7%) Median real estate property taxes paid for housing units with no mortgage in 2022: $916 (0.8%)
Business Search- 14 Million verified businesses
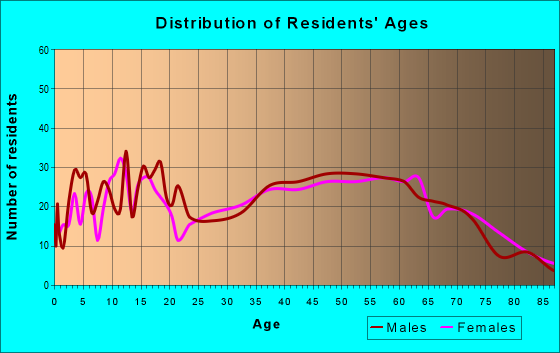
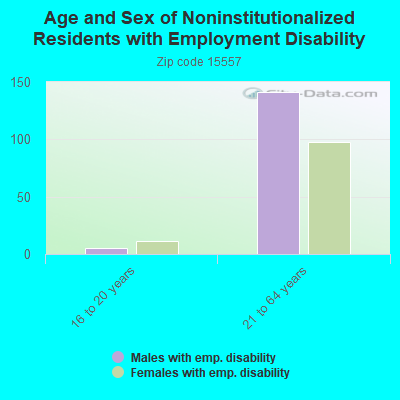
Males: 1,734
(51.2%)
Females: 1,650
(48.8%)
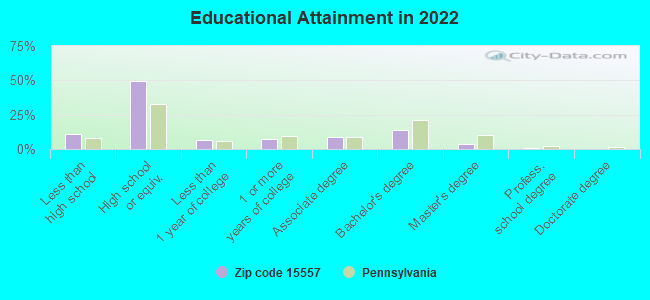
For population 25 years and over in 15557:
High school or higher: 87.3%
Bachelor's degree or higher: 17.3%
Graduate or professional degree: 4.1%
Unemployed: 5.3%
Mean travel time to work (commute): 25.1 minutes
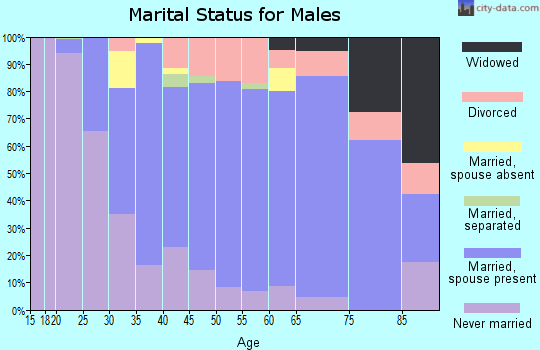
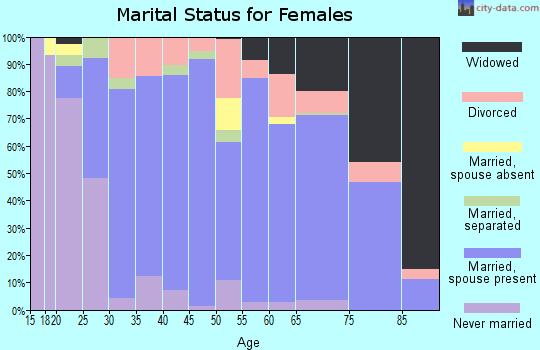
For population 15 years and over in 15557:
Never married: 25.7%
Now married: 53.8%
Separated: 0.7%
Widowed: 8.2%
Divorced: 11.6%
Zip code 15557 compared to state average:
Median house value below state average.
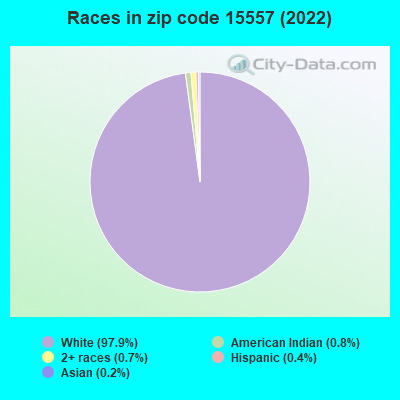
Black race population percentage significantly below state average.
Hispanic race population percentage significantly below state average.
Median age above state average.
Foreign-born population percentage significantly below state average.
Renting percentage below state average.
Length of stay since moving in significantly above state average.
Percentage of population with a bachelor's degree or higher below state average.
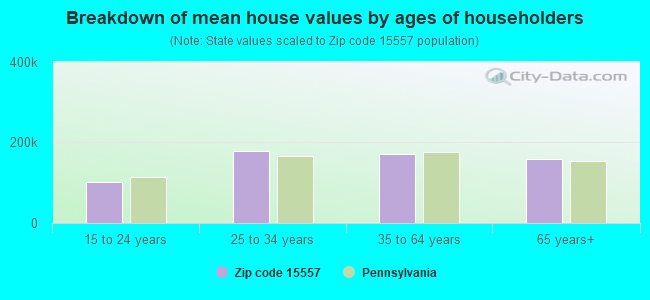
Estimated median house/condo value in 2022: $130,239
15557:
$130,239
Pennsylvania:
$245,500
According to our research of Pennsylvania and other state lists, there were 3 registered sex offenders living in 15557 zip code as of April 25, 2024. The ratio of all residents to sex offenders in zip code 15557 is 1,189 to 1. The ratio of registered sex offenders to all residents in this zip code is lower than the state average.
Median resident age:
This zip code:
45.7 years
Pennsylvania median age:
40.9 years
Average household size:
This zip code:
2.4 people
Pennsylvania:
2.4 people
Averages for the 2020 tax year for zip code 15557, filed in 2021:
Average Adjusted Gross Income (AGI) in 2020: $56,206 (Individual Income Tax Returns)
Here:
$56,206
State:
$75,707
Salary/wage: $47,100 (reported on 79.9% of returns)
Here:
$47,100
State:
$62,806
(% of AGI for various income ranges: 1085.9% for AGIs below $25k, 3264.5% for AGIs $25k-50k, 6119.1% for AGIs $50k-75k, 9618.2% for AGIs $75k-100k, 11604.7% for AGIs $100k-200k)
Taxable interest for individuals: $878 (reported on 33.9% of returns)
This zip code:
$878
Pennsylvania:
$1,633
(% of AGI for various income ranges: 24.9% for AGIs below $25k, 21.3% for AGIs $25k-50k, 33.2% for AGIs $50k-75k, 80.0% for AGIs $75k-100k, 44.7% for AGIs $100k-200k)
Ordinary dividends: $3,947 (reported on 18.4% of returns)
Here:
$3,947
State:
$7,382
(% of AGI for various income ranges: 37.6% for AGIs below $25k, 31.1% for AGIs $25k-50k, 64.1% for AGIs $50k-75k, 131.8% for AGIs $75k-100k, 112.0% for AGIs $100k-200k)
Net capital gain/loss in AGI: +$12,200 (reported on 15.5% of returns)
Here:
+$12,200
State:
+$23,522
(% of AGI for various income ranges: 27.6% for AGIs below $25k, 39.2% for AGIs $25k-50k, 90.5% for AGIs $50k-75k, 213.6% for AGIs $75k-100k, 409.3% for AGIs $100k-200k)
Profit/loss from business: +$12,265 (reported on 11.5% of returns)
Here:
+$12,265
State:
+$16,274
(% of AGI for various income ranges: 94.3% for AGIs below $25k, 140.3% for AGIs $25k-50k, 153.2% for AGIs $50k-75k, 501.8% for AGIs $75k-100k, 454.7% for AGIs $100k-200k)
Taxable individual retirement arrangement distribution: $12,295 (reported on 12.6% of returns)
15557:
$12,295
Pennsylvania:
$18,583
(% of AGI for various income ranges: 110.0% for AGIs below $25k, 124.2% for AGIs $25k-50k, 159.1% for AGIs $50k-75k, 560.0% for AGIs $75k-100k, 573.3% for AGIs $100k-200k)
Total itemized deductions: $36,350 (reported on 1.1% of returns)
Here:
$36,350
State:
$34,850
(% of AGI for various income ranges: 660.9% for AGIs $75k-100k)
Taxes paid: $5,733 (reported on 1.7% of returns)
15557:
$5,733
State:
$8,200
(% of AGI for various income ranges: 156.4% for AGIs $75k-100k)
Earned income credit: $1,996 (reported on 13.2% of returns)
Here:
$1,996
State:
$2,100
(% of AGI for various income ranges: 62.2% for AGIs below $25k, 60.3% for AGIs $25k-50k)
Percentage of individuals using paid preparers for their 2020 taxes: 96.0%
Here:
96%
State:
92%
(% for various income ranges: 94.6% for AGIs below $25k, 95.8% for AGIs $25k-50k, 96.6% for AGIs $50k-75k, 100.0% for AGIs $75k-100k, 94.7% for AGIs $100k-200k, 100.0% for AGIs over 200k)
Averages for the 2012 tax year for zip code 15557, filed in 2013:
Average Adjusted Gross Income (AGI) in 2012: $43,064 (Individual Income Tax Returns)
Here:
$43,064
State:
$61,346
Salary/wage: $37,112 (reported on 81.3% of returns)
Here:
$37,112
State:
$51,902
(% of AGI for various income ranges: 70.0% for AGIs below $25k, 77.3% for AGIs $25k-50k, 76.3% for AGIs $50k-75k, 78.1% for AGIs $75k-100k, 81.7% for AGIs $100k-200k)
Taxable interest for individuals: $902 (reported on 35.7% of returns)
This zip code:
$902
Pennsylvania:
$1,588
(% of AGI for various income ranges: 1.9% for AGIs below $25k, 0.5% for AGIs $25k-50k, 0.7% for AGIs $50k-75k, 0.4% for AGIs $75k-100k, 1.0% for AGIs $100k-200k)
Ordinary dividends: $3,133 (reported on 19.8% of returns)
Here:
$3,133
State:
$5,827
(% of AGI for various income ranges: 1.9% for AGIs below $25k, 0.6% for AGIs $25k-50k, 0.4% for AGIs $50k-75k, 0.6% for AGIs $75k-100k, 4.7% for AGIs $100k-200k)
Net capital gain/loss in AGI: +$9,850 (reported on 12.1% of returns)
Here:
+$9,850
State:
+$14,495
(% of AGI for various income ranges: 0.8% for AGIs $25k-50k, 0.7% for AGIs $75k-100k, 12.9% for AGIs $100k-200k)
Profit/loss from business: +$10,271 (reported on 15.4% of returns)
Here:
+$10,271
State:
+$16,268
(% of AGI for various income ranges: 7.7% for AGIs below $25k, 2.1% for AGIs $25k-50k, 3.4% for AGIs $50k-75k, 3.2% for AGIs $75k-100k, 5.3% for AGIs $100k-200k)
Taxable individual retirement arrangement distribution: $8,604 (reported on 12.6% of returns)
15557:
$8,604
Pennsylvania:
$14,550
(% of AGI for various income ranges: 4.6% for AGIs below $25k, 2.2% for AGIs $25k-50k, 2.0% for AGIs $50k-75k, 2.5% for AGIs $75k-100k, 3.5% for AGIs $100k-200k)
Total itemized deductions: $19,272 (21% of AGI, reported on 15.9% of returns)
Here:
$19,272
State:
$23,538
Here:
21.1% of AGI
State:
18.4% of AGI
(% of AGI for various income ranges: 3.7% for AGIs below $25k, 5.0% for AGIs $25k-50k, 5.9% for AGIs $50k-75k, 8.7% for AGIs $75k-100k, 15.1% for AGIs $100k-200k)
Charity contributions: $3,738 (reported on 11.5% of returns)
Here:
$3,738
State:
$4,025
(% of AGI for various income ranges: 0.9% for AGIs $25k-50k, 0.9% for AGIs $50k-75k, 1.2% for AGIs $75k-100k, 2.2% for AGIs $100k-200k)
Taxes paid: $6,371 (reported on 15.4% of returns)
15557:
$6,371
State:
$9,982
(% of AGI for various income ranges: 0.6% for AGIs below $25k, 1.0% for AGIs $25k-50k, 1.5% for AGIs $50k-75k, 2.5% for AGIs $75k-100k, 6.4% for AGIs $100k-200k)
Earned income credit: $1,966 (reported on 15.9% of returns)
Here:
$1,966
State:
$2,106
(% of AGI for various income ranges: 3.8% for AGIs below $25k, 1.3% for AGIs $25k-50k)
Percentage of individuals using paid preparers for their 2012 taxes: 65.9%
Here:
66%
State:
53%
(% for various income ranges: 60.0% for AGIs below $25k, 65.9% for AGIs $25k-50k, 73.3% for AGIs $50k-75k, 71.4% for AGIs $75k-100k, 91.7% for AGIs $100k-200k)
Averages for the 2004 tax year for zip code 15557, filed in 2005:
Average Adjusted Gross Income (AGI) in 2004: $33,494 (Individual Income Tax Returns)
Here:
$33,494
State:
$48,049
Salary/wage: $30,287 (reported on 80.1% of returns)
Here:
$30,287
State:
$42,646
(% of AGI for various income ranges: 139.8% for AGIs below $10k, 70.7% for AGIs $10k-25k, 80.1% for AGIs $25k-50k, 83.5% for AGIs $50k-75k, 73.2% for AGIs $75k-100k, 38.9% for AGIs over 100k)
Taxable interest for individuals: $1,871 (reported on 45.4% of returns)
This zip code:
$1,871
Pennsylvania:
$1,657
(% of AGI for various income ranges: 16.4% for AGIs below $10k, 3.3% for AGIs $10k-25k, 2.0% for AGIs $25k-50k, 1.2% for AGIs $50k-75k, 2.2% for AGIs $75k-100k, 3.4% for AGIs over 100k)
Taxable dividends: $1,463 (reported on 20.2% of returns)
Here:
$1,463
State:
$3,566
(% of AGI for various income ranges: 9.1% for AGIs below $10k, 1.5% for AGIs $10k-25k, 0.5% for AGIs $25k-50k, 0.2% for AGIs $50k-75k, 1.4% for AGIs $75k-100k, 0.8% for AGIs over 100k)
Net capital gain/loss: +$5,380 (reported on 15.6% of returns)
Here:
+$5,380
State:
+$9,716
(% of AGI for various income ranges: 0.6% for AGIs below $10k, 1.1% for AGIs $10k-25k, 0.4% for AGIs $25k-50k, 1.3% for AGIs $50k-75k, 0.1% for AGIs $75k-100k, 10.7% for AGIs over 100k)
Profit/loss from business: +$5,614 (reported on 17.5% of returns)
Here:
+$5,614
State:
+$14,267
(% of AGI for various income ranges: 9.0% for AGIs below $10k, 5.9% for AGIs $10k-25k, 3.9% for AGIs $25k-50k, 3.0% for AGIs $50k-75k, 0.3% for AGIs $75k-100k)
IRA payment deduction: $3,333 (reported on 3.7% of returns)
15557:
$3,333
Pennsylvania:
$2,903
Total itemized deductions: $14,628 (19% of AGI, reported on 15.0% of returns)
Here:
$14,628
State:
$18,804
Here:
19.1% of AGI
State:
19.5% of AGI
(% of AGI for various income ranges: 4.2% for AGIs $10k-25k, 4.9% for AGIs $25k-50k, 8.3% for AGIs $50k-75k, 11.6% for AGIs $75k-100k, 6.2% for AGIs over 100k)
Charity contributions deductions: $3,166 (4% of AGI, reported on 12.5% of returns)
Here:
$3,166
State:
$3,337
Here:
4.0% of AGI
State:
3.3% of AGI
(% of AGI for various income ranges: 0.4% for AGIs $10k-25k, 0.7% for AGIs $25k-50k, 1.5% for AGIs $50k-75k, 2.3% for AGIs $75k-100k, 1.6% for AGIs over 100k)
Total tax: $4,494 (reported on 73.3% of returns)
15557:
$4,494
State:
$8,008
(% of AGI for various income ranges: 5.9% for AGIs below $10k, 4.5% for AGIs $10k-25k, 6.0% for AGIs $25k-50k, 8.2% for AGIs $50k-75k, 10.5% for AGIs $75k-100k, 22.8% for AGIs over 100k)
Earned income credit: $1,457 (reported on 17.2% of returns)
Here:
$1,457
State:
$1,643
Percentage of individuals using paid preparers for their 2004 taxes: 68.8%
Here:
69%
State:
56%
(% for various income ranges: 66.0% for AGIs below $10k, 63.5% for AGIs $10k-25k, 73.1% for AGIs $25k-50k, 69.8% for AGIs $50k-75k, 77.2% for AGIs $75k-100k, 80.4% for AGIs over 100k)
Household received Food Stamps/SNAP in the past 12 months: 165 Household did not receive Food Stamps/SNAP in the past 12 months: 1,230
Women who had a birth in the past 12 months: 16 (14 now married, 2 unmarried) Women who did not have a birth in the past 12 months: 712 (327 now married, 383 unmarried)
Housing units in zip code 15557 with a mortgage: 491 (44 second mortgage, 2 home equity loan, 36 both second mortgage and home equity loan) Houses without a mortgage: 68
Median monthly owner costs for units with a mortgage: $1,006 Median monthly owner costs for units without a mortgage: $373
Residents with income below the poverty level in 2022:
This zip code:
10.2%
Whole state:
11.8%
Residents with income below 50% of the poverty level in 2022:
This zip code:
6.5%
Whole state:
6.1%
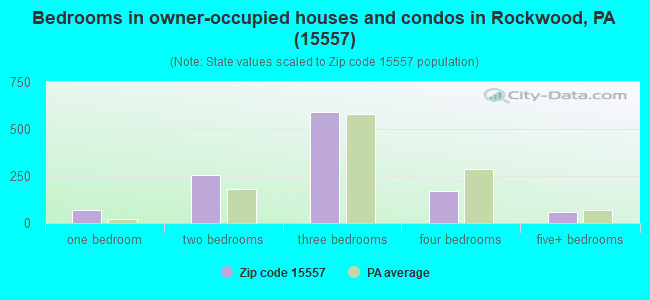
Median number of rooms in houses and condos:
Here:
6.0
State:
6.8
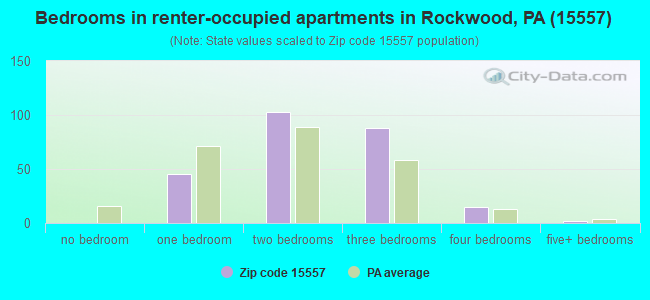
Median number of rooms in apartments:
Here:
4.9
State:
4.3
Notable locations in this zip code not listed on our city pages
Notable locations in zip code 15557: Best Lookout (A), Middlecreek Golf Course (B), Rockwood Junction Station (C), Wilson Creek Station (D), Kings Mountain Country Club (E), Camp Soles (F), Kings Bridge (G), New Centerville and Rural Volunteer Fire Company (H), Rockwood Fire Department (I). Display/hide their locations on the map
Churches in zip code 15557 include: Middle Creek Church (A), Wesley Chapel (B), Laurel Church (C), Laurel Mount Chapel (D), Saint Johns Church (E), Mount Union Church (F). Display/hide their locations on the map
Streams, rivers, and creeks: Bruner Run (A), Weimer Run (B), Spruce Run (C), Middle Creek (D), Stony Batter Run (E), Green King Run (F), Garys Run (G), Fall Creek (H), South Glade Creek (I). Display/hide their locations on the map
414 married couples with children.
120 single-parent households (63 men, 57 women).
98.1% of residents of 15557 zip code speak English at home.
0.2% of residents speak Spanish at home (100% very well).
1.1% of residents speak other Indo-European language at home (54% very well, 11% well, 35% not well).
0.1% of residents speak Asian or Pacific Island language at home (100% not at all).
0.1% of residents speak other language at home (100% well).
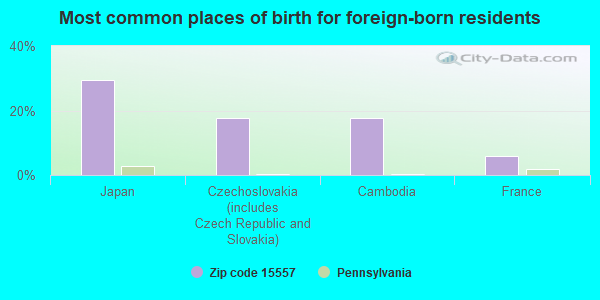
Foreign born population: 17 (0.5%) (82.9% of them are naturalized citizens)
This zip code:
0.5%
Whole state:
7.5%
29%Japan
18%Czechoslovakia (includes Czech Republic and Slovakia)
18%Cambodia
6%France
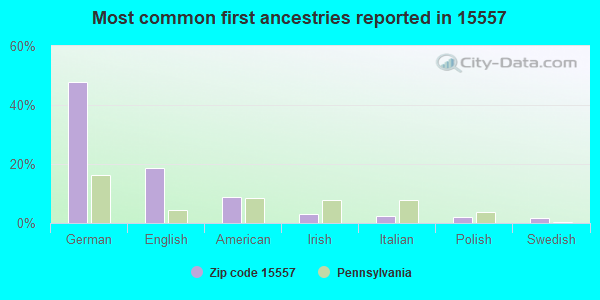
48%German
19%English
9%American
3%Irish
3%Italian
2%Polish
2%Swedish
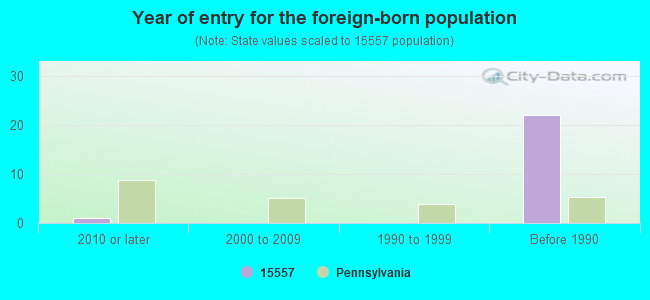
Year of entry for the foreign-born population
12010 or later
02000 to 2009
01990 to 1999
22Before 1990
Facilities with environmental interests located in this zip code:
BEENER KERRY SR STP (RR 2 BOX 8B in ROCKWOOD, PA)
STATE MASTER (Pennsylvania database) - PCS-PA0216101, National Pollutant Discharge Elimination System Permit National Pollutant Discharge Elimination System NON-MAJOR (Tracking pollutant discharge elimination systems) - permit Business SIC classification: SEWERAGE SYSTEMS Alternative names: BEENER, KERRY, BEENER KERRY RESIDENCE STP, KERRY BEENER
Housing units lacking complete plumbing facilities: 6.0% Housing units lacking complete kitchen facilities: 8.7%
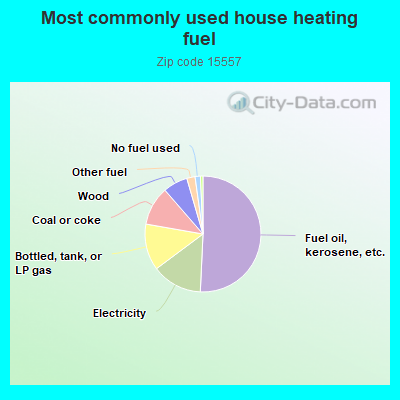
50.9%Fuel oil, kerosene, etc.
14.1%Electricity
13.0%Bottled, tank, or LP gas
10.9%Coal or coke
6.9%Wood
2.3%Other fuel
1.5%No fuel used
0.7%Utility gas
Population in 1990: 5,125.
Place of birth for U.S.-born residents:
This state: 2,981
Northeast: 73
Midwest: 77
South: 160
West: 41
73% of the 15557 zip code residents lived in the same house 5 years ago. Out of people who lived in different houses, 75% lived in this county. Out of people who lived in different counties, 50% lived in Pennsylvania.
96% of the 15557 zip code residents lived in the same house 1 year ago. Out of people who lived in different houses, 62% moved from this county. Out of people who lived in different houses, 34% moved from different county within same state. Out of people who lived in different houses, 7% moved from different state. Out of people who lived in different houses, 2% moved from abroad.
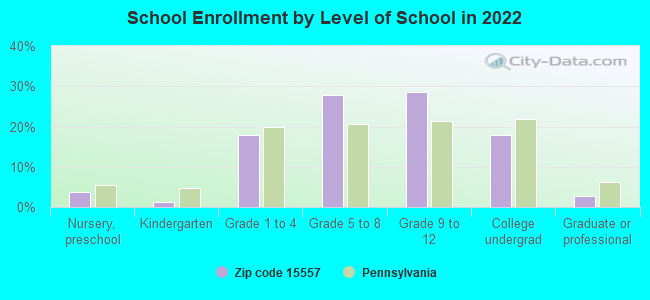
Private vs. public school enrollment:
Students in private schools in grades 1 to 8 (elementary and middle school): 43
Here:
12.6%
Pennsylvania:
15.7%
Students in private schools in grades 9 to 12 (high school): 56
Here:
26.5%
Pennsylvania:
13.4%
Students in private undergraduate colleges: 34
Here:
26.1%
Pennsylvania:
39.8%
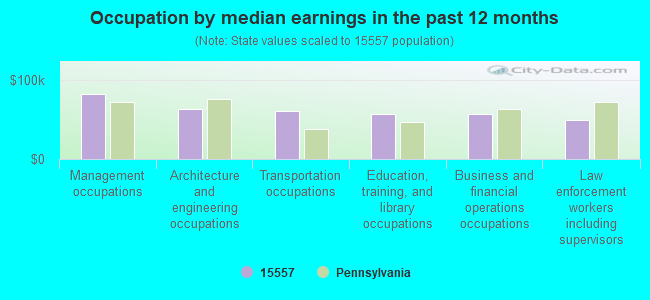
Occupation by median earnings in the past 12 months ($)
82,307Management occupations
62,792Architecture and engineering occupations
60,187Transportation occupations
56,396Education, training, and library occupations
56,211Business and financial operations occupations
49,068Law enforcement workers including supervisors
Companies with federal contracts located in this zip code:
ROBERT L PRITTS (166 RAINBOW RD in ROCKWOOD, PA; small business) : $9,600 in 3 contractsfrom 2004 to 2005
$3,400 with Army for Meat, Poultry, and Fish. Signed on 2005-03-30. Completion date: 2005-04-04.
$3,100 with Army for Fish Hatchery Services. Taking place in MD. Signed on 2004-03-09. Completion date: 2004-03-30.
$3,100 with Army for Fish Hatchery Services. Signed on 2004-09-19. Completion date: 2004-11-01.
Top industries in this zip code by the number of employees in 2005:
Finance and Insurance: Direct Property and Casualty Insurance Carriers (100-249 employees: 1 establishment)
Other Services (except Public Administration): Civic and Social Organizations (10-19: 1, 1-4: 2)
Health Care and Social Assistance: Home Health Care Services (10-19: 1)
Administrative and Support and Waste Management and Remediation Services: Solid Waste Collection (10-19: 1)
People in group quarters in 2010:
18 people in group homes intended for adults
People in group quarters in 2000:
36 people in other noninstitutional group quarters
3 people in other nonhousehold living situations
Fatal accident statistics in 2014:
Fatal accident count: 2
Vehicles involved in fatal accidents: 4
Fatal accidents caused by drunken drivers: 1
Fatalities: 3
Persons involved in fatal accidents: 6
Pedestrians involved in fatal accidents: 0
Fatal accident statistics in 2012:
Fatal accident count: 2
Vehicles involved in fatal accidents: 3
Fatal accidents caused by drunken drivers: 0
Fatalities: 2
Persons involved in fatal accidents: 27
Pedestrians involved in fatal accidents: 0
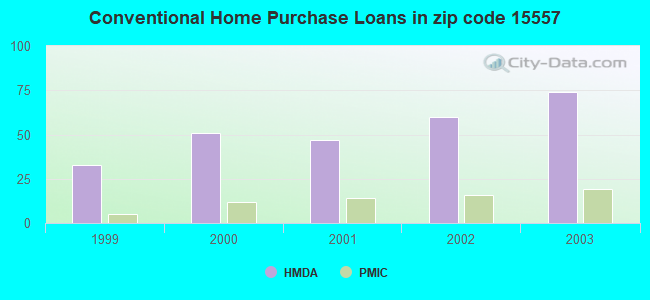
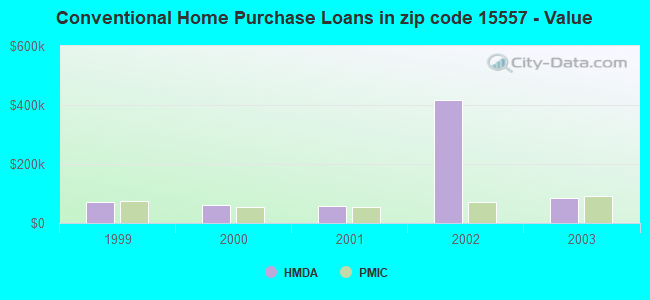
Home Mortgage Disclosure Act Aggregated Statistics For Year 2003 (Based on 4 partial tracts)
A) FHA, FSA/RHS & VA Home Purchase Loans
B) Conventional Home Purchase Loans
C) Refinancings
D) Home Improvement Loans
F) Non-occupant Loans on < 5 Family Dwellings (A B C & D)
Number
Average Value
Number
Average Value
Number
Average Value
Number
Average Value
Number
Average Value
LOANS ORIGINATED
5
$67,494
74
$84,419
264
$66,581
59
$33,426
48
$103,831
APPLICATIONS APPROVED, NOT ACCEPTED
0
$0
6
$65,913
44
$72,525
7
$32,180
2
$94,680
APPLICATIONS DENIED
0
$0
21
$63,630
143
$70,766
37
$18,178
10
$42,221
APPLICATIONS WITHDRAWN
0
$0
10
$69,402
75
$74,289
6
$41,648
6
$96,715
FILES CLOSED FOR INCOMPLETENESS
0
$0
3
$56,637
7
$70,171
0
$0
3
$67,313
Aggregated Statistics For Year 2002 (Based on 4 partial tracts)
A) FHA, FSA/RHS & VA Home Purchase Loans
B) Conventional Home Purchase Loans
C) Refinancings
D) Home Improvement Loans
F) Non-occupant Loans on < 5 Family Dwellings (A B C & D)
Number
Average Value
Number
Average Value
Number
Average Value
Number
Average Value
Number
Average Value
LOANS ORIGINATED
6
$53,770
60
$417,466
167
$58,808
48
$28,440
25
$79,000
APPLICATIONS APPROVED, NOT ACCEPTED
0
$0
4
$59,355
38
$72,133
3
$45,633
3
$78,693
APPLICATIONS DENIED
5
$54,186
27
$50,613
114
$67,761
22
$14,932
2
$25,100
APPLICATIONS WITHDRAWN
0
$0
5
$77,860
68
$70,696
6
$18,790
2
$65,905
FILES CLOSED FOR INCOMPLETENESS
0
$0
0
$0
8
$64,840
0
$0
0
$0
Aggregated Statistics For Year 2001 (Based on 4 partial tracts)
A) FHA, FSA/RHS & VA Home Purchase Loans
B) Conventional Home Purchase Loans
C) Refinancings
D) Home Improvement Loans
F) Non-occupant Loans on < 5 Family Dwellings (A B C & D)
Number
Average Value
Number
Average Value
Number
Average Value
Number
Average Value
Number
Average Value
LOANS ORIGINATED
12
$69,128
47
$58,059
134
$63,932
68
$19,567
20
$78,484
APPLICATIONS APPROVED, NOT ACCEPTED
3
$58,640
7
$90,774
40
$60,138
7
$21,397
2
$193,580
APPLICATIONS DENIED
1
$87,360
28
$52,561
128
$56,045
35
$14,319
6
$77,560
APPLICATIONS WITHDRAWN
3
$53,437
11
$78,707
50
$61,505
9
$48,089
1
$58,650
FILES CLOSED FOR INCOMPLETENESS
0
$0
1
$54,170
7
$84,676
0
$0
1
$110,660
Aggregated Statistics For Year 2000 (Based on 4 partial tracts)
A) FHA, FSA/RHS & VA Home Purchase Loans
B) Conventional Home Purchase Loans
C) Refinancings
D) Home Improvement Loans
F) Non-occupant Loans on < 5 Family Dwellings (A B C & D)
Number
Average Value
Number
Average Value
Number
Average Value
Number
Average Value
Number
Average Value
LOANS ORIGINATED
10
$58,530
51
$61,714
67
$52,865
54
$17,730
21
$62,040
APPLICATIONS APPROVED, NOT ACCEPTED
2
$50,675
7
$63,096
17
$43,667
7
$15,131
1
$58,150
APPLICATIONS DENIED
0
$0
26
$34,806
64
$50,311
17
$9,758
4
$46,182
APPLICATIONS WITHDRAWN
1
$64,060
5
$71,036
31
$47,775
6
$30,787
0
$0
FILES CLOSED FOR INCOMPLETENESS
0
$0
1
$35,290
6
$49,548
0
$0
1
$23,300
Aggregated Statistics For Year 1999 (Based on 2 partial tracts)
A) FHA, FSA/RHS & VA Home Purchase Loans
B) Conventional Home Purchase Loans
C) Refinancings
D) Home Improvement Loans
F) Non-occupant Loans on < 5 Family Dwellings (A B C & D)
Detailed PMIC statistics for the following Tracts:0218.00
, 0219.00
2003 - 2018 National Fire Incident Reporting System (NFIRS) incidents
Based on the data from the years 2003 - 2018 the average number of fire incidents per year is 18. The highest number of reported fires - 37 took place in 2008, and the least - 3 in 2010. The data has an increasing trend.
When looking into fire subcategories, the most incidents belonged to: Structure Fires (59.4%), and Outside Fires (21.4%).
Fire incident types reported to NFIRS in Zip Code 15557
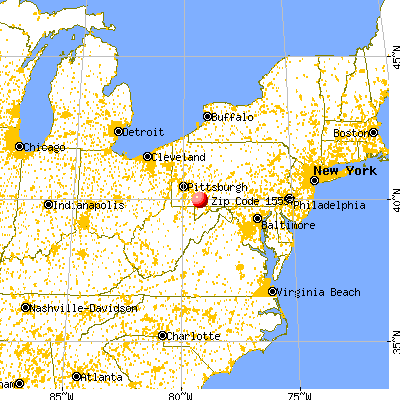


 Nearest zip codes: 15551, 15502, 15540, 15501, 15542, 15622.
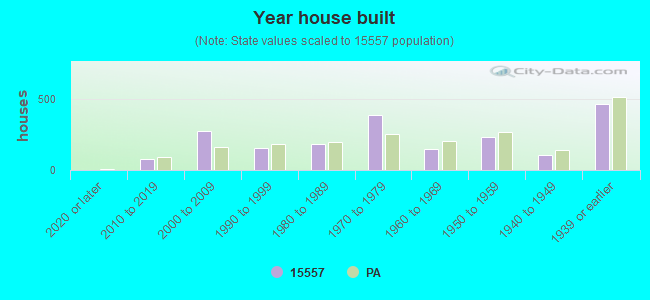


 Based on the data from the years 2003 - 2018 the average number of fire incidents per year is 18. The highest number of reported fires - 37 took place in 2008, and the least - 3 in 2010. The data has an increasing trend.
 When looking into fire subcategories, the most incidents belonged to: Structure Fires (59.4%), and Outside Fires (21.4%).